




Strategies of Enhanced Investments
Introduction to the Global Commodities strategy
Performance update — July 2026
Since launch in May 2020 the strategy has returned +135% (14.9% annualized). 2025: +55.9% vs +16.4% for the S&P 500. Low correlation with equities — executed live at Interactive Brokers. Live track record →

Our Global Commodities strategy invests in major commodity companies involved in resource production and extraction like mining companies (iron, PGMs, gold, etc.), food production, fertilizers, oil and gas production, oil refining, HRC steel and so on using predictive dynamic models.
Our Global Commodities strategy invests in major commodity companies involved in resource production and extraction like mining companies (iron, PGMs, gold, etc.), food production, fertilizers, oil and gas production, oil refining, HRC steel and so on using predictive dynamic models.
The strategy constantly calculates how much profit (on EBITDA level) each company is probably earning at the moment. Our platform finds the most undervalued stocks considering day shifts in production prices, commodity prices and FX. Unlike the approach of traditional banks' investing models Global Commodities recalculates each minute expected profits and cash position of companies in the current market environment — nowcasting. The most undervalued companies in terms of EV/EBITDA multiples and mark-to-market earnings are included into target portfolio.

Preconditions to the Global Commodities Strategy:
- Commodities are strongly undervalued relative to the stock market — by nearly 121%
- Currency devaluation and higher than in the US inflation reduce costs for international commodity companies by more than 10%
- Commodity companies tend to pay high dividends (4−7% on average), have a positive FCF Yield and some of them pay double-digit dividends
Precondition 1: Commodities are strongly undervalued relative to the stock market
During the last 12 years S&P500 has been growing and since 2010 its growth has exceeded 265%, which is far more than Oil and Gold, which have grown by 10% and 73% respectively.
Stock market`s return has been far exceeding commodities` return during the last 12 years

In the last 8 years S&P500 has outperformed the Goldman Sachs Commodity Index by 121.7%. The GS index currently comprises 24 commodities from all commodity sectors — energy products, industrial metals, agricultural products, livestock products and precious metals. So, commodity companies still have potential for growth.
Goldman Sachs Commodity Index (blue line) has a return of -4.2%% in the last 8 years. S&P500 (red line) has a return of +117.5%

Precondition 2: Currency devaluation and higher than in the US inflation reduce costs for international commodity companies by more than 10%
Usually, currencies tend to devaluate in the negative market environment (economic problems, falling oil prices, etc.). In these moments, quite often market indices and commodity prices are falling as well.
However, based on our experience and analysis, market substantially undervalues positive effects of devaluation.
Commodity prices are often measured in US dollars, one of the most stable currencies in the world. However, for companies operating outside the US, CapEx and OpEx costs are usually measured in local currencies. This means that these commodity companies earn more if they are based in a country with an easily devalued local currency — their income remains relatively stable while their operation costs plummet.
Many currencies of developing countries are substantially devalued against US dollar (as it can be seen below) which (combined with rising commodity prices) form favorable environment for relevant commodity players and for the strategy as a whole.
Precondition 3: Commodity companies tend to pay high dividends (4−7% on average), have a positive FCF Yield and some of them pay double-digit dividends
For example, the highest-yielding commodity names in our coverage currently pay 5–13% dividend yields (top-12 average: 8.8%), and many of them combine it with double-digit FCF yields.

Natural gas and Marine shipping companies also pay high dividends, many Marine shipping companies pay double-digit dividends and NG and marine shipping companies on average have an FCF Yield of 5.6%, and it includes the results of shipping companies already after a strong freight rate adjustment.

We did research and found that using the average between current prices and 5-year historical price reduces risks and increases the accuracy of commodities forecasts
If certain commodity moves substantially up (or down) — in interest of long-term model, what is better — to imply commodity prices to stay and current prices, or to imply that it would return to historical levels (or to use some average approach)?
To answer that, firstly, we need to understand what parameter we are forecasting. Probably, if we believe that value of the company is discounted NPV (Net Present Value) of its future cash flows, we are interested in forecasting discounted price for the commodity for the next period; let’s take 10 years for this period in frames of our analysis.
We took Worldbank data for key commodity prices since 1960 and tested which approach would better forecast future discounted commodity price (the price that is important for the company valuation).
It is quite obvious that forecasting error is quite high — it is impossible to predict what would happen in the next 10 years.
Commodities prices analysis
This table shows our average incorrect prediction rate using 3 different approaches.
- Option 1 — Predictions using average prices over the last 5 years.
- Option 2 — Predictions using the current spot price.
- Option 3 — Predictions using the average between the current spot price and 5-year historical price.

However, it turned out that for all the resources it is worthwhile to use current market prices in the forecast (compared to using just historical levels). Moreover, for most of the commodities it is reasonable to take average for current prices and historical levels. In additional to increased precision it also reduces risks — when the commodity prices are elevated, the system averages them with historical levels, which helps to avoid buying at maximums (which makes sense given cyclical nature of the commodity prices).
Nevertheless, we did find an exception to this rule: Using current prices without averaging against historical ones turned out to be more reasonable for predicting the prices of commodities that follow trends rather than cycles like oil and gold.
Global Commodities Strategy uses Nowcasting to predict how much do commodity players earn at the moment and to find the most undervalued commodity companies considering changes in resource cycles
- What is Nowcasting?
- Using Nowcasting to build well-performing predictive models
What is Nowcasting?
Global Commodities was created as a system that consistently selects undervalued companies in commodity industries poised for growth in the near future. This strategy includes not only the analysis of multiples and financial indicators of the target companies, but, especially, the market environment of the commodities and ForEx markets. Global Commodities is able to find market inefficiencies and select the most undervalued companies in each market environment by applying a consistent fundamental approach. This is a more high-tech solution giving you more deep knowledge opportunities.
In other fields, this is called Now Forecasting (or Nowcasting) — a prediction of the current state of the business.
We use Nowcasting to build predictive models.
We have implemented an automatic strategy based on Nowcasting. The mechanism of the strategy can be described in 5 steps:
1. Sourcing Primary Data (SEC Forms, Press-Releases)
We collect financial data by scraping SEC forms and Nasdaq press-releases several times per day.
We collect financial data by scraping SEC forms and Nasdaq press-releases several times per day.
2. Extracting Financials and Operating Results
Further our algorithms automatically extract income statement, balance sheet, cash flow statement and calculate quarter financial results based on these results (Revenue, EBITDA, Net debt, free cash flow). We also extract operating results from SEC forms, including production and reserves. After that quarter results are written down in our database.
Further our algorithms automatically extract income statement, balance sheet, cash flow statement and calculate quarter financial results based on these results (Revenue, EBITDA, Net debt, free cash flow). We also extract operating results from SEC forms, including production and reserves. After that quarter results are written down in our database.
3. Calculating Key Metrics
After that our platform recalculates real-time Enterprise value, actual and historical (EV/EBITDA)* multiples and other metrics, including FCF Yield, Price to Book, etc.

* We use (EV/EBITDA) multiple instead of classical (P/E) multiple, as it does not consider non-recurring gains or losses. And we can see a real operating dynamic.
4. Dynamic Forecasting
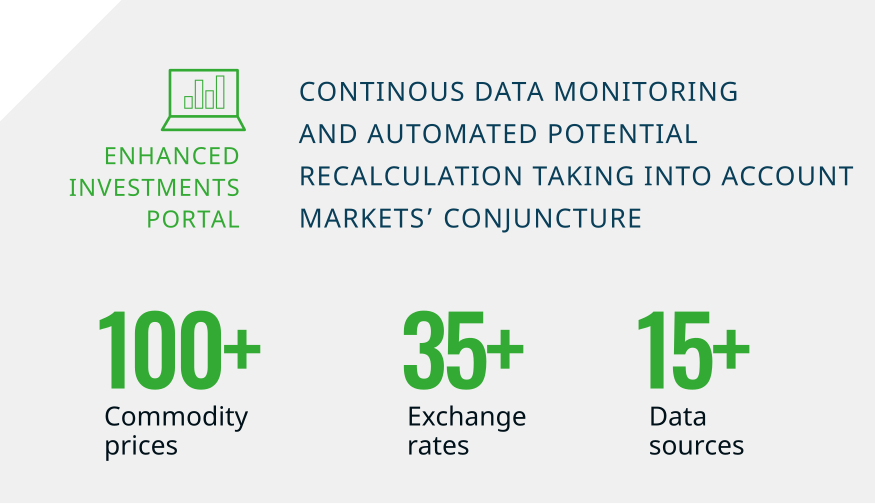
4,000+ companies
160+ commodity players
180+ commodities
160+ commodity players
180+ commodities
Next step is linking a company to resources and currencies. We firstly collect dozens of currencies and more than 180 commodity prices from several open sites (CME, LME, FRED, etc.). Some of them are updated once per day or week, other can be updated every 2−5 minutes. Some of commodities can be converted into other currency (from CNY to USD, for example) if companies operate worldwide or their revenue and costs are measured in different currencies.
After that we link company`s earnings and costs to commodity prices that affect them*. Then our platform can predict each minute how much commodity players are earning in the current and 3-years average market environment. With growth in resource prices that affect earnings, companies tend to earn more and to become more attractive for investments and vice versa.
* On this step we analyze companies' structures of income and costs and link them to resources that affect financials. For example, if we look at a gold producer than all its revenue depends on changes in gold prices. And so on.
Next, the platform calculates (EV/Expected EBITDA) multiple and compares it with historical (EV/EBITDA) multiple. After that it calculates companies` potentials, finding the most undervalued ones.

5. Circulating Results
Finally, our platform generates and sends signals when there are big changes in commodities` prices (and what companies it affects) and when it is time to buy/sell shares.
Finally, our platform generates and sends signals when there are big changes in commodities` prices (and what companies it affects) and when it is time to buy/sell shares.

Enhanced Investments Approach
- Prompt recalculating of changes in the market environment, adjusted for risk
- Objective factors and a uniform system for all companies
- Immediate response to changes in commodity prices, stock prices and the dollar exchange rates
- The principle of reversion to the mean for EV/EBITDA multiples is applied
Enhanced Investments Approach
- Prompt recalculating of changes in the market environment, adjusted for risk
- Objective factors and a uniform system for all companies
- Immediate response to changes in commodity prices, stock prices and the dollar exchange rates
- The principle of reversion to the mean for EV/EBITDA multiples is applied
Traditional Banks Approach
- DCF models for infinite period
- Some parameters are subjective (WACC, post-forecast growth rate)
- The models are based on long-term forecasts of commodity prices and the dollar exchange rate
- Models are rarely updated
Traditional Banks Approach
- DCF models for infinite period
- Some parameters are subjective (WACC, post-forecast growth rate)
- The models are based on long-term forecasts of commodity prices and the dollar exchange rate
- Models are rarely updated
Backtest: +460% over 2015–2026 vs +352% for the S&P500
For every company we calculate EBITDА (Earnings before interest, tax and amortization) in current and historical market environment. We take average EBITDA between them if the current market environment is better. Otherwise, (if the current environment is worse) we conservatively take current market environment.
We calculate EV/EBITDA multiple using calculated EBITDA, target EV/EBITDA multiple is considered to be historical level of EV/EBITDA for the last 3 years on the 75% percentile level. Investment is being made in all the companies where calculated potential is >10%.
To test the return and reliability of the strategy, we conducted a point-in-time Backtest from the beginning of 2015 to July 2026 (total-return, current methodology).
The strategy has demonstrated a return well above the market:
Strategy +460.2%
S&P500 +352.0%
Strategy +460.2%
S&P500 +352.0%

Maximum drawdown over the backtest is -60.7% (commodity drawdowns are deep — this is a diversifier, not a core index replacement). In the table below, you can observe strategy's backtesting returns by year.
Actual Performance: +135% since launch (May 2020)
We have launched the strategy on May 31, 2020, and it showed excellent results: the overall result is +135.2% since inception (14.9% annualized) as of July 2026.
In 2022 the strategy gained +5.8% while the S&P 500 fell -14.2%; in 2025 it returned +55.9% vs +16.4% for the index. Maximum drawdown since inception: -42.6%. The strategy's role in a portfolio is diversification: low correlation to equities with commodity upside.

Here are some example deals:
- +57.5% for 152 daysEOG ResourcesBuy price (2022-01-01): 88.83$
Price out: 139.93$ - +28.3% for 101 daysBHP Group LimitedBuy price (2022-09-02): 49.88$
Price out: 63.98$ - +11.9% for 41 daysCoterra EnergyBuy price (2022-02-18): 22.79$
Price out: 25.51$ - +11.7% for 7 daysValero EnergyBuy price (2023-01-05): 119.62$
Price out: 133.60$
Closed-case examples as of January 2023; current portfolio and live positions: frontier.eninvs.com/strategies/global_commodity
SUMMARY
How do we analyze commodity companies?
 PRODUCTIONWhat does the company produce? Is the company increasing production?
 MARKET INVIRONMENTWhat are the current prices for the company’s products relative to the LTM level? What was the historical maximum of prices and under what conditions? What is the consensus on prices in the medium term? Do prices have long-term macro drivers?
 CASH FLOW GENERATIONDoes the company make a lot of money at the FCF level? Does it pay dividends and how much?
 MULTIPLESHow is the company valued at multiples of value relative to historical levels and peers?
 MODELLINGAnalyzing the structure of the company’s revenue and costs, calculating the expected value of revenue and costs in the current market environment, calculating the value of the EV/forecasted EBITDA multiple
 COMPARING TO PEERSHow the company is#undervalued by EV/forecasted EBITDA in comparison with competitors
 Global Commodities incepted on 2020−05−31;
 Outperfoming S&P500 — actual performance of Global Commodities strategy is +135.2% (July 2026);
 Commodities are strongly undervalued relative to the stock market;
 Falling expenses of global commodity companies due to devaluation of currencies in South Africa, Brazil, Argentina, Russia etc.;
 Nearly all sectoral models outperform constant shareholding by an average of +19.2%.
Appendix
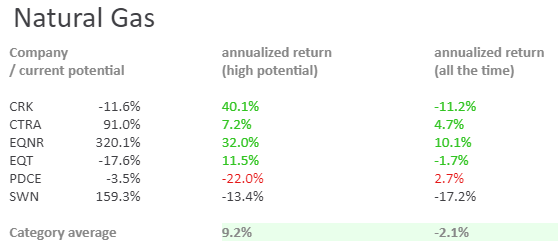
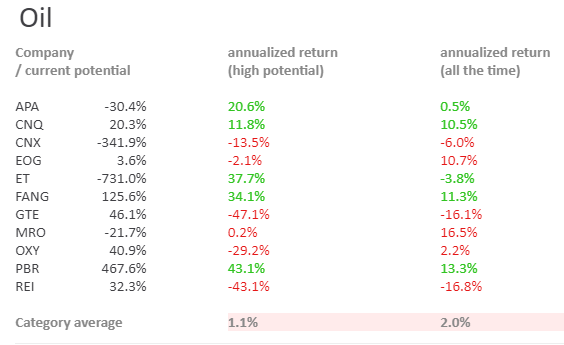
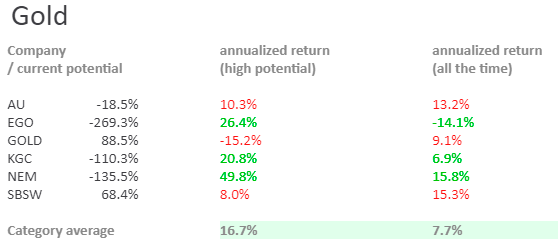
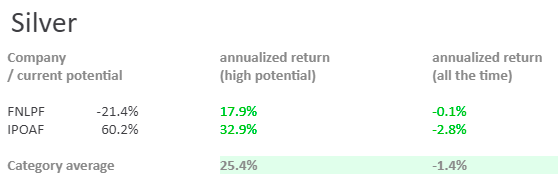
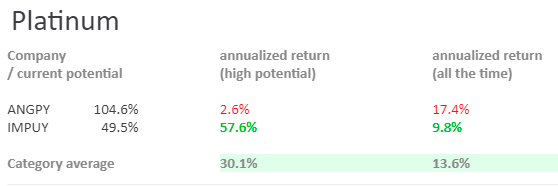
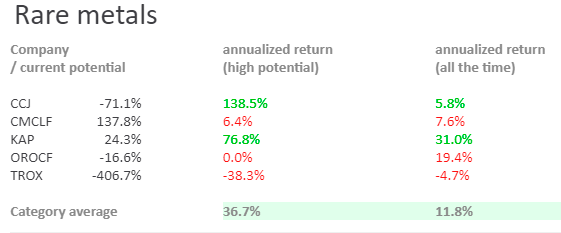
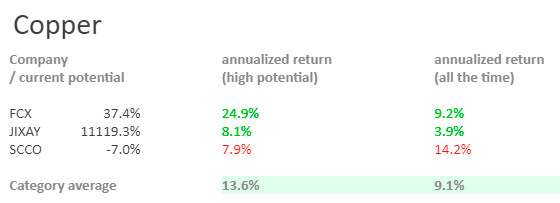
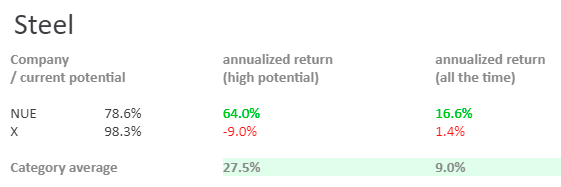
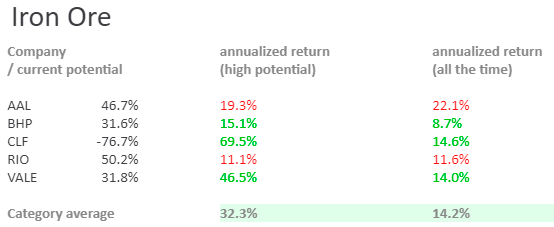
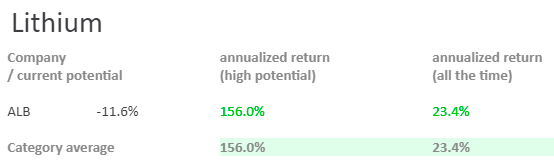
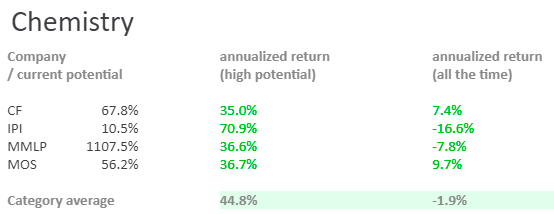
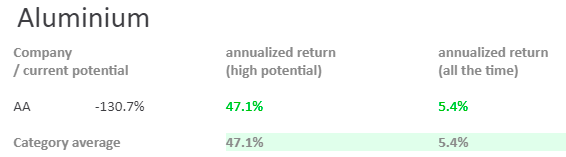
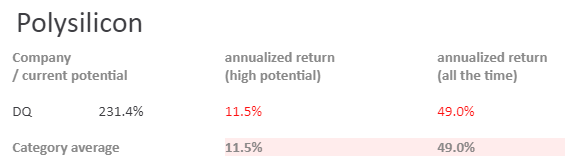
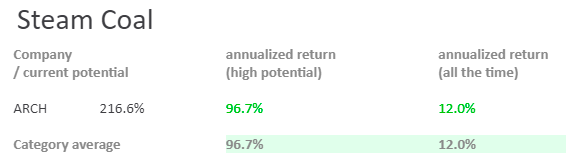
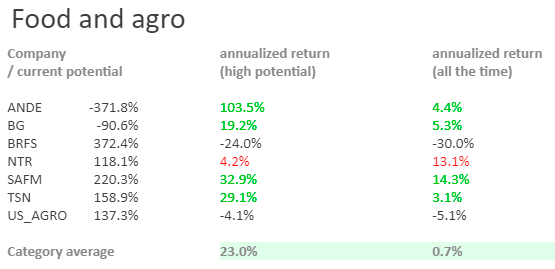
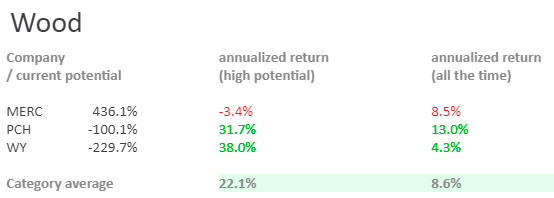
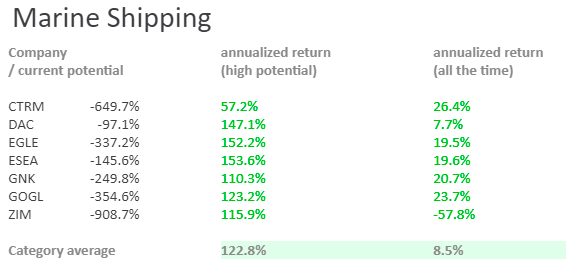
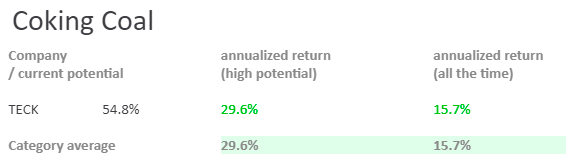
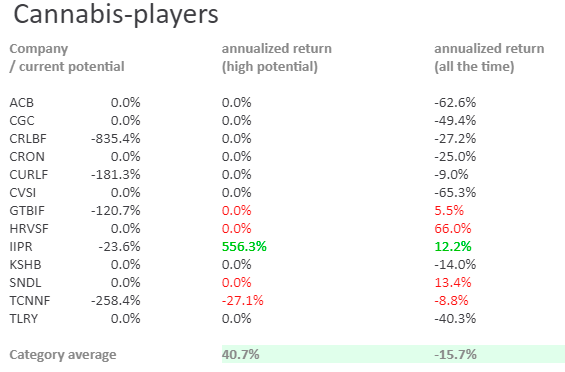
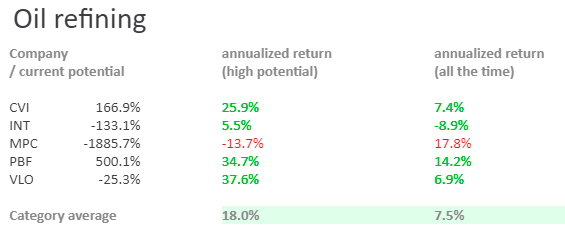
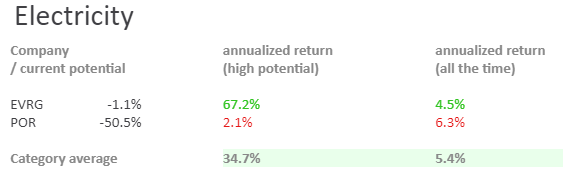
We have implemented an additional module that shows how well the model by companies and sectors generally determines the potential and moments of investing in it relative to simply being in the company all the time.
The obtained analysis shows good results — in almost all sectors and companies, the average return of being in them when the potential is high, exceeds the returns from permanent holding of the company’s shares.
Here are sectoral backtest`s results:



Important disclosures
Nothing on this website should be considered an offer, solicitation of an offer, or advice to buy or sell securities.
Past performance is no guarantee of future results. Any historical returns, expected returns [or probability projections] are hypothetical in nature and may not reflect actual future performance.
All the strategies assume investments in equity invstrumenta only and are more relevant for "agressive investment profile". Russian flagship strategy assumes using up to 20% leverage of total portfolio. GlobalCommodities and US Growth strategy currently assume no leverage.
Results for the Enhanced Investments strategies as compared to the performance of Illustrative Benchmarks is for informational purposes only. Our investment program does not mirror that of the Illustrative Benchmarks and the volatility may be materially different from the volatility of Illustrative Benchmarks. Reference or comparison to an Illustrative Benchmark does not imply that strategies of Enhanced Investments will be constructed in the same way as the Illustrative Benchmark or achieve returns, volatility, or other results similar to those of the Illustrative Benchmark. The S&P 500 is an unmanaged market capitalization-weighted index of 500 common stocks chosen for market size, liquidity, and industry group representation to represent U.S. equity performance.
Past performance is no guarantee of future results. Any historical returns, expected returns [or probability projections] are hypothetical in nature and may not reflect actual future performance.
All the strategies assume investments in equity invstrumenta only and are more relevant for "agressive investment profile". Russian flagship strategy assumes using up to 20% leverage of total portfolio. GlobalCommodities and US Growth strategy currently assume no leverage.
Results for the Enhanced Investments strategies as compared to the performance of Illustrative Benchmarks is for informational purposes only. Our investment program does not mirror that of the Illustrative Benchmarks and the volatility may be materially different from the volatility of Illustrative Benchmarks. Reference or comparison to an Illustrative Benchmark does not imply that strategies of Enhanced Investments will be constructed in the same way as the Illustrative Benchmark or achieve returns, volatility, or other results similar to those of the Illustrative Benchmark. The S&P 500 is an unmanaged market capitalization-weighted index of 500 common stocks chosen for market size, liquidity, and industry group representation to represent U.S. equity performance.
Performance results were prepared by Enhanced Investments, and have not been compiled, reviewed or audited by an independent accountant. Performance estimates are subject to future adjustment and revision. Investors should be aware that a loss of investment is possible. Account holdings are for illustrative purposes only and are not investment recommendations. Additional information, including (i) the calculation methodology; and (ii) a list showing the contribution of each holding to the portfolio’s performance during the time period will be provided upon request.
All statements made via social media sites sponsored or maintained by Enhanced Investments and its affiliates are for informational purposes only and do not constitute a comprehensive description of Enhanced Investments' investment advisory services.
Certain investments are not suitable for all investors. Before investing, consider your investment objectives and applicable fees. The rate of return on investments can vary widely over time, especially for long term investments. Investment losses are possible, including the potential loss of all amounts invested. Information provided by Enhanced Investments is for informational and general educational purposes only and is not investment or financial advice.
All statements made via social media sites sponsored or maintained by Enhanced Investments and its affiliates are for informational purposes only and do not constitute a comprehensive description of Enhanced Investments' investment advisory services.
Certain investments are not suitable for all investors. Before investing, consider your investment objectives and applicable fees. The rate of return on investments can vary widely over time, especially for long term investments. Investment losses are possible, including the potential loss of all amounts invested. Information provided by Enhanced Investments is for informational and general educational purposes only and is not investment or financial advice.
Nothing on this website should be considered an offer, solicitation of an offer, or advice to buy or sell securities.
Past performance is no guarantee of future results. Any historical returns, expected returns [or probability projections] are hypothetical in nature and may not reflect actual future performance.
All the strategies assume investments in equity invstrumenta only and are more relevant for "agressive investment profile". Russian flagship strategy assumes using up to 20% leverage of total portfolio. GlobalCommodities and US Growth strategy currently assume no leverage.
Results for the Enhanced Investments strategies as compared to the performance of Illustrative Benchmarks is for informational purposes only. Our investment program does not mirror that of the Illustrative Benchmarks and the volatility may be materially different from the volatility of Illustrative Benchmarks. Reference or comparison to an Illustrative Benchmark does not imply that strategies of Enhanced Investments will be constructed in the same way as the Illustrative Benchmark or achieve returns, volatility, or other results similar to those of the Illustrative Benchmark. The S&P 500 is an unmanaged market capitalization-weighted index of 500 common stocks chosen for market size, liquidity, and industry group representation to represent U.S. equity performance.
Performance results were prepared by Enhanced Investments, and have not been compiled, reviewed or audited by an independent accountant. Performance estimates are subject to future adjustment and revision. Investors should be aware that a loss of investment is possible. Account holdings are for illustrative purposes only and are not investment recommendations. Additional information, including (i) the calculation methodology; and (ii) a list showing the contribution of each holding to the portfolio’s performance during the time period will be provided upon request.
All statements made via social media sites sponsored or maintained by Enhanced Investments and its affiliates are for informational purposes only and do not constitute a comprehensive description of Enhanced Investments' investment advisory services.
Certain investments are not suitable for all investors. Before investing, consider your investment objectives and applicable fees. The rate of return on investments can vary widely over time, especially for long term investments. Investment losses are possible, including the potential loss of all amounts invested. Information provided by Enhanced Investments is for informational and general educational purposes only and is not investment or financial advice.
Past performance is no guarantee of future results. Any historical returns, expected returns [or probability projections] are hypothetical in nature and may not reflect actual future performance.
All the strategies assume investments in equity invstrumenta only and are more relevant for "agressive investment profile". Russian flagship strategy assumes using up to 20% leverage of total portfolio. GlobalCommodities and US Growth strategy currently assume no leverage.
Results for the Enhanced Investments strategies as compared to the performance of Illustrative Benchmarks is for informational purposes only. Our investment program does not mirror that of the Illustrative Benchmarks and the volatility may be materially different from the volatility of Illustrative Benchmarks. Reference or comparison to an Illustrative Benchmark does not imply that strategies of Enhanced Investments will be constructed in the same way as the Illustrative Benchmark or achieve returns, volatility, or other results similar to those of the Illustrative Benchmark. The S&P 500 is an unmanaged market capitalization-weighted index of 500 common stocks chosen for market size, liquidity, and industry group representation to represent U.S. equity performance.
Performance results were prepared by Enhanced Investments, and have not been compiled, reviewed or audited by an independent accountant. Performance estimates are subject to future adjustment and revision. Investors should be aware that a loss of investment is possible. Account holdings are for illustrative purposes only and are not investment recommendations. Additional information, including (i) the calculation methodology; and (ii) a list showing the contribution of each holding to the portfolio’s performance during the time period will be provided upon request.
All statements made via social media sites sponsored or maintained by Enhanced Investments and its affiliates are for informational purposes only and do not constitute a comprehensive description of Enhanced Investments' investment advisory services.
Certain investments are not suitable for all investors. Before investing, consider your investment objectives and applicable fees. The rate of return on investments can vary widely over time, especially for long term investments. Investment losses are possible, including the potential loss of all amounts invested. Information provided by Enhanced Investments is for informational and general educational purposes only and is not investment or financial advice.
© Enhanced Investments Inc. All rights reserved, 2021