

Strategies of Enhanced Investments



Introduction to the US Leaders Growth Strategy
Launched: august 2019
Actualized: 07/2026
Actualized: 07/2026
Performance update — July 2026
Since launch in August 2019 the strategy has returned +279% vs ~+166% for the S&P 500 (21.3% vs 16.6% annualized, Sharpe 1.02). 2025: +29.6% vs +16.4% for the index. Executed live at Interactive Brokers. Live track record →

The U.S. Leaders strategy is focused in top U.S.-based non-financial companies. The idea is to find positive anomalies when company’s growth rates exceed its historic levels and at the same this company doesn’t cost a lot yet.
The U.S. Leaders strategy is focused in top U.S.-based non-financial companies. The idea is to find positive anomalies when company's growth rates exceed its historic levels and at the same this company doesn't cost a lot yet.
In this article we are describing key principles behind our US Leaders Growth Strategy that was launched in August 2019 and has shown positive results since then outperforming the S&P 500 by a wide margin: +279% since launch vs ~+166% for the index as of July 2026.

The strategy is based on our theoretical research and as well as back-testing on different time-frames which turned to be indeed successful. We have also managed to fine-tune it so that the strategy could work semi-automatically. Without further ado, let's get down to the strategy.
Actually, investing in growth companies is cool!
Actually, investing in growth companies is cool!
In 2016–2020 growth companies index significantly outpaced value companies index, +71% vs +28% respectively — and the gap has only widened in the AI cycle since.
Meanwhile IT-companies EBITDA share has grown from 9 to 24%.
Only 5 companies — Facebook, Amazon, Microsoft, Apple and Google, accounted for 10 out of 14% of the average 10-year S&P yield.
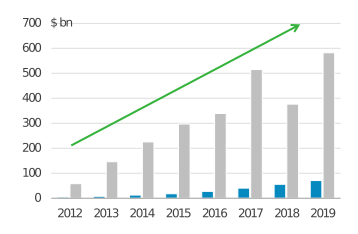

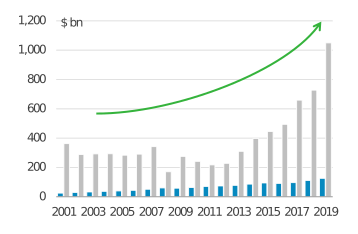


Generally, growing companies tend to grow further, while falling ones usually continue to fall (how brilliant you would say!).
- When a company grows rapidly (more than 15% per year), in 66% of cases it continues to grow rapidly next year.
- When a company demonstrates growth rates lower than 5%, in 58% of cases it grew lower than 5% last year.
(In the mathematical terms we can say that results of consumer companies are auto-corellated — for example, if we take 1500 largest US public companies, correlation among revenue growth in current period and previous period is 74% - that's high!)
Basically, it sounds like a good idea to invest in growth companies. So what can be the problem?
Basically, it sounds like a good idea to invest in growth companies. So what can be the problem?
1
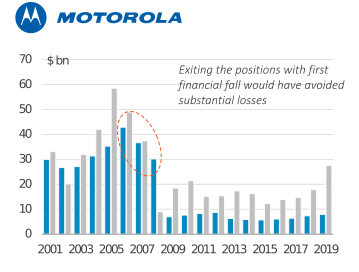
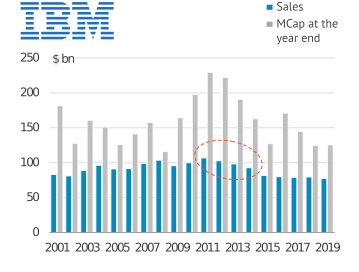
Quite often growth companies stop being "growth companies"
This was the case with Motorola, IBM and many others. But, as our research has shown, if you close your long position when growth shows first signs of slowing down, you would likely avoid substantial losses.
2
Growth companies frequently tend to be overheated and holding them seems to be not a good idea either
One of the best examples is the dot-com bubble of the 2000s. Microsoft and Cisco had all-time high multiples which predetermined their stocks dramatic falls. Falling multiples and share prices of Amazon and Netflix in 2018−2019 is a more recent case
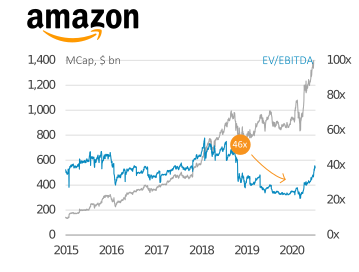
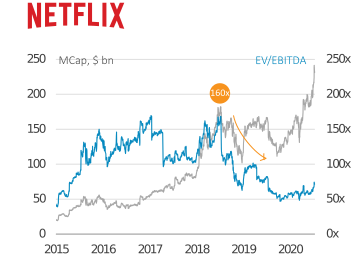
So that means that it’s better to hold growth companies when they show no signs of growth slowing (or even better show growth acceleration) and together with that cost not too high.
Our proprietary strategy solves the issues above in the following way:
1
We take top-30 S&P companies by market capitalization being neither commodity nor financial companies
2
Based on quarterly results investments are made only in those companies which in the last quarter:
- Demonstrate year-to-year average financial growth rates (revenues and EBITDA average) higher than median ones for the last 3 years.
- By EV/EBITDA multiple cost not higher than 75% percentile of such multiple shown for the last 3 years; we calculate share price potential for the company to reach this historical level
3
Following this approach we find positive anomalies when company's growth rates exceed its historic levels and at the same this company doesn't cost a lot yet.
Backtesting results
We have applied strategy back-testing based on the market data since 2015 and the strategy has shown great results. Refreshed point-in-time run through July 2026 (total-return): the strategy multiplied capital 4.9x vs 4.5x for the S&P 500 (14.7% CAGR, Sharpe 0.75, max drawdown -31.7%) — while the live production track since 2019 outperforms the index by 4.7 pp annually.
We have applied strategy back-testing based on the market data since 2015 and the strategy has shown great results. Refreshed point-in-time run through July 2026 (total-return): the strategy multiplied capital 4.9x vs 4.5x for the S&P 500 (14.7% CAGR, Sharpe 0.75, max drawdown -31.7%) — while the live production track since 2019 outperforms the index by 4.7 pp annually.
Great returns — on average >2x times exceed the stock index.
Dropdown is comparable to investing in index
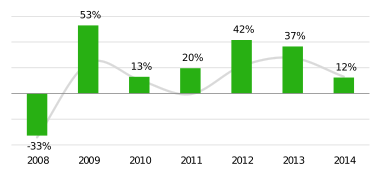
In 2008 the strategy would have shown negative results, but then it would have rapidly rebounded and eventually outperformed the index.
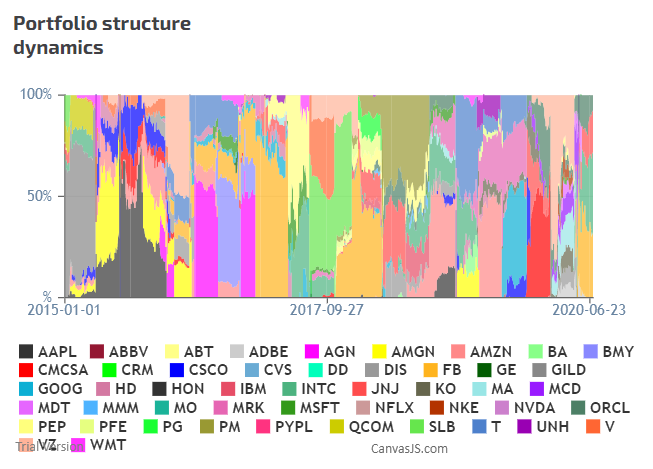
Track record (back-test spliced with live production, 2019–2026) is presented below

| Year | Strategy | S&P 500 |
|---|---|---|
| 2015 | 21.1% | -0.7% |
| 2016 | 5.3% | 9.5% |
| 2017 | 49.8% | 19.4% |
| 2018 | -2.6% | -6.2% |
| 2019 | 34.2% | 28.9% |
| 2020 | 14.2% | 16.2% |
| 2021 | 30.6% | 27.4% |
| 2022 | -17.1% | -19.7% |
| 2023 | 58.3% | 24.2% |
| 2024 | 37.6% | 23.5% |
| 2025 | 29.6% | 16.4% |
| 2026 YTD | 3.8% | 10.0% |
| Average (2015–2025) | 23.7% | 12.6% |
| Total | 272.4% | 132.4% |
Return by year
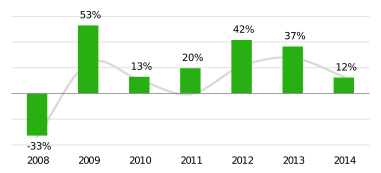

Approximate backtest run on the period 2008−2014 shows following results:

Approximate backtest run on the period 2008−2014 shows following results:



Important disclosures
Nothing on this website should be considered an offer, solicitation of an offer, or advice to buy or sell securities.
Past performance is no guarantee of future results. Any historical returns, expected returns [or probability projections] are hypothetical in nature and may not reflect actual future performance.
All the strategies assume investments in equity invstrumenta only and are more relevant for "agressive investment profile". Russian flagship strategy assumes using up to 20% leverage of total portfolio. GlobalCommodities and US Growth strategy currently assume no leverage.
Results for the Enhanced Investments strategies as compared to the performance of Illustrative Benchmarks is for informational purposes only. Our investment program does not mirror that of the Illustrative Benchmarks and the volatility may be materially different from the volatility of Illustrative Benchmarks. Reference or comparison to an Illustrative Benchmark does not imply that strategies of Enhanced Investments will be constructed in the same way as the Illustrative Benchmark or achieve returns, volatility, or other results similar to those of the Illustrative Benchmark. The S&P 500 is an unmanaged market capitalization-weighted index of 500 common stocks chosen for market size, liquidity, and industry group representation to represent U.S. equity performance.
Past performance is no guarantee of future results. Any historical returns, expected returns [or probability projections] are hypothetical in nature and may not reflect actual future performance.
All the strategies assume investments in equity invstrumenta only and are more relevant for "agressive investment profile". Russian flagship strategy assumes using up to 20% leverage of total portfolio. GlobalCommodities and US Growth strategy currently assume no leverage.
Results for the Enhanced Investments strategies as compared to the performance of Illustrative Benchmarks is for informational purposes only. Our investment program does not mirror that of the Illustrative Benchmarks and the volatility may be materially different from the volatility of Illustrative Benchmarks. Reference or comparison to an Illustrative Benchmark does not imply that strategies of Enhanced Investments will be constructed in the same way as the Illustrative Benchmark or achieve returns, volatility, or other results similar to those of the Illustrative Benchmark. The S&P 500 is an unmanaged market capitalization-weighted index of 500 common stocks chosen for market size, liquidity, and industry group representation to represent U.S. equity performance.
Performance results were prepared by Enhanced Investments, and have not been compiled, reviewed or audited by an independent accountant. Performance estimates are subject to future adjustment and revision. Investors should be aware that a loss of investment is possible. Account holdings are for illustrative purposes only and are not investment recommendations. Additional information, including (i) the calculation methodology; and (ii) a list showing the contribution of each holding to the portfolio’s performance during the time period will be provided upon request.
All statements made via social media sites sponsored or maintained by Enhanced Investments and its affiliates are for informational purposes only and do not constitute a comprehensive description of Enhanced Investments' investment advisory services.
Certain investments are not suitable for all investors. Before investing, consider your investment objectives and applicable fees. The rate of return on investments can vary widely over time, especially for long term investments. Investment losses are possible, including the potential loss of all amounts invested. Information provided by Enhanced Investments is for informational and general educational purposes only and is not investment or financial advice.
All statements made via social media sites sponsored or maintained by Enhanced Investments and its affiliates are for informational purposes only and do not constitute a comprehensive description of Enhanced Investments' investment advisory services.
Certain investments are not suitable for all investors. Before investing, consider your investment objectives and applicable fees. The rate of return on investments can vary widely over time, especially for long term investments. Investment losses are possible, including the potential loss of all amounts invested. Information provided by Enhanced Investments is for informational and general educational purposes only and is not investment or financial advice.
Nothing on this website should be considered an offer, solicitation of an offer, or advice to buy or sell securities.
Past performance is no guarantee of future results. Any historical returns, expected returns [or probability projections] are hypothetical in nature and may not reflect actual future performance.
All the strategies assume investments in equity invstrumenta only and are more relevant for "agressive investment profile". Russian flagship strategy assumes using up to 20% leverage of total portfolio. GlobalCommodities and US Growth strategy currently assume no leverage.
Results for the Enhanced Investments strategies as compared to the performance of Illustrative Benchmarks is for informational purposes only. Our investment program does not mirror that of the Illustrative Benchmarks and the volatility may be materially different from the volatility of Illustrative Benchmarks. Reference or comparison to an Illustrative Benchmark does not imply that strategies of Enhanced Investments will be constructed in the same way as the Illustrative Benchmark or achieve returns, volatility, or other results similar to those of the Illustrative Benchmark. The S&P 500 is an unmanaged market capitalization-weighted index of 500 common stocks chosen for market size, liquidity, and industry group representation to represent U.S. equity performance.
Performance results were prepared by Enhanced Investments, and have not been compiled, reviewed or audited by an independent accountant. Performance estimates are subject to future adjustment and revision. Investors should be aware that a loss of investment is possible. Account holdings are for illustrative purposes only and are not investment recommendations. Additional information, including (i) the calculation methodology; and (ii) a list showing the contribution of each holding to the portfolio’s performance during the time period will be provided upon request.
All statements made via social media sites sponsored or maintained by Enhanced Investments and its affiliates are for informational purposes only and do not constitute a comprehensive description of Enhanced Investments' investment advisory services.
Certain investments are not suitable for all investors. Before investing, consider your investment objectives and applicable fees. The rate of return on investments can vary widely over time, especially for long term investments. Investment losses are possible, including the potential loss of all amounts invested. Information provided by Enhanced Investments is for informational and general educational purposes only and is not investment or financial advice.
Past performance is no guarantee of future results. Any historical returns, expected returns [or probability projections] are hypothetical in nature and may not reflect actual future performance.
All the strategies assume investments in equity invstrumenta only and are more relevant for "agressive investment profile". Russian flagship strategy assumes using up to 20% leverage of total portfolio. GlobalCommodities and US Growth strategy currently assume no leverage.
Results for the Enhanced Investments strategies as compared to the performance of Illustrative Benchmarks is for informational purposes only. Our investment program does not mirror that of the Illustrative Benchmarks and the volatility may be materially different from the volatility of Illustrative Benchmarks. Reference or comparison to an Illustrative Benchmark does not imply that strategies of Enhanced Investments will be constructed in the same way as the Illustrative Benchmark or achieve returns, volatility, or other results similar to those of the Illustrative Benchmark. The S&P 500 is an unmanaged market capitalization-weighted index of 500 common stocks chosen for market size, liquidity, and industry group representation to represent U.S. equity performance.
Performance results were prepared by Enhanced Investments, and have not been compiled, reviewed or audited by an independent accountant. Performance estimates are subject to future adjustment and revision. Investors should be aware that a loss of investment is possible. Account holdings are for illustrative purposes only and are not investment recommendations. Additional information, including (i) the calculation methodology; and (ii) a list showing the contribution of each holding to the portfolio’s performance during the time period will be provided upon request.
All statements made via social media sites sponsored or maintained by Enhanced Investments and its affiliates are for informational purposes only and do not constitute a comprehensive description of Enhanced Investments' investment advisory services.
Certain investments are not suitable for all investors. Before investing, consider your investment objectives and applicable fees. The rate of return on investments can vary widely over time, especially for long term investments. Investment losses are possible, including the potential loss of all amounts invested. Information provided by Enhanced Investments is for informational and general educational purposes only and is not investment or financial advice.
© Enhanced Investments Inc. All rights reserved, 2021