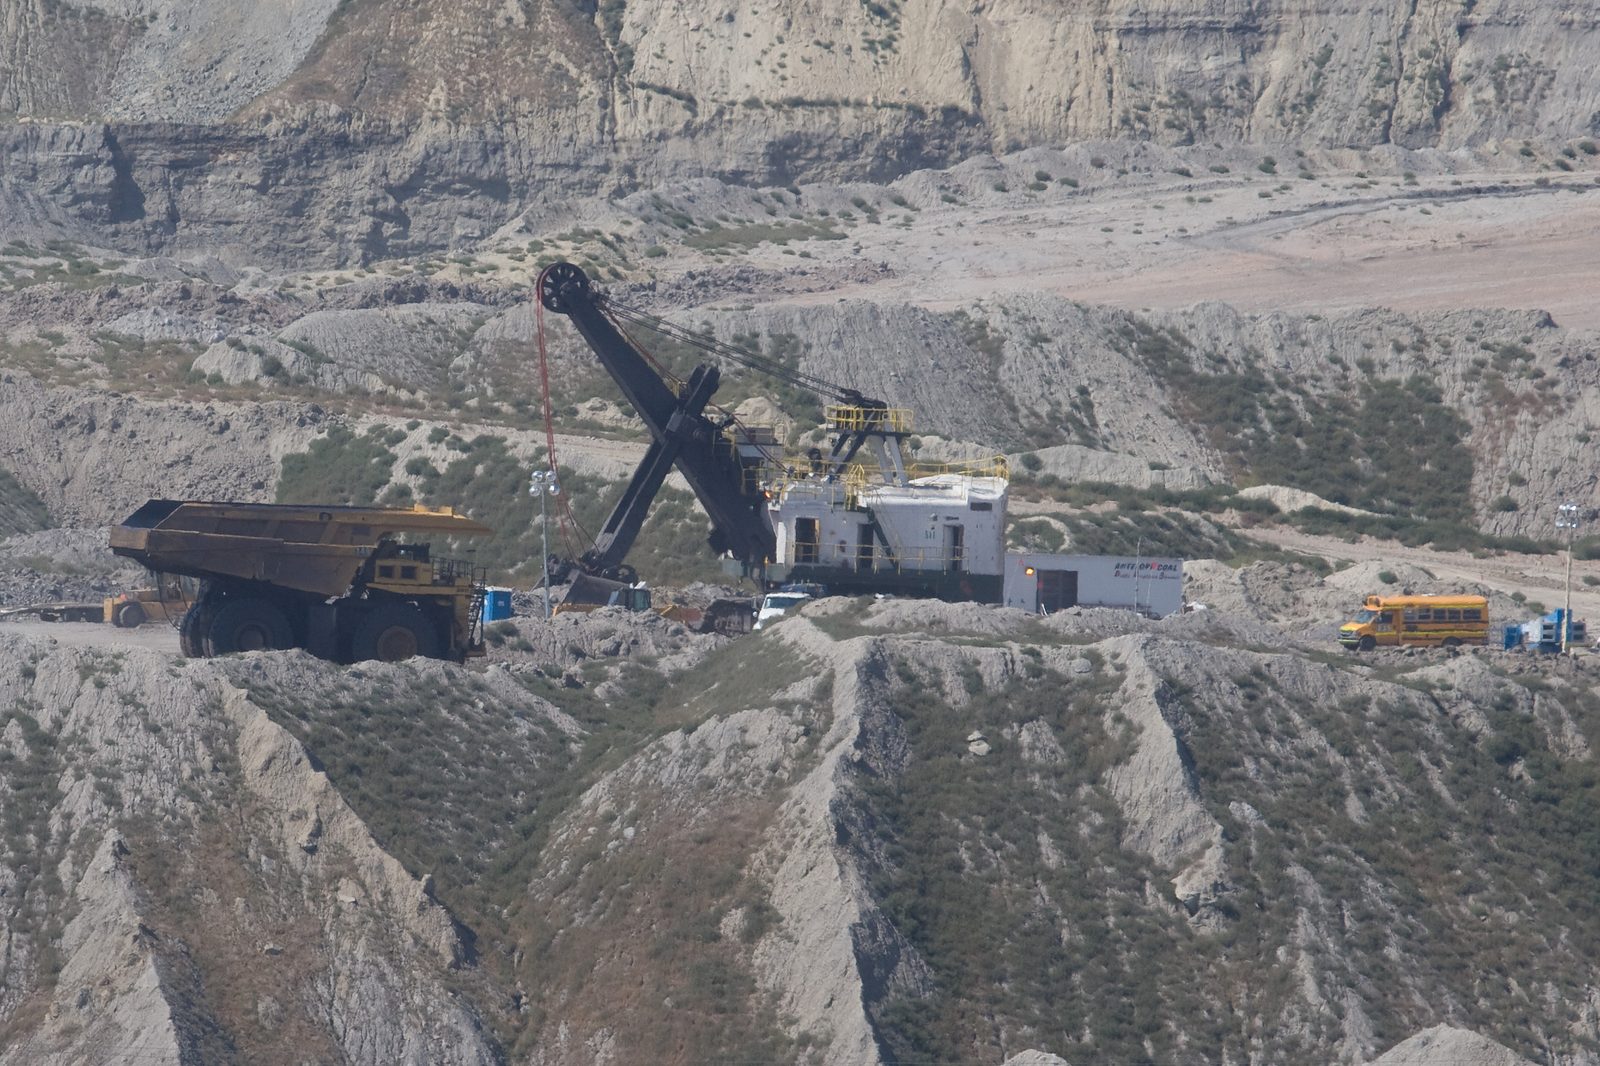
Core Natural Resources, Inc. produces and sells metallurgical coal for steelmaking and thermal coal for power generation, operating mines in Pennsylvania, West Virginia, Colorado, and Wyoming, along with a coal export terminal in Baltimore.
Sector: Coal
Geography: United States
COMM_CNR
Net debt (table and EV/EBITDA): |short-term borrowings| + |long-term borrowings| + |other financial liabilities| when extracted + |non-controlling interest| when extracted − |cash and equivalents|; amounts in millions of the reporting currency.
Shares: yahoo_fundamentals_timeseries/CNR
Monetary columns are in M USD, one decimal; scale (K/M/B/T) keeps values readable. For the period (default) shows P&L and cash flow for that row’s reporting window: quarterly amounts when the feed uses quarter-duration facts (typical US 10-Q revenue and income), quarterly cash flows after stripping YTD where only cumulative tags exist, and an implied Q4 on 31 Dec FY rows (P&L: FY minus Q1–Q3; operating / investing cash flow: FY 12m minus 9M YTD to 30 Sep when sourced from SEC builder evidence) so they match 10-Q scale. Some issuers still use cumulative YTD minus the prior row in the same calendar year. As reported shows values stored on each row (e.g. full-year on FY). Balance sheet is always as reported. Source JSON may use millions etc.; conversion uses amounts_unit per row.
| Date | Period | Status | RevenueM USD | Operating profitM USD | D&AM USD | EBITDAM USD | Net profitM USD | Operating CFM USD | Capex + M&AM USD | AssetsM USD | EquityM USD | ROE (annualized) | Net debtM USD | Source |
|---|---|---|---|---|---|---|---|---|---|---|---|---|---|---|
| 2026-06-30 | Q2 2026 (3M) | OK | 1141.0 y/y 3.5% | 155.8 y/y — | 189.8 y/y 12.2% | 345.6 y/y 130.4% | 126.5 y/y — | 456.7 | -101.9 | 6122.4 y/y -1.4% | 3718.9 y/y -1.3% | 13.7% | -120.1 | Yahoo Finance |
| 2026-03-31 | Q1 2026 (3M) | OK | 1084.3 y/y 6.6% | 32.7 y/y — | 146.3 y/y 20.4% | 179.0 y/y 164.6% | 21.0 y/y — | 119.4 | -73.1 | 6055.9 y/y -3.1% | 3656.9 y/y -6.1% | 2.3% | 42.3 | Link |
| 2025-12-31 | Q4 2025 (3M) | OK | 1042.5 y/y 61.5% | -97.1 y/y -356.2% | 179.2 y/y 207.2% | 82.2 y/y -14.6% | -79.0 y/y -356.3% | 107.3 | -81.3 | 6130.1 y/y 112.9% | 3678.2 y/y 134.5% | -4.1% | 13.0 | Link |
| 2025-09-30 | Q3 2025 (3M) | OK | 1002.5 y/y 81.2% | -11.8 y/y -110.1% | 151.0 y/y 183.2% | 139.2 y/y -18.4% | 31.6 y/y -67.0% | 87.9 | -49.3 | 6195.9 y/y 119.4% | 3778.8 y/y 147.1% | 1.1% | -39.1 | Link |
| 2025-06-30 | Q2 2025 (3M) | OK | 1102.4 y/y 124.6% | -19.3 y/y -126.8% | 169.3 y/y 208.6% | 150.0 y/y 18.4% | -36.6 y/y -163.0% | 220.2 | -89.2 | 6208.7 y/y 129.1% | 3767.6 y/y 161.9% | -3.8% | -33.5 | Link |
| 2025-03-31 | Q1 2025 (3M) | OK | 1017.4 y/y 86.1% | -53.9 y/y -143.5% | 121.6 y/y 113.3% | 67.6 y/y -62.6% | -69.3 y/y -168.0% | -109.6 | -64.8 | 6251.9 y/y 133.3% | 3895.8 y/y 180.5% | -10.1% | -30.7 | Link |
| 2024-12-31 | Q4 2024 (3M) | OK | 645.5 y/y -0.6% | 37.9 y/y -81.5% | 58.4 y/y -0.2% | 96.2 y/y -63.4% | 30.8 y/y -80.4% | 121.3 | -40.8 | 2879.5 y/y 7.6% | 1568.2 y/y 16.7% | 18.5% | -255.4 | Link |
| 2024-09-30 | Q3 2024 (3M) | OK | 553.4 y/y -2.9% | 117.2 y/y -3.7% | 53.3 y/y -9.3% | 170.5 y/y -5.5% | 95.6 y/y -5.1% | 161.3 | -39.4 | 2824.1 y/y 6.2% | 1529.5 y/y 16.9% | 8.6% | -134.1 | Link |
| 2024-06-30 | Q2 2024 (3M) | OK | 490.7 y/y -25.8% | 71.9 y/y -65.0% | 54.8 y/y -15.0% | 126.7 y/y -53.0% | 58.1 y/y -65.4% | 116.3 | -55.4 | 2710.5 y/y 1.2% | 1438.4 y/y 7.7% | 16.4% | -15.3 | Link |
| 2024-03-31 | Q1 2024 (3M) | OK | 546.7 y/y -20.6% | 124.0 y/y -54.4% | 57.0 y/y -4.3% | 181.0 y/y -45.4% | 101.9 y/y -55.8% | 77.5 | -42.4 | 2680.1 y/y -0.6% | 1388.8 y/y 8.4% | 29.8% | 28.3 | Link |
| 2023-12-31 | Q4 2023 (3M) | OK | 649.4 y/y — | 204.3 y/y — | 58.4 y/y — | 262.8 y/y — | 157.1 y/y — | 219.1 | -50.0 | 2675.0 y/y — | 1343.4 y/y — | 49.5% | -78.4 | Link |
| 2023-09-30 | Q3 2023 (3M) | OK | 569.9 y/y — | 121.8 y/y — | 58.8 y/y — | 180.5 y/y — | 100.7 y/y — | 162.7 | -41.7 | 2659.5 y/y — | 1308.8 y/y — | 10.2% | 39.4 | Link |
| 2023-06-30 | Q2 2023 (3M) | OK | 661.0 y/y — | 205.3 y/y — | 64.5 y/y — | 269.8 y/y — | 167.7 y/y — | 227.6 | -42.3 | 2678.3 y/y — | 1335.2 y/y — | 51.3% | 44.5 | Link |
| 2023-03-31 | Q1 2023 (3M) | OK | 688.6 y/y — | 272.0 y/y — | 59.6 y/y — | 331.5 y/y — | 230.4 y/y — | 248.5 | -33.8 | 2695.3 y/y — | 1280.9 y/y — | — | 93.5 | Link |
| Short-term debt (incl. ST leases) | 42 |
| Long-term debt (incl. LT leases) | 405 |
| − Cash & equivalents | 568 |
| Net debt | -120 |
|---|
Net debt / LTM EBITDA: -0.2x
Quarterly values ($ mln)
Year-over-year change
Operating and investing cash flow (OCF + ICF) ($ mln)
Net debt / cash ($ mln)
| year | 2023 | 2024 | 2025 |
|---|---|---|---|
| cash flow / profit | 1.31x | 1.66x | — |
| accruals, % of assets | -7.5% | -6.6% | -7.5% |
Our earnings breakdowns and investment notes on this issuer.
Current 154spot vs LTM +22%
Target market cap from conservative EBITDA and the historical EV/EBITDA
Upside: -1.2% ▼ -3.7 pp 1d
Main driver: Steam coal (Australia) +29% vs LTM; revenue ×1.25 vs costs ×1.04; EBITDA 746→1 336; at 3.4× EV/EBITDA → -1%.
Product prices — moves vs the LTM average
| Commodity | Share | Spot | LTM | 3-yr | vs LTM, $ | 3y vs LTM |
|---|---|---|---|---|---|---|
| Steam coal (Australia) (rev) | +55% | 153.85 | 119.38 | 129.11 | +29% | +8% |
| Coking coal (Australia) (rev) | +45% | 260.50 | 215.32 | 236.42 | +21% | +10% |
How it is calculated — revenue → costs → EBITDA → target market cap
| 1 · Reported baseline (LTM) | |
| LTM revenue | 4 270 |
| LTM EBITDA | 746 |
| LTM cash costs (revenue − EBITDA) | 3 524 |
| 2 · Revenue projection | |
| Revenue multiplier — spot | ×1.253 (+25%) |
| = Spot revenue | 5 352 |
| Revenue multiplier — 3y price | ×1.089 (+9%) |
| = 3-year-price revenue | 4 650 |
| 3 · Costs projection | |
| Cost multiplier — spot | ×1.040 (+4%) |
| = Spot cash costs | 3 665 |
| Cost multiplier — 3y price | ×1.040 (+4%) |
| = 3-year-price cash costs | 3 665 |
| 4 · EBITDA projection (revenue − costs) | |
| = Spot EBITDA | 1 686 |
| = 3-year-price EBITDA | 985 |
| Conservative EBITDA = min(spot, avg) | 1 336 |
| 5 · Valuation → target market cap | |
| Historical EV/projected-EBITDA (75th pct) | 3.4x |
| Target EV = EV/EBITDA × conservative EBITDA | 4 474 |
| Net debt | -166 |
| Target market cap = EV − net debt | 4 640 |
| Current market cap | 4 695 |
Upside = target market cap ÷ current − 1 = -1.2%
Spot model vs reported — what the spot model projected (trailing-LTM base brought to the period × the period's commodity-price move) against the actual report, per reported period (quarter, half-year or full year — per the filer's calendar); amounts in USD mln. green = reported above projection, pink = below.
| Period | Act. rev | Model rev | Δ rev | Act. EBITDA | Model EBITDA | Δ EBITDA |
|---|---|---|---|---|---|---|
| 2024 Q1 | 547 | 555 | -1.5% | 181 | 164 | +10.3% |
| 2024 Q2 | 491 | 557 | -11.9% | 127 | 164 | -22.8% |
| 2024 Q3 | 553 | 494 | +11.9% | 171 | 109 | +57.1% |
| 2024 Q4 | 645 | 508 | +27.2% | 96 | 123 | -22.0% |
| 2025 Q1 | 1 017 | 446 | +127.9% | 68 | 21 | +227.5% |
| 2025 Q2 | 1 102 | 561 | +96.6% | 150 | -15 | — |
| 2025 Q3 | 1 003 | 778 | +28.9% | 139 | 52 | +170.1% |
| 2025 Q4 | 1 042 | 927 | +12.5% | 82 | 77 | +6.3% |
| 2026 Q1 | 1 084 | 1 204 | -9.9% | 179 | 249 | -28.2% |
| 2026 Q2 | 1 141 | 1 273 | -10.4% | 346 | 330 | +4.7% |
Projected EV/EBITDA 3.4x · target 75th pct (3y) 3.4x · LTM avg 8.2x
Group: Coal. Every peer trades on the same market, so no adjustment is needed.
| Company | Market | Cap, $bn | EV/EBITDA |
|---|---|---|---|
| Alliance Resource Partners | global | 3.3 | 5.9x |
| Teck Resources | global | 28.8 | 7.5x |
| NACCO Industries | global | 0.3 | 8.4x |
| Hallador Energy | global | 0.5 | 8.7x |
| Warrior Met Coal | global | 4.4 | 9.7x |
| Peabody Energy | global | 2.7 | 12.3x |
| Alpha Metallurgical Resources | global | 2.0 | 14.7x |
| Group median | 8.7x | ||
| Group average | 9.6x | ||
| This company | global | 4.5 | 6.1x |
Group median 8.7x; this company 6.1x — a 29% discount.
Group average 9.6x; against the average this company is at a 36% discount.
At the adjusted group median the market cap would be +42% versus today.
The gap and the implied upside are measured against the median: one richly priced peer moves an average, not a median. The market adjustment uses our coverage medians (US 20.5x, Russia 3.7x, South Africa 5.0x, Kazakhstan 4.7x, India 18.7x, Indonesia 5.4x); it is about where a name is listed, not what it does. Peer multiples come from the nightly rebuild of 2026-10-23; the company's own is live.
| Date | Per share | Details | Status | Source |
|---|---|---|---|---|
| 2026-08-31 | 0.1 USD | Ex-dividend: 0.1 USD per share | Paid | Yahoo Finance (ex-div) |
| 2026-05-29 | 0.1 USD | Ex-dividend: 0.1 USD per share | Paid | Yahoo Finance (ex-div) |
| 2026-03-02 | 0.1 USD | Ex-dividend: 0.1 USD per share | Paid | Yahoo Finance (ex-div) |
| 2025-11-28 | 0.1 USD | Ex-dividend: 0.1 USD per share | Paid | Yahoo Finance (ex-div) |
| 2025-08-29 | 0.1 USD | Ex-dividend: 0.1 USD per share | Paid | Yahoo Finance (ex-div) |
| 2025-05-30 | 0.1 USD | Ex-dividend: 0.1 USD per share | Paid | Yahoo Finance (ex-div) |
| 2025-03-03 | 0.1 USD | Ex-dividend: 0.1 USD per share | Paid | Yahoo Finance (ex-div) |
| 2024-11-15 | 0.25 USD | Ex-dividend: 0.25 USD per share | Paid | Yahoo Finance (ex-div) |
| 2024-08-30 | 0.25 USD | Ex-dividend: 0.25 USD per share | Paid | Yahoo Finance (ex-div) |
| 2023-05-12 | 1.1 USD | Ex-dividend: 1.1 USD per share | Paid | Yahoo Finance (ex-div) |
| 2023-02-16 | 1.1 USD | Ex-dividend: 1.1 USD per share | Paid | Yahoo Finance (ex-div) |
| 2022-11-10 | 1.05 USD | Ex-dividend: 1.05 USD per share | Paid | Yahoo Finance (ex-div) |
| 2022-08-15 | 1 USD | Ex-dividend: 1 USD per share | Paid | Yahoo Finance (ex-div) |
KASE: status follows wording in the news headline (paid vs intends to pay). Yahoo: amounts are cash dividends per share on ex-dividend dates (UTC calendar date). stockscope.uz (UZ): amounts are per share in UZS by publication date (not necessarily ex-div).
Reporting forms detected in loaded periods: ✓ ✓ ✓ (Balance sheet / Profit or loss (P&L) / Cash flows)
Financial results, valuation multiples (P/E, P/B, EV/EBITDA), profitability and dividend yield of Core Natural Resources (CNR) — from primary filings.
See also: The Cheapest Coal Stocks (2026): Out of Favour, Cash-Rich, High-Yield · The Cheapest Stocks in the World (2026): What Value Investing Says About Buying Cheap · global valuation map