This season’s defining divergence is clear: precious metals and their miners are on a tear, while energy—especially oil & gas—is stuck in the mud. Silver mining leads all industries with a median revenue surge of 95.5%, and gold mining follows at 71.1%, yet the oil & gas sector collectively shrinks by 6.9%. The story is not about absolute size but about who captures the commodity tailwind—and who gets left behind.
Revenue growth by industry (median YoY)
median revenue YoY, %
Silver and gold miners minted fortunes as metals prices soared
Endeavour Silver stands out with a staggering 230.2% revenue jump, while First Majestic Silver grew 95.5% and Fortuna Mining 75.6%. In gold, Coeur Mining surged 137.8% and B2Gold 117.7%, with Barrick Mining up 66.7% and Agnico Eagle 66.1%. These aren’t just revenue stories—profitability exploded: Coeur’s EBITDA soared 326.6%, and First Majestic’s EBITDA rose 190.5%. The precious-metals royalty model also shined: Royal Gold’s revenue climbed 142.5%, and Wheaton Precious Metals grew 91.8%, proving that even indirect exposure to the rally paid off handsomely.
Energy and coal laggards reveal a sector in retreat
The energy patch tells a different story. Oil & gas revenue fell 6.9% as a group, with Amplify Energy dropping 48.0% and VAALCO Energy down 43.3%. Even giants like ConocoPhillips and Exxon Mobil saw revenue slip 4.6% and 2.4% respectively, while Chevron managed only a 2.1% gain. Coal barely budged at 0.8% median growth, but Alpha Metallurgical Resources slumped 10.7% and Hallador Energy fell 13.5%. The worst performer by far is polysilicon: Daqo New Energy crashed 78.5%, with EBITDA turning deeply negative, a stark warning for the solar supply chain.
Natural gas staged a surprise revival from a deep trough
The biggest plot twist comes from natural gas. After a brutal prior period where revenue fell 51.4% at Expand Energy and 46.5% at Gulfport Energy, both accelerated sharply: Expand Energy’s revenue surged 100.2% from that 51.4% decline, and Gulfport jumped 122.1% from a 46.5% drop. Equinor, classified under natural gas, grew 37.4% after a prior decline. This is a dramatic turnaround—gas producers went from deep contraction to explosive growth, catching many investors off guard.
Value bargains hide in plain sight amid the precious-metals frenzy
Despite the rally, some gold miners trade at compelling multiples. Gold Fields offers a P/E of just 6.0x and EV/EBITDA of 5.2x, while Caledonia Mining trades at 5.9x earnings and 2.4x EV/EBITDA—both growing revenue over 18% and 71% respectively. Even Barrick Mining, with 66.7% revenue growth, trades at only 10.2x earnings and 5.1x EV/EBITDA. At the other extreme, Texas Pacific Land Corporation commands a P/E of 54.3x and EV/EBITDA of 39.3x, despite modest 20.8% revenue growth—a clear case of priced-for-perfection valuation.
Income seekers find refuge in shipping and energy despite the gloom
For yield-focused investors, the standout is Euroseas with a P/E of 4.0x and EV/EBITDA of 3.4x, though revenue dipped 0.9%. Danaos Corporation offers a P/E of 5.0x and EV/EBITDA of 4.1x, with steady revenue growth of 0.2%. Among energy names, Amplify Energy trades at a P/E of just 4.6x and EV/EBITDA of 1.4x, but its 48.0% revenue decline is a red flag. The highest yields likely come from these deep-value plays, but investors must weigh the income against the underlying business deterioration.
Looking at the longer horizon, Pan American Silver boasts a 3-year revenue CAGR of 34.3%, Alamos Gold 30.1%, and AngloGold Ashanti 30.0%—all demonstrating sustained compounding. Meanwhile, BHP Group’s 3-year CAGR is -7.7%, and ConocoPhillips’ -9.1%, underscoring the structural shift toward precious metals. The next catalyst to watch is whether gold and silver prices can hold these levels; if they do, the valuation gap between cheap gold miners and expensive royalty companies may narrow. For now, the precious-metals trade remains the dominant narrative.
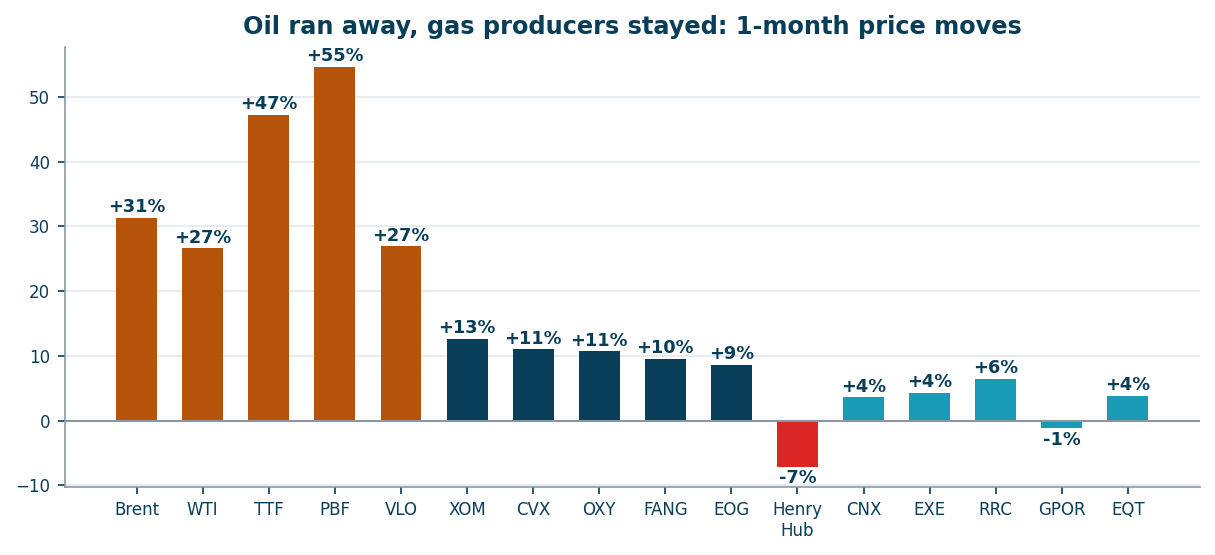
While oil spiked 31% in a month on the Hormuz crisis (Brent ~$101) and European gas jumped to ~EUR 60/MWh, US natural gas went the other way: Henry Hub - the benchmark price at the US pipeline hub in Louisiana - sits near $2.9-3.2/MMBtu, and the producers' shares have gone nowhere. This review checks whether that gap is an opportunity: the macro setup, our screening model, and a hard look at four names - Expand Energy, Gulfport, Range Resources and CNX - through primary filings: hedge books, breakevens, debt and buybacks.
Oil and refiners ran away in a month; gas producers stayed flat
Why not the oil producers: the move is largely priced in
The obvious question is why not simply buy oil names - Exxon, EOG, Occidental, Diamondback. Because their repricing has largely happened: the stocks followed crude up, and on a normalized oil price they are now expensive. Our model values producers on the lower of spot and the 3-year average - for oil that means ~$75-80, not $101 - and on that basis the US oil E&Ps screen deeply negative: OXY -16%, EOG and Chevron around -42%, Exxon -44%, ConocoPhillips -64%, Diamondback -82%. Buying them today means paying for spike-level oil as if it were permanent, while the spike itself is geopolitical and reverses on any Hormuz de-escalation. If your scenario is a prolonged blockade and $100+ oil for quarters, oil producers will deliver earnings upgrades - but that is a bet on geopolitics, not on a mispricing. The gas leg offers the opposite asymmetry: spot near the floor and structural demand still ahead.
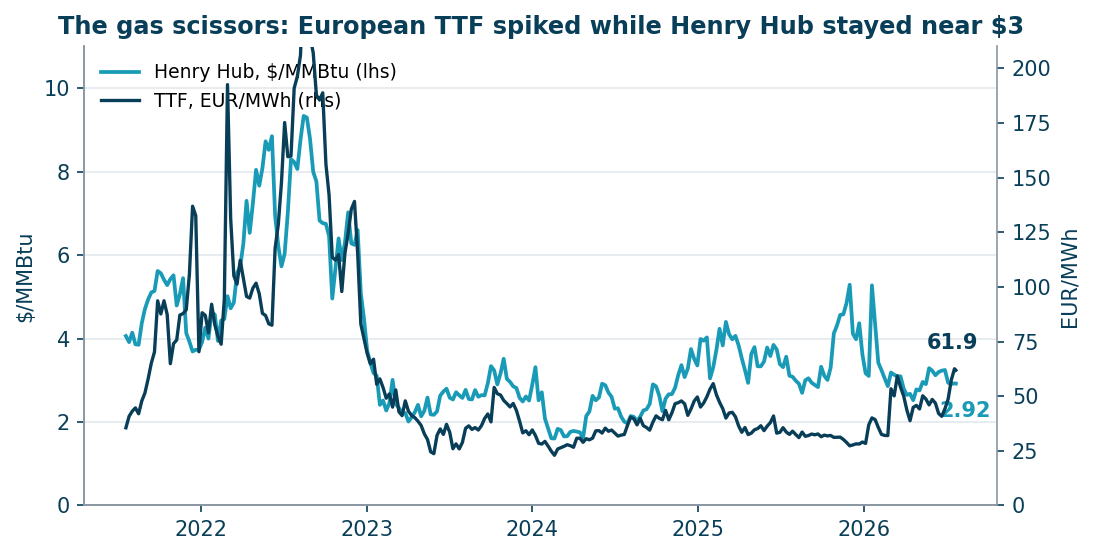
Two prices for the same molecule: the widest arbitrage in energy
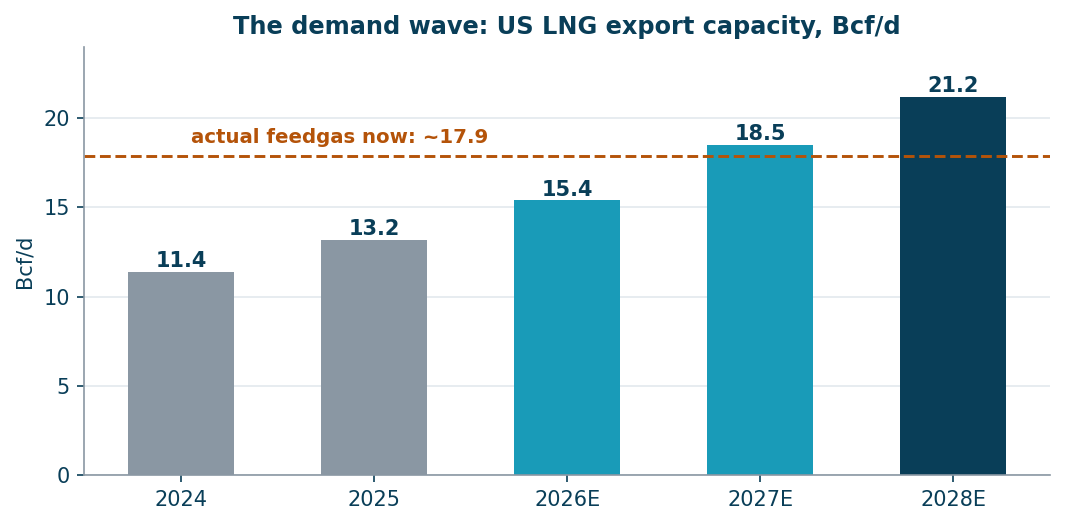
The same unit of energy costs ~$2.9-3.2 in the US and ~$20 equivalent in Europe (TTF is the European gas benchmark). The gross spread of ~$17/MMBtu dwarfs the full cost of liquefying and shipping US gas (~$4-5), so every LNG plant on the Gulf Coast runs at maximum: March 2026 set an export record, and terminals consume ~17.9 billion cubic feet of gas a day (Bcf/d) - about 15% of all US production. The constraint is liquefaction capacity, not economics - and that capacity is in the middle of its biggest expansion wave ever.
Five years of Henry Hub vs TTF: Europe pays multiples of the US price
Why Henry Hub is cheap - the honest part
US gas is cheap for real reasons. Production is at an all-time record (~111 Bcf/d of dry gas in June, +3.4% y/y). Storage is 6% above the 5-year average. And oil at $100 makes it worse: Permian oil wells produce associated gas as a by-product regardless of gas prices (~28 Bcf/d and growing). The most sobering fact: back in January the US Energy Information Administration forecast $4.60 gas for 2027; by July it had cut that forecast to $3.49 - supply keeps absorbing the demand growth. Anyone buying gas producers must respect this: the bear case is not hypothetical, it is the current trajectory.
What changes in 2026-2028: the LNG wave plus data centers
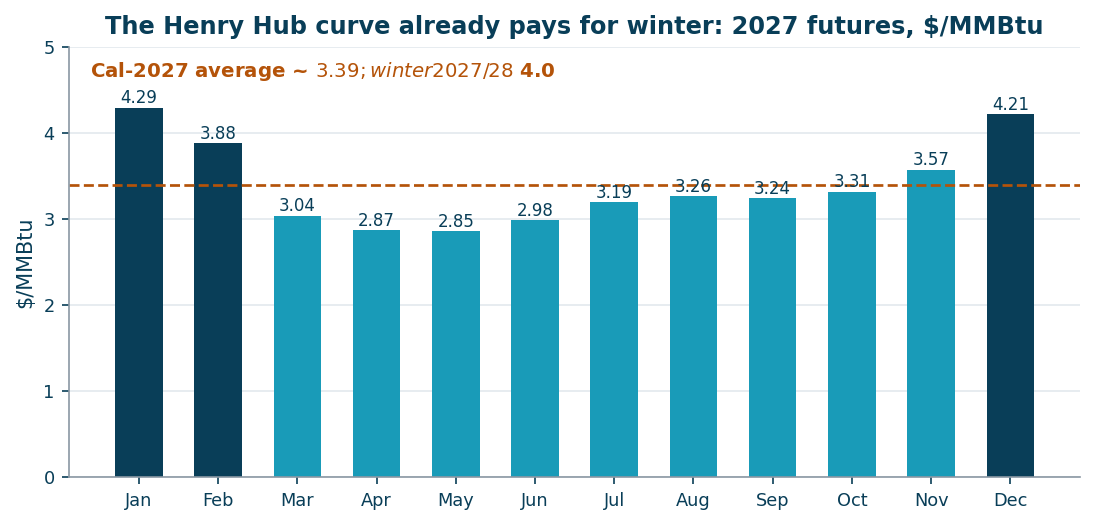
US LNG export capacity grows from 15.4 Bcf/d to ~21.2 Bcf/d by 2028 - a wave of ~6 Bcf/d of new structural demand. It is not a forecast, it is concrete: Plaquemines runs at full rates, Corpus Christi Stage 3 is commissioning, Golden Pass (delayed two years) shipped its first cargo in April 2026 and adds two more trains through 2027, Port Arthur and Rio Grande follow in 2027. On top of that, AI data centers: independent estimates (S&P Global, East Daley) see +3-6 Bcf/d of gas demand for power by 2030, and the deals are already signed - the 4.5 GW Homer City campus in Pennsylvania, the largest gas-fired plant in the US, is contracted to burn Appalachian gas from 2027. The futures curve already prices the shift partially: calendar-2027 averages $3.39 with winter months above $4.20.
US LNG export capacity: +6 Bcf/d of structural demand by 2028 (EIA)Henry Hub futures for 2027: winter above $4.20, summer near $2.90
Our screen - and why hedges pick your scenario
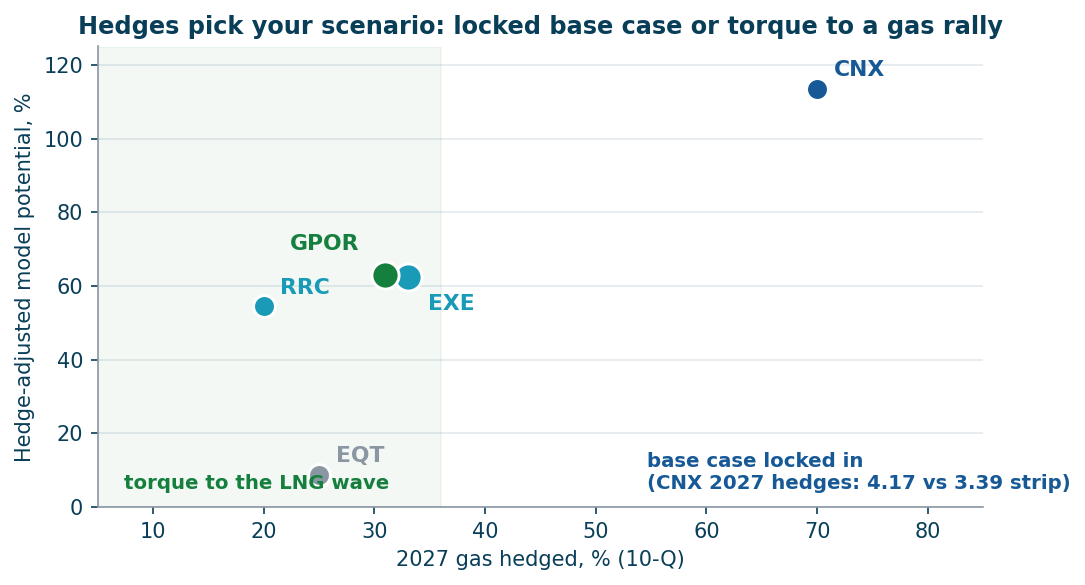
Our spot-potential model (recomputed nightly; conservative price basis = the lower of spot and the 3-year average, EV/EBITDA capped) puts the gas producers at the top of coverage - but the raw screen passes through two mandatory filters before it becomes a recommendation. Filter one, hedges: a hedge is a contract fixing the sale price of future production, so the model values each disclosed hedge book (10-Q volumes and strikes) against its scenario price and books the difference as an adjustment to net debt - a quasi-debt below the scenario price, an asset above it. Filter two, reserve life: for a producer the upside only exists for as long as there is something to produce, so where proved reserves divided by annual production (R/P) come in under 15 years, the model cuts the potential by a finite-life annuity factor. Both filters applied: CNX +114% (16 years of reserves, 2027 hedges at $4.17 - an asset against a ~$3 base), Range +54% (22 years), Gulfport +18% (11 years), Expand +10% (9.9 years), EQT +10% (11 years). The reserve-life filter is harsh - it cut Expand from +62% and Gulfport from +63% - and it flips the ranking of this review.
Two filters on one chart: 2027 hedges (x) vs adjusted potential (y); labels show proved reserve life
A note on freshness: the figures in this review are locked as of July 23-24, 2026. The model itself recomputes every night with live prices - gas moved 8% within days of publication - so treat the numbers here as a dated snapshot and check the live potentials on the Frontier company cards.
Pick #1 - CNX: the model leader through both filters
CNX survives both filters better than anyone: 16 years of proved reserves and a hedge book that at today's soft curve is an asset - 2027 NYMEX swaps at $4.17 versus a $3.39 strip. The base case is effectively locked: ~$525mn of guided FCF regardless of gas, all of it going into buybacks that have retired 37% of the share count since 2020. The catch has a clock attached: 70-81% of production is sold through 2027, so CNX participates in the LNG wave only as the hedges roll off - which happens from 2028, right as the export capacity ramp completes. Risks to respect: leverage of 1.8x versus 0.5-0.9x at peers, ~12mn shares of convertible dilution in 2026, ~$70mn of guided FCF riding on 45Z tax credits awaiting a final Treasury rule, and a Hold-leaning Street consensus (~$39 average target) that sees the same hedges and prefers to wait.
Pick #2 - Range Resources: the torque with the longest inventory
Range is the torque leg that survives the reserve-life filter: 22 years of proved reserves (and 30+ years of drilling inventory by management count), the lowest breakeven of the group (~$2.00), only ~20% of 2027 gas hedged - the most open book among the five - plus 30% liquids sold at a record export premium (+$3.49/bbl over Mont Belvieu in Q2). Production grows from 2.30 to ~2.6 Bcfe/d by 2027, and a quarter of its gas contracts with LNG exporters reprices into the 2026-27 wave. The price of all this quality: 6.2x EV/EBITDA - the most expensive multiple in the group after EQT - and a Hold consensus. You are not buying a discount, you are buying the longest-duration exposure to the thesis, with a +54% adjusted potential.
Downgraded on reserve life: Expand and Gulfport
Both remain excellent operating machines - Expand with 0.5x leverage, a 12.5% FCF yield and a Buy consensus (+34-43% targets); Gulfport with 0.9x leverage, a 12.7% FCF yield and ~10%/yr share-count shrink. But their proved reserve lives are short: 9.9 years at Expand, 11.2 at Gulfport - and the model's discipline cuts their potentials to +10% and +18%. One honest caveat cuts the other way: proved R/P understates shale inventory by construction (undrilled locations are not booked as proved - Gulfport's management counts ~15 years of inventory, Expand touts the deepest low-breakeven Haynesville inventory plus the Western Haynesville appraisal). Investors willing to credit unbooked inventory can hold them at smaller size; the Street clearly does. Our model does not credit what is not booked - the same discipline that kept Kumba out of our 13 ideas.
The bench: EQT
EQT (we hold it) is the quality consensus pick with the data-center contracts (1.5 Bcf/d signed) - and it fails both value tests at once: the most expensive multiple (5.8x EV/EBITDA) and an 11-year reserve life that caps the adjusted potential at ~+10%. We are not adding; the position stays as a quality holding, not a potential play.
The Q2 prints landing this week: weak headlines, watch something else
Should you expect strong Q2 reports? Headline-wise, no - and two of the five have already proven it. EQT and Range both reported on July 21. EQT was operationally strong: volumes above the top of guidance, full-year production guide raised by 90 Bcfe with capex cut by $25mn, a record 29,000-foot lateral. Range printed record production and an EPS beat - but realized prices fell from $4.84/mcfe in the spike-quarter Q1 to $3.53, net income declined y/y, and the stock fell on the report. That is the template for Expand (July 28) and CNX (July 30): solid operations, sequentially weaker prices. For the thesis this is fine - expectations are low and the stocks have not moved, so a soft print is already in the price (Range just demonstrated it). What actually matters in these reports: whether 2027 hedge books get extended (that would cut the torque this idea is built on), Expand's buyback ramp now that its debt target is done, production guides into the LNG wave, and CNX's clarity on its 45Z tax credits. One honest irony to note: EQT's guidance raise is itself part of the bear case - operational outperformance is exactly how record supply keeps outrunning demand.
Base case (the current curve, ~$3.4-3.5 through 2027): all four generate high single-digit to low double-digit FCF yields; buybacks convert flat gas into ~10-15%/yr per-share compounding. Bull case (the LNG wave outruns supply, $4.25-4.50 average in 2027): EBITDA of the low-hedged names grows 30-40%+ at multiples of 3-3.5x - this is where Range's +54% adjusted potential gets realized, and CNX's locked economics roll into the same prices from 2028; Expand alone guides to ~$3.85bn annual FCF at $4.00 gas (17% yield). Bear case (supply keeps winning, $2.70-3.00): breakevens of $2.00-2.60 keep everyone FCF-positive, CNX outearns peers on its $4.17 hedges, GPOR/RRC keep shrinking share counts at depressed prices. The main risks: Permian associated gas at $100 oil (price-insensitive supply), LNG project slippage (Golden Pass was two years late), a warm winter on top of +6% storage, and the sector's own capital discipline breaking if prices do rally.
How to buy
All five are liquid US listings (NYSE/NASDAQ), available at any international broker including Interactive Brokers at standard commissions; options are liquid for EXE and EQT. No withholding complexities beyond the standard 15-30% US dividend tax - and for GPOR and CNX there is no dividend at all, returns come via buybacks.
Prepared by Enhanced Investments from company filings (10-Q/10-K, Q1-Q2 2026 releases: Expand Energy, Gulfport, Range Resources, CNX, EQT), EIA data (STEO July 2026, storage and production reports), CME futures and exchange data; July 2026. Not individual investment advice.
Research note, data as of 24-25 June 2026. Not individual investment advice. US refining is running at abnormally high margins, and unlike past spikes this one is largely structural. We cover how much refiners earn now, how long it lasts, how much free cash flow PBF can generate, and a backtest of buying cheap on crack-adjusted EV/EBITDA. The lead name is PBF Energy (PBF) — the most concentrated way to play the theme.
The crack spread is ~$46/bbl now — double the norm, but not at its peak
The 3-2-1 crack spread — the notional margin of turning three barrels of crude into two of gasoline and one of diesel — sits around $46/bbl, versus a historical norm of ~$10-12. The headline USGC 3-2-1 averaged ~$42 in April 2026 (+95% YoY) and spiked above $52 in spring on Hormuz tension. In 2024-2025 the crack sagged to ~$20-24, which is why refiner profits collapsed.
Crack spread: where we are in the cycle
$/bbl (3-2-1)
The high crack has lasted only ~4 months of a typical 3-9
The acute phase of the rally began in late February 2026 (Iran/Hormuz), so the high crack has lasted only about 4 months. Historically, elevated margins after a geopolitical shock persist 3-9 months — so the cycle is only partly through, and permanent capacity closures can extend it. Key nuance: PBF has barely monetized this crack yet, because its best plant (Martinez) was down — the bulk of the earnings is still ahead.
Strikes on Russian refineries and Hormuz add fuel — but it's reversible
Ukrainian strikes have knocked an estimated 20%+ of Russia's refining capacity offline; Russia began importing gasoline by sea and curbed product exports, and as a major diesel exporter its lost flows push global cracks up. The Hormuz/Iran conflict added a risk premium and Middle East outages. Both factors are reversible — cracks have eased before when Russian supply recovered — which argues the moment is cyclical, not a permanent new normal.
~900 kb/d shut for good — that lengthens the cycle
Since 2023 the US has permanently retired about 900 kb/d of refining capacity. Shut plants don't come back, which structurally tightens supply regardless of demand. Base case: elevated margins persist another 12-18 months, compressing 20-30% from peaks; bull case 24+ months; bear case a return to 2023 levels within 6-12 months.
US capacity permanently closed since 2023
kb/d
PBF is a pure-play refiner: maximum sensitivity to the crack
PBF is a pure-play refiner — no midstream, no chemicals to smooth the cycle. Six plants, ~1.0 million b/d, weighted Nelson complexity 12.7. That makes it the most crack-geared large name — amplitude in both directions.
PBF refineries
Region
Plants
Throughput (kb/d)
East Coast / Восток
Delaware City + Paulsboro
280-300
Mid-continent
Toledo
135-145
Gulf Coast / Залив
Chalmette
175-185
West Coast / Запад
Martinez + Torrance
250-270
Total / Итого
6 plants / 6 заводов
850-910
PBF's profit swings wildly: $4.3bn at the peak, ~zero at the trough
A pure-play cuts both ways: adjusted EBITDA was $4.3bn in 2022, collapsed to $0.09bn in 2024 — a 48x swing in two years — and was near zero in 2025 (Martinez outage). At full utilization and current spreads the potential is $2.5-3.5bn a year.
PBF adjusted EBITDA by year
$bn
PBF's margin tracks the crack — depressed now by Martinez downtime
PBF's realized refining margin moved from +$11.7/bbl (Q1'24) to -$3.9 (Q4'24) to +$11.2 (Q4'25), then dipped to +$6.0 in Q1'26 — low despite a high crack because Martinez was down. As Martinez returns to full load in Q2 2026, the margin should re-converge toward the crack environment.
PBF realized refining margin by quarter
$/bbl
+$1/bbl of crack ~ +7% of market cap — that's the core leverage
At ~900 kb/d PBF processes ~330 million barrels a year, so every +$1/bbl of durable margin is ~$0.33bn of pre-tax EBITDA, ~$2.8/share, ~7% of market cap. Per $1bn of market cap PBF carries ~188 kb/d of capacity vs ~41 for VLO/MPC — 4.6x more barrels per dollar (but also more debt).
Leverage to the crack: capacity per $1bn market cap
kb/d per $1bn
At current cracks PBF can earn ~20-40% of its market cap in FCF in a year
Assuming 2026 capex ~$0.9bn, net interest ~$0.19bn and 21% tax: mid-cycle (EBITDA ~$1.8bn) yields ~11% FCF on the $4.8bn market cap; at current high cracks with Martinez running (~$2.5bn) ~22%; at a 2022-style peak (~$3.5bn) ~39%; at the trough FCF is negative. So a sustained high crack can return a fifth to two-fifths of the market cap in free cash flow in a single year.
Estimated PBF FCF yield by state of the cycle
% of market cap
Debt is manageable, and Martinez restarts into the high-spread window
Net debt is ~$2.3bn (net debt/cap ~36%, debt/EBITDA ~1.9x), with no maturity wall — 2026 refinancing pushed the 2028 notes out to 2034. Dividend ~2.7% plus a buyback; priority is deleveraging. Martinez (fire 1 Feb 2025, ~$0.9bn insurance recoveries) completes its restart in Q2 2026 — full load returns into the high-spread window.
Backtest: cheap on EV/(crack-adjusted EBITDA) = historically a good entry
We tested buying when a refiner is cheap on EV/EBITDA computed at the current crack (not reported earnings) across VLO/PBF/MPC/PSX/DINO, 2020-2026, monthly, with point-in-time ranking. Cheap names returned +47% on average over the next 12 months (median +45%) versus just +5% for expensive ones.
12-month forward return by cheapness on crack EV/EBITDA
% avg forward return
Statistical weight comes from our Global Commodities strategy, whose refiner signal is built on the same crack model (crack to EBITDA to EV/EBITDA to upside): 2016-2026 it returned ~28% CAGR vs ~14% for the S&P, with a ~+11%/yr cross-sectional ranking edge over an equal-weight basket of the same names.
For cyclicals, multiples on reported earnings mislead — use anchors
For a cyclical, any multiple on reported/peak earnings misleads (P/E and EV/EBITDA alike) — at the margin peak, earnings are huge and the multiple looks low right at the top. Better anchors: EV/EBITDA recomputed at the current crack (as in the backtest), EV/mid-cycle EBITDA, and price-to-book. PBF's P/B range is 0.25x (trough), 1.12x median, 2.55x (peak); now ~0.90x, around or below book (~$44/share). Supercycle history: 2004-2005 saw Valero +239% and HF Sinclair +265%; 2022 saw HF Sinclair +106%, Valero +58%, Marathon +53%.
PBF price / book value (P/B)
x
Risk/reward skews up: base +45%, bull +112%, bear -28%
Combining FCF-driven equity build with multiple normalization toward mid-cycle, rough 12-24 month price scenarios for PBF (current ~$40): base (crack ~$30-35) ~$58 (+45%); bull (crack ~$40+, holds 24 months) ~$85 (+112%); bear (crack to $20) ~$29 (-28%). The risk/reward skews up, but this is a high-volatility cyclical bet — both upside and downside are large. Not a forecast.
The spot-potential model re-prices each company's revenue at current commodity spot prices versus the LTM-realised average, and reads the implied EBITDA uplift. It is computed for 18 of the 24 commodity names.
Spot-EBITDA potential (selected)
% EBITDA uplift
Operating leverage drives the ranking
The largest potentials belong not to the companies whose commodity rose most, but to those with the thinnest EBITDA margins. Albemarle, Alpha Met, Peabody and Core Natural all earn just 5-11% margins today — so a revenue increment from higher prices drops almost entirely to EBITDA and multiplies a small base. Albemarle is the extreme: lithium prices collapsed, its EBITDA is near-breakeven, and lithium spot sits ~58% above the LTM average — recovering that implies a several-fold EBITDA jump.
The dependable reads
The high-margin gold and copper majors — Newmont, Barrick, AngloGold, Freeport, Southern Copper — show a steadier +20-37%. They already earn 35-65% margins, so a price move lifts EBITDA proportionally rather than explosively. These are the robust signals; the triple-digit coal and lithium figures correctly flag enormous gearing to a price recovery, but are fragile on a near-breakeven base.
P/E and EV/EBITDA use LTM from up to four quarter rows when they look comparable (incl. Q2/Q4); if the feed is only Q1 and Q3, we use latest FY profit/EBITDA instead of summing them. P/B is market cap ÷ latest FY equity. Hover multiples for the exact formula. Financial rows: year(period_end) ≥ max(2023, current calendar year − 2) (hide older).