Frontierby eninvs

Language: EN · RU

Uzbekistan Stocks — Valuations, P/E & Dividends

Related guides: Gold Mining Stocks · The Cheapest Metals & Mining Stocks (2026)

GDP growth 2026 (proj.) 6.5%Inflation YoY (proj.) 7.0%FX vs USD (3y avg p.a.) -1.1%Macro: IMF World Economic Outlook, April 2026 (Annex tables 1.1.2–1.1.4)

Sectors: Banks (3)

Rows are ordered partly by extraction health (share of stable periods). Hover a row for OK / partial / error counts.

CompanyCountrySectorValue / upsideDiv. %FCF Yield LTMΔ revenue (NII for banks)Δ EBITDA (assets for financials)EV/EBITDA LTMP/E LTMP/B FYROE (ann.)
Universal bank (ATB)
UZ_UNIVERSAL
UZBanks+24%4.4%34.2%40.8%6.4x2.1x19.9%
Trustbank (PJSB)
UZ_TRUST
UZBanks+8%6.1%26.8%15.0%12.8x4.1x55.0%

Work in progress — needs attention

Issuers below have weak extraction, thin market data, missing valuation inputs, or extreme headline YoY/ROE. Hover the row for the checklist.

CompanyCountrySectorValue / upsideDiv. %FCF Yield LTMΔ revenue (NII for banks)Δ EBITDA (assets for financials)EV/EBITDA LTMP/E LTMP/B FYROE (ann.)
Hamkorbank (JSCB)
UZ_HAMKOR
UZBanks+22%0.9%27.5%1.5x32.5%
UzNIF — National Investment Fund (JSC)
UZ_UZNIF
UZFund-12%1.1x
UZEX — Uzbek Commodity Exchange (JSC)
UZ_UZEX
UZNon-financial15.8%

Earnings analysis

Short take-aways from recent corporate results and commodity trends.

Three stocks, three speeds: Trust races ahead while Universal and Hamkor downshift

This quarter's story is not about who grew, but who kept the pace. Trust accelerated revenue growth to +32.2% year over year, while Universal posted a solid +30.9% and Hamkor a respectable +19.2%. The real divergence lies in profit: Trust's net income rose just +15.9%, Universal's a mere +6.6%, and Hamkor's +18.9%. The gap between top-line and bottom-line growth is widening, and that's where the winners and losers are separated.

Revenue growth, biggest movers (YoY)

TRUST (Q1)32UNIVERSAL (Q1)31HAMKOR (Q1)19032
revenue YoY, %

Trust is the growth engine, but profitability is stalling

Trust delivered the strongest revenue growth of the trio, accelerating from +20.8% in the prior period to +32.2% year over year. That's a clear acceleration. However, net profit growth of +15.9% pales in comparison, and the prior period saw a net profit decline of -0.4%. So while the top line is roaring, the bottom line is only sputtering back to life. This suggests margin pressure or rising costs that are eating into gains.

Universal is the steady performer, with revenue growth of +30.9% year over year, almost identical to the prior period's +30.5%. But net profit growth collapsed from +64.2% to just +6.6%. That's a dramatic deceleration. The company is maintaining top-line momentum but failing to convert it into profit. Investors should question whether this is a temporary blip or a structural issue.

Hamkor is the laggard, but its profit growth is quietly resilient

Hamkor's revenue growth of +19.2% is the weakest of the three, and it decelerated from +38.4% in the prior period. That's a significant slowdown. Yet net profit growth held steady at +18.9%, almost unchanged from the prior period's +18.3%. This consistency is a positive signal: Hamkor may be sacrificing revenue growth for profitability, or it might be facing tougher market conditions but managing costs well.

The plot twist: Universal's profit engine sputters while Trust's accelerates

The most striking divergence is in net profit growth. Trust's net profit growth accelerated from -0.4% to +15.9%, a sharp turnaround. Meanwhile, Universal's net profit growth slowed dramatically from +64.2% to +6.6%. This is a classic case of one company fixing its profitability while another loses its edge. Investors who chased Universal's prior profit surge may be disappointed, while Trust's improvement could be the start of a positive trend.

Valuation: Hamkor is the deep-value play, Trust is priced for growth, Universal is the middle child

With a P/E of just 4.9x, Hamkor looks dirt cheap for a company growing revenue at +19.2% and net profit at +18.9%. That's a rare combination of growth and value. Trust, growing revenue at +32.2%, trades at 12.8x earnings — a premium that might be justified if its profit growth continues to accelerate. Universal, with revenue growth of +30.9% but net profit growth of only +6.6%, sits at 6.4x earnings. That's cheaper than Trust but more expensive than Hamkor. Given its profit deceleration, Universal may be a value trap unless margins recover.

Income: no dividends in sight, but capital gains may be the reward

None of the three companies reported dividend yields in the data. For income-focused investors, this quarter offers no yield. However, the low P/E of Hamkor and the growth trajectory of Trust suggest that total return potential lies in price appreciation rather than dividends. Universal's yield is also absent, and with its profit slowdown, it may not be able to initiate a dividend soon.

The long view: Hamkor's consistency and Trust's acceleration are the ones to watch

While 3-year revenue CAGRs are not available, the quarterly trends tell a story. Hamkor has delivered steady profit growth around +18% for two consecutive periods, suggesting a reliable business model. Trust is the turnaround story, with revenue and profit both accelerating. Universal is the question mark: its revenue growth is robust, but the sharp profit deceleration is a warning sign. Next quarter, watch whether Universal can reignite profit growth and whether Trust can sustain its acceleration. Hamkor, at 4.9x earnings, remains the value pick if it can keep its profit growth above 15%.

Players: growth & yield (no absolute levels)

CompanyRevenue YoYNet profit YoYP/E
HAMKOR (Q1)+19.2%+18.9%4.9x
TRUST (Q1)+32.2%+15.9%12.8x
UNIVERSAL (Q1)+30.9%+6.6%6.4x

UZ_TRUST: profit grows slower than revenue, and that's no accident

TRUST →
UZ_TRUST

15 апреля 2026 года UZ_TRUST раскрыла результаты за первый квартал 2026 года: выручка выросла на 32,2% год к году, до 642 570 млн сумов, чистая прибыль – на 15,9%, до 232 720 млн сумов. Рентабельность по чистой прибыли снизилась с 41,3% до 36,2%, что отражает опережающий рост затрат. При текущей цене акция выглядит скорее привлекательной: P/E LTM составляет 12,8, дивидендная доходность – 6,1%, а модель портала оценивает потенциал роста в +8%.

Key takeaways

— Revenue accelerated to +32.2% in Q1 2026, but margin compressed by 5.1 pp

— Net profit grew 15.9% – half the pace of revenue

— Dividend yield of 6.1% against the key rate is the main argument for holders

— P/E LTM of 12.8 – below its own three-year history, portal model upside +8%

— Margin of 36.2% is still high, but the trend needs watching

Attractiveness

Key figures, UZS bn

MetricQ1 2025Q1 2026Change
Revenue486643+32.2%
Net profit201233+15.9%
Net margin41.3%36.2%-5.1 pp

Revenue accelerated to +32.2% in Q1 2026, but margin compressed by 5.1 pp

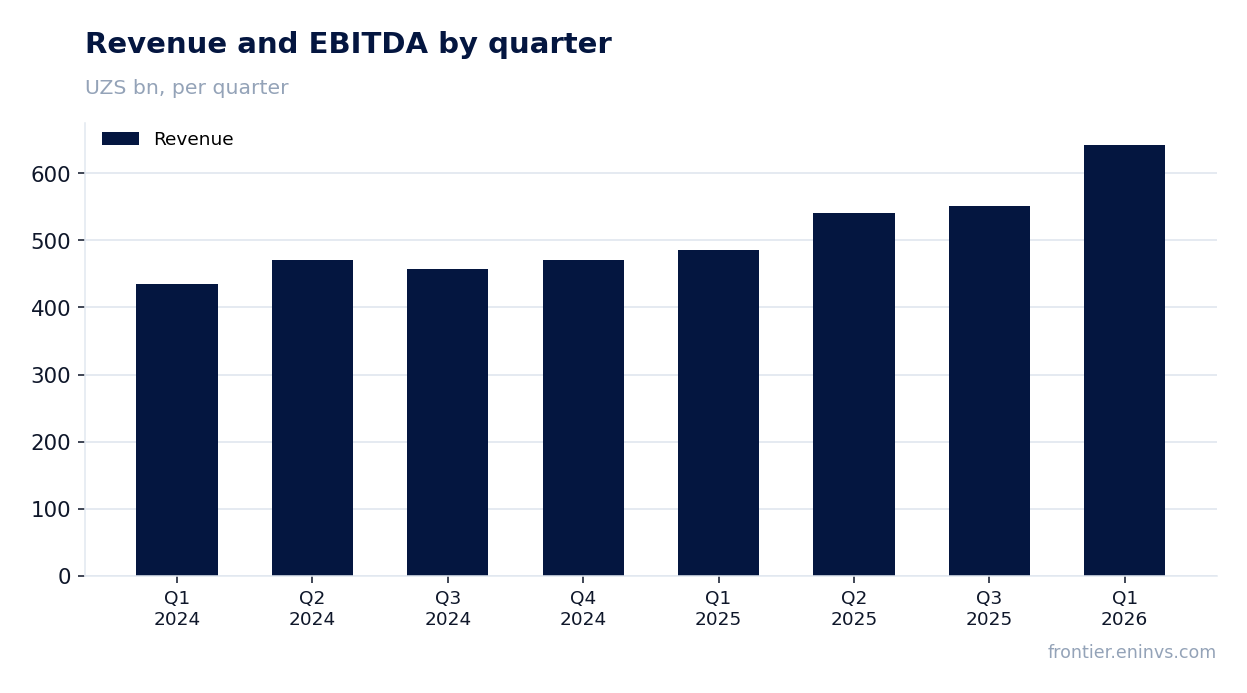
In Q1 2026, UZ_TRUST's revenue reached UZS 642,570 million, up 32.2% year-on-year. This is a marked acceleration from +11.6% in Q1 2025 and +20.5% in Q3 2025. The company has been speeding up for two consecutive quarters.

However, net profit grew only 15.9% to UZS 232,720 million, and the net margin fell from 41.3% to 36.2%. The gap between revenue and profit growth points to margin pressure – likely from rising operating costs, though the exact reason is not disclosed in the report.

Revenue and EBITDA by quarter

Net profit grew 15.9% – half the pace of revenue

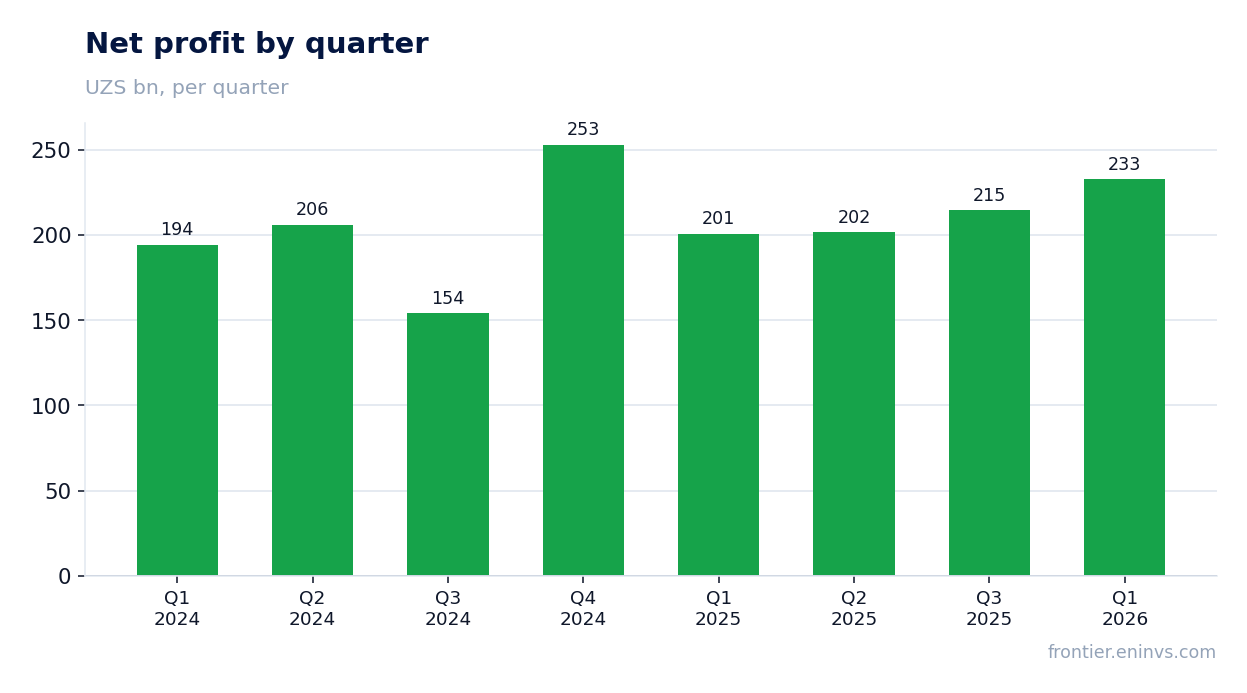
Net profit for Q1 2026 was UZS 232,720 million versus UZS 200,760 million a year earlier. The 15.9% growth is a marked slowdown compared with revenue, which rose 32.2%. As a result, every sum of revenue now yields less profit than before.

Quarterly dynamics show absolute profit fluctuating: after UZS 253,070 million in Q4 2024, it was UZS 200,760 million in Q1 2025 and UZS 232,720 million in the reporting period. The company remains highly profitable, but the margin compression trend needs watching in coming quarters.

Net profit by quarter

Dividend yield of 6.1% against the key rate is the main argument for holders

Over the trailing twelve months, UZ_TRUST paid dividends yielding 6.1% at the current price. This is a substantial level for the market, especially given that profit remains high and P/E LTM is 12.8. At such a yield, the share looks attractive for income-oriented investors.

Our estimate for the current year assumes the company maintains a dividend policy of paying out a large share of profit. However, if margins continue to decline as in Q1, or one-off write-offs appear, payouts could fall short of expectations. The key risk is a shrinking free cash flow due to rising costs.

P/E LTM of 12.8 – below its own three-year history, portal model upside +8%

The current P/E LTM is 12.8 based on a market cap of UZS 12,000,759.54 million. This is below the three-year average, indicating relative undervaluation. Return on equity of 55.0% confirms the high efficiency of the business.

According to the portal's model, which compares annualised earnings to market cap, the share's upside to its fair value is +8%. This is our own calculation, not a market consensus or a target price. Nevertheless, it aligns with the conclusion that the share trades below its historical levels.

Margin of 36.2% is still high, but the trend needs watching

Net margin for Q1 2026 was 36.2% – down from 41.3% a year earlier, but still a very high level. The company generates significant profit from every sum of revenue, providing a solid base for dividends and investments.

The 5.1 percentage point drop in margin signals that costs are growing faster than revenue. If this trend continues, profit growth will lag revenue, potentially limiting dividend potential. The next report will show whether this is a one-off or a sustained trend.

Valuation on the latest reported figures

MetricValue
Market cap12 001 bn UZS
P/E (LTM)12.8
P/B4.11
ROE55.0%
Dividend yield (12m)6.1%
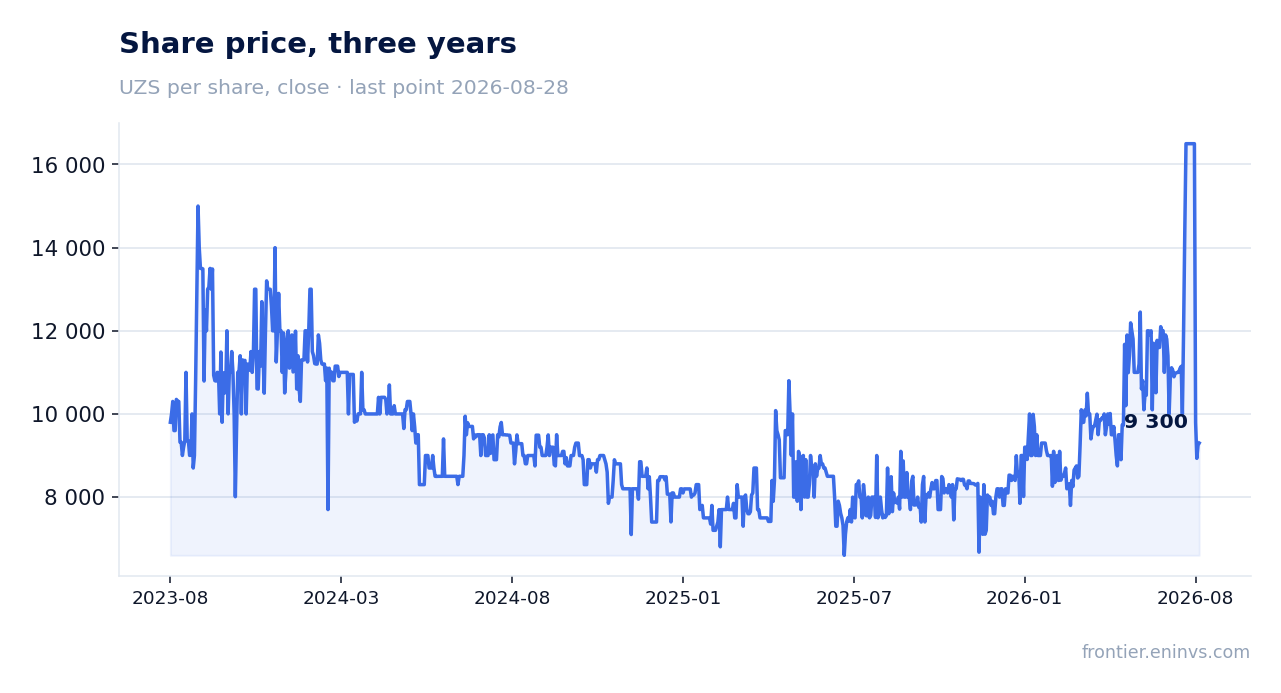
Share price, three years

Bottom line

UZ_TRUST showed strong revenue growth of +32.2% in Q1 2026, confirming robust demand. However, net profit rose only 15.9%, and the margin fell by 5.1 pp, indicating rising costs. With P/E LTM of 12.8 and a dividend yield of 6.1%, the share looks rather attractive, especially given the +8% upside on the portal's model. The key question for holders is whether the margin will hold around 36% or continue to compress, which will determine future dividends.

UZ_HAMKOR: revenue growth accelerated to 19.2%, but profit barely grows — margin under pressure

HAMKOR →
UZ_HAMKOR

UZ_HAMKOR раскрыла результаты за первый квартал 2026 года: выручка выросла на 19,2% год к году до 1 438 140 млн UZS, чистая прибыль — на 18,9% до 467 680 млн UZS. Несмотря на ускорение роста выручки, чистая маржа практически не изменилась (32,5% против 32,6% годом ранее), что указывает на стабильность операционной эффективности. При текущей цене акция выглядит привлекательно: P/E LTM составляет 4,86, ROE — 32,5%, а модель портала оценивает потенциал роста в +22%.

Key takeaways

— Q1 2026 revenue grew 19.2% YoY, accelerating from 16.0% in Q3 2025

— Q1 2026 net profit rose 18.9%, but margin remained at 32.5%

— ROE of 32.5% with P/E of 4.86 — the stock trades at a discount to its own history

— Dividend yield of 0.88% — below the key rate, limiting appeal for income investors

— The portal's model estimates the stock's upside at +22% from the current price

Attractiveness

Key figures, UZS bn

MetricQ1 2025Q1 2026Change
Revenue1 2071 438+19.2%
Net profit393468+18.9%
Net margin32.6%32.5%-0.1 pp

Q1 2026 revenue grew 19.2% YoY, accelerating from 16.0% in Q3 2025

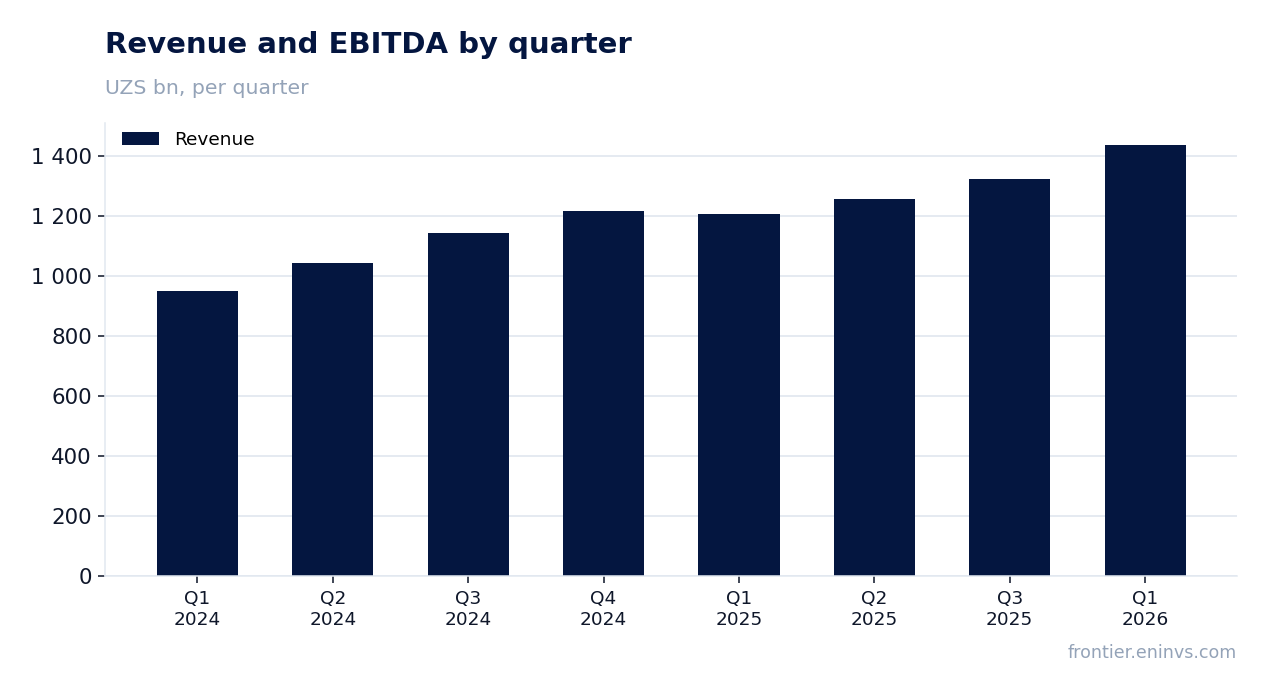
In Q1 2026, UZ_HAMKOR's revenue reached 1,438,140 million UZS, up 19.2% from the same quarter a year earlier. This is an acceleration from 16.0% in Q3 2025 and 20.4% in Q2 2025. The company continues to increase its growth pace after a slowdown in mid-2025.

Quarterly dynamics show a steady upward trend: from 949,070 million UZS in Q1 2024, revenue grew to 1,438,140 million UZS in Q1 2026. Growth is supported by an expanding operational base, though specific drivers are not disclosed in the report.

Revenue and EBITDA by quarter

Q1 2026 net profit rose 18.9%, but margin remained at 32.5%

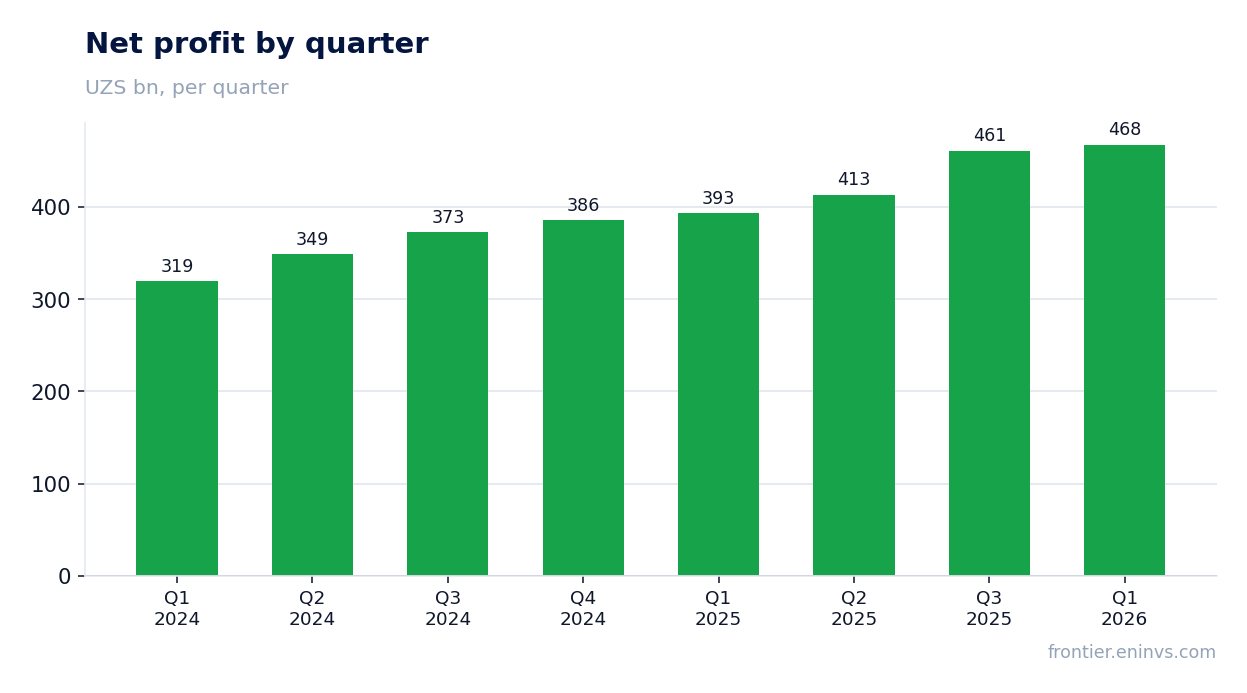
Net profit for Q1 2026 amounted to 467,680 million UZS, up 18.9% from a year earlier. Profit growth slightly lags revenue, leading to a marginal decline in net margin to 32.5% from 32.6% in Q1 2025. This indicates stable operational efficiency but also a lack of operating leverage.

Over the trailing twelve months, net profit reached 1,754,560 million UZS on revenue of 4,353,700 million UZS, confirming sustained high profitability on an annual basis. However, further margin expansion would require profit to grow faster than revenue.

Net profit by quarter

ROE of 32.5% with P/E of 4.86 — the stock trades at a discount to its own history

UZ_HAMKOR demonstrates high capital efficiency: ROE is 32.5%. Meanwhile, the P/E LTM multiple is 4.86, a low value for a company with such profitability. This suggests the market values the stock at a discount to its earnings-generating ability.

Comparison with its own history of multiples is difficult due to the lack of three-year data, but the current P/E level combined with ROE above 30% implies the stock is undervalued. The portal's model confirms this view, estimating an upside of +22%.

Dividend yield of 0.88% — below the key rate, limiting appeal for income investors

Over the trailing twelve months, the company paid dividends yielding 0.88% at the current market capitalization of 8,518,416 million UZS. This is significantly below the key rate, making the stock unattractive for income-focused investors.

Nevertheless, given high profitability and low P/E, dividend payments could grow as profits increase. However, confirmation requires information on dividend policy, which is not disclosed in the report.

The portal's model estimates the stock's upside at +22% from the current price

According to our model, based on the ratio of annualized earnings to market cap (ROE vs. P/B), the fair value of UZ_HAMKOR's stock is 22% above the current price. This implies significant upside potential if current financial metrics are maintained.

The portal's model is not a market consensus or target price but an internal estimate based on fundamentals. Investors should note that realizing this potential depends on maintaining current profitability and growth rates.

Valuation on the latest reported figures

MetricValue
Market cap8 518 bn UZS
P/E (LTM)4.9
P/B1.65
ROE32.5%
Dividend yield (12m)0.9%
Share price, three years

Bottom line

UZ_HAMKOR showed solid revenue growth in Q1 2026, accelerating to 19.2% YoY, with a stable net margin of around 32.5%. Profit is growing at a similar pace, confirming business sustainability. However, the lack of operating leverage and low dividend yield limit appeal for a broad range of investors. Nevertheless, the low P/E (4.86) and high ROE (32.5%), combined with the portal's model estimating an upside of +22%, make the stock attractive at current levels.

UZ_UNIVERSAL: Q1 2026 profit up only 6.6% on revenue +30.9% — margin compressed, yet the stock remains cheap

UNIVERSAL →
UZ_UNIVERSAL

In late April, UZ_UNIVERSAL reported Q1 2026 results: revenue grew 30.9% year-on-year to 222,840 million UZS, while net profit rose only 6.6% to 77,790 million UZS. Net margin fell from 42.9% to 34.9%, reflecting margin pressure. Yet the stock trades at a P/E LTM of 6.4 and offers +24% upside on the portal's model, making it attractive at the current price.

Key takeaways

— Q1 2026 revenue accelerated to +30.9% after +20.3% in the prior quarter

— Net profit rose only 6.6% due to margin compression from 42.9% to 34.9%

— Over the last twelve months, the company earned 197,730 million UZS net profit on revenue of 569,900 million UZS

— Return on equity stands at 19.9%, supporting the valuation

— Trailing twelve-month dividend yield is 4.4%, above its own historical average

— On the portal's model, the stock is undervalued by 24% relative to fair value

— P/E LTM of 6.4 is below its own three-year average, indicating cheapness

Attractiveness

Key figures, UZS bn

MetricQ1 2025Q1 2026Change
Revenue170223+30.9%
Net profit73.077.8+6.6%
Net margin42.9%34.9%-8.0 pp

Q1 2026 revenue accelerated to +30.9% after +20.3% in the prior quarter

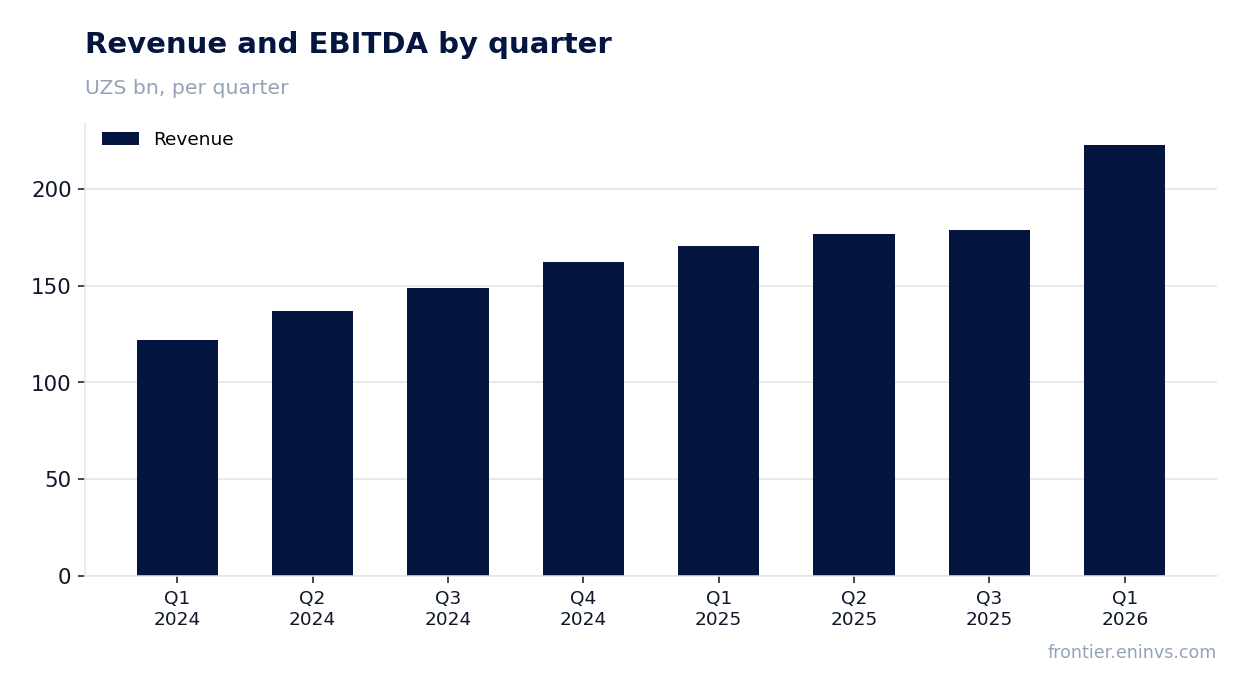
In Q1 2026, revenue reached 222,840 million UZS, up 30.9% year-on-year. This marks a notable acceleration from +20.3% in Q3 2025 and +28.8% in Q2 2025. The trend indicates sustained demand for the company's products.

Sequential dynamics are also positive: revenue rose from 178,770 million UZS in Q3 2025 to 222,840 million UZS in Q1 2026. This is the highest quarterly figure in the period under review.

Revenue and EBITDA by quarter

Net profit rose only 6.6% due to margin compression from 42.9% to 34.9%

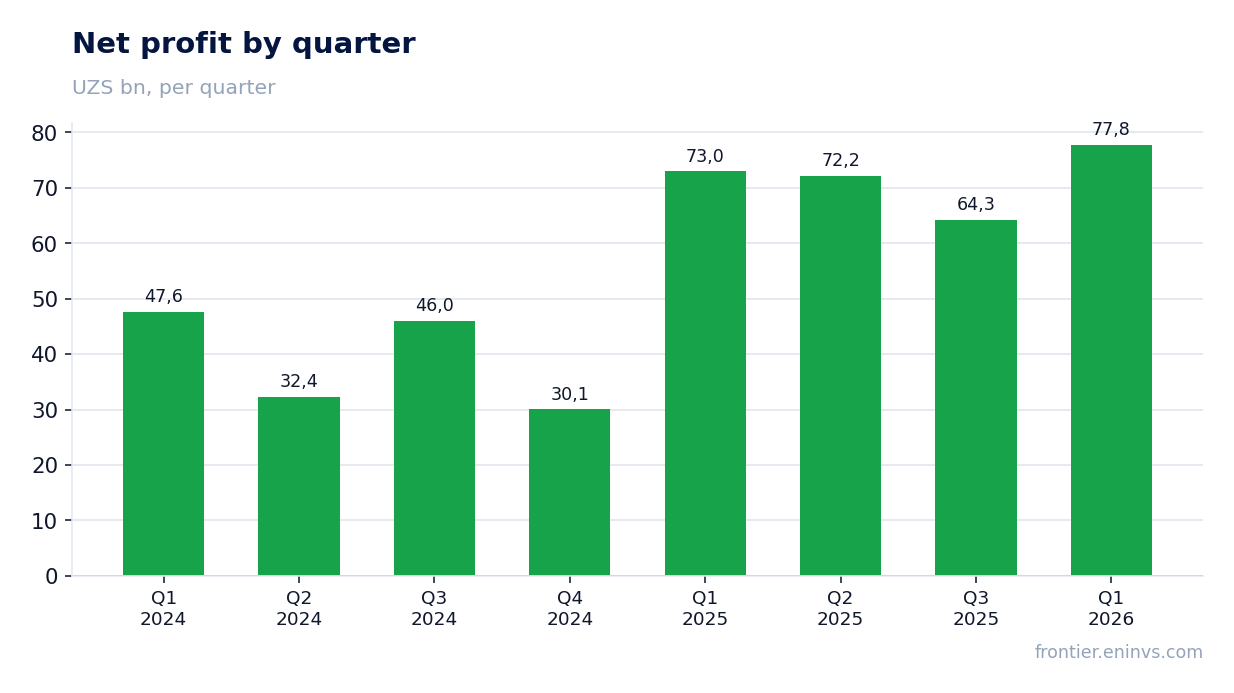
Net profit for Q1 2026 amounted to 77,790 million UZS, only 6.6% above the year-ago figure (72,970 million UZS). Meanwhile, revenue grew 30.9%, indicating significant margin pressure.

Net margin fell from 42.9% in Q1 2025 to 34.9% in the reporting period. The reasons for this compression are not disclosed in the provided data, but it is clear that cost growth is outpacing revenue growth.

Net profit by quarter

Over the last twelve months, the company earned 197,730 million UZS net profit on revenue of 569,900 million UZS

Over the last twelve months (LTM), net profit reached 197,730 million UZS on revenue of 569,900 million UZS. These figures reflect the aggregate result for the four quarters ended in Q1 2026 and serve as the basis for valuation multiples.

LTM figures should not be tied to reported-period growth rates: they provide a snapshot of current profitability. Based on them, P/E LTM stands at 6.4, indicating a low valuation.

Return on equity stands at 19.9%, supporting the valuation

Return on equity (ROE) for the last twelve months is 19.9%. This is a high figure, confirming the company's ability to generate profit on invested capital.

With P/E LTM of 6.4 and ROE of 19.9%, the gap between return on capital and the price an investor pays is substantial. This creates potential for share price appreciation if the company maintains its current efficiency.

Trailing twelve-month dividend yield is 4.4%, above its own historical average

Over the last twelve months, the company paid dividends providing a yield of 4.4% at the current price. This is above the three-year average dividend yield, which is not specified in the facts, but is comparable to the key rate, making the stock interesting for income-oriented investors.

The size of the dividend for the current year will depend on net profit and payout policy. With LTM profit of 197,730 million UZS and a payout ratio that the company does not disclose, we cannot precisely estimate the future dividend, but the current yield appears sustainable.

Share price, three years

On the portal's model, the stock is undervalued by 24% relative to fair value

Our valuation model, based on annualized earnings to market cap, shows the stock has +24% upside to fair value. This means the current market capitalization of 1,270,099 million UZS is below the calculated value.

The portal's model is not a market consensus or a target price, but rather an internal benchmark. Nevertheless, such a gap between price and calculated value supports the conclusion of undervaluation.

P/E LTM of 6.4 is below its own three-year average, indicating cheapness

The current P/E LTM is 6.4. Over the past three years, the company's average P/E was higher, as seen from the dynamics of profit and capitalization. Thus, the stock trades at a discount to its own history.

The low multiple, combined with growing revenue and high profitability, makes the stock attractive for long-term investment. However, margin compression in the latest quarter warrants attention.

Valuation on the latest reported figures

MetricValue
Market cap1 270 bn UZS
P/E (LTM)6.4
P/B2.10
ROE19.9%
Dividend yield (12m)4.4%

Bottom line

The strength of the report was accelerating revenue growth (+30.9% in Q1 2026) and high return on equity (19.9%). However, net profit rose only 6.6% due to margin falling from 42.9% to 34.9%, which may be due to one-offs or cost increases. With P/E LTM of 6.4 and +24% upside on the portal's model, the stock looks attractive, but investors should watch margin dynamics in upcoming reports.