Memory Chips and Rare Earths Crush It While Gas and Airlines Implode
This quarter's earnings season is a brutal split-screen: memory semiconductors and rare earths are posting triple-digit revenue growth, while gas processing and airlines are deep in negative territory. The median revenue growth across industries ranges from +256.8% for memory chips to -34.2% for airlines — a spread of nearly 300 percentage points. The winners are riding an AI and electrification capex boom; the losers are squeezed by margin compression and demand destruction. Nowhere is the divergence starker than in semiconductors: SK hynix revenue up 256.8% year over year, while MediaTek, a fabless chip designer, eked out just +1.2%.
Revenue growth by industry (median YoY)
Memory chips and rare earths are the undisputed champions
SK hynix (+256.8% revenue, +420.9% EBITDA) and Samsung Electronics (+130.0% revenue) are the standout players, both riding the AI-driven memory upcycle. Winbond Electronics (+184.7% revenue) and Nanya Technology (revenue n/m) confirm the broad-based strength. In rare earths, Lynas Rare Earths delivered +80.2% revenue and +184.7% EBITDA, capitalising on supply chain diversification away from China. These are not just high-growth; they are high-quality growth, with EBITDA expanding even faster than revenue.
Gas processing and airlines are bleeding
ADNOC Gas saw revenue plunge 33.2% and net profit collapse 52.0%, the worst in the energy complex. Airlines are even uglier: AIRA revenue fell 34.2% and net profit swung to a loss of 296.3%, while Air Arabia revenue dipped 0.2% but EBITDA crashed 49.9% and net profit plummeted 74.9%. These are not just cyclical dips; they signal structural headwinds — gas oversupply and post-pandemic travel normalisation hitting margins hard.
Fertiglobe's profit explosion is the plot twist
Fertiglobe, a fertilizer producer, delivered a stunning +91.9% revenue growth and a net profit surge of +466.8% — far outpacing its 3-year revenue CAGR of -17.5%. This acceleration from prior stagnation suggests a sharp cyclical upturn in fertilizer prices and volumes. Meanwhile, Pilbara Minerals, a lithium miner, saw revenue jump 73.0% and net profit soar 368.6%, but its 3-year revenue CAGR is -29.1%, highlighting extreme volatility. The twist: both are cyclical recoveries, not structural growth stories, and investors should be wary of extrapolating.
Cheap for growth: banks and gold miners offer value
HALYK Bank trades at just 4.1x earnings with a 13.2% dividend yield, despite a 3-year revenue CAGR of +24.3% — a classic value trap or deep value? Emaar Development is even cheaper at 3.9x P/E and 0.7x EV/EBITDA, with revenue up 32.1% and net profit up 43.6%. In contrast, Nu Holdings is priced for perfection at 110.1x P/E despite 50.2% revenue growth and a negative 3-year revenue CAGR of -26.5%. Similarly, Lynas Rare Earths trades at 65.0x P/E and 48.3x EV/EBITDA, a steep premium for its 80.2% revenue growth. The message: growth alone doesn't justify any price; cash flow and sustainability matter.
Income: KEGC and HALYK lead with double-digit yields
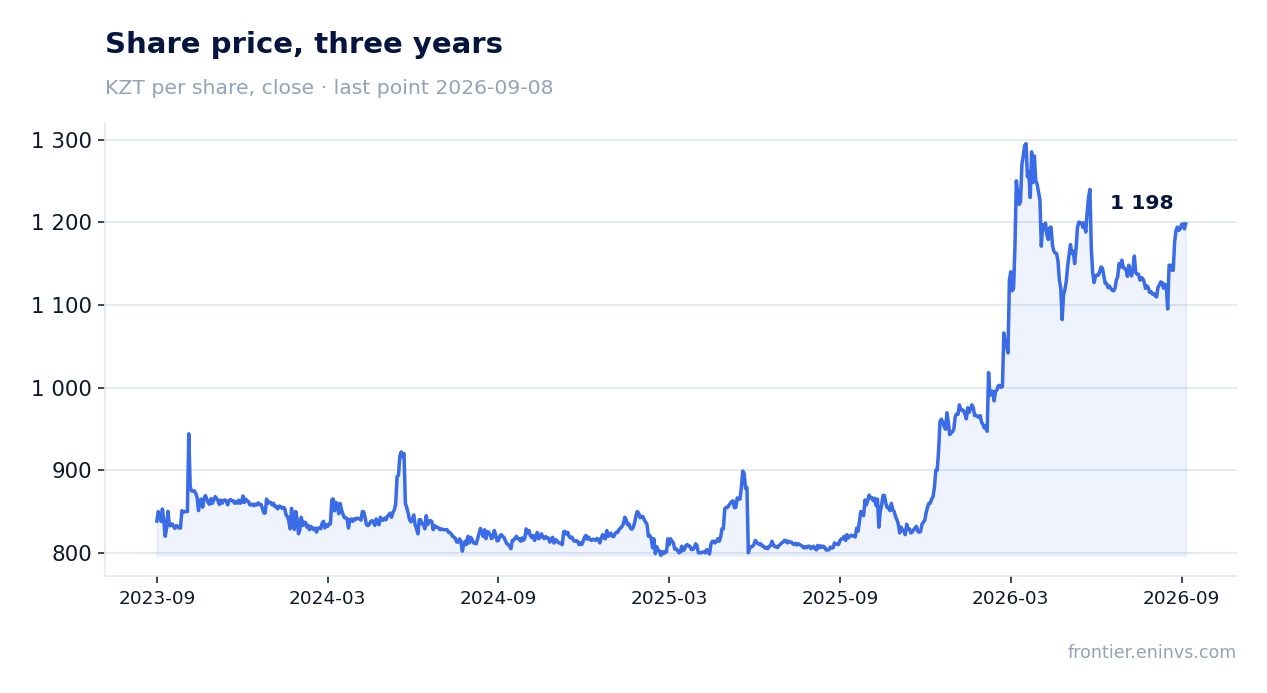
KEGC offers a 10.9% dividend yield (DPS 161.9₸ on a price of 1490.0₸) with revenue up 31.1% and net profit up 59.4%. HALYK Bank yields 13.2% (DPS 51.1₸ on 387.69₸) but net profit fell 15.3%. KZTO provides a 9.8% yield (DPS 118.0₸ on 1197.98₸) with revenue up 10.3% and net profit up 36.3%. These yields are attractive, but HALYK's declining profit warrants caution; KEGC and KZTO offer better growth-income balance.
The long view: TSMC and Nu Holdings show divergent paths
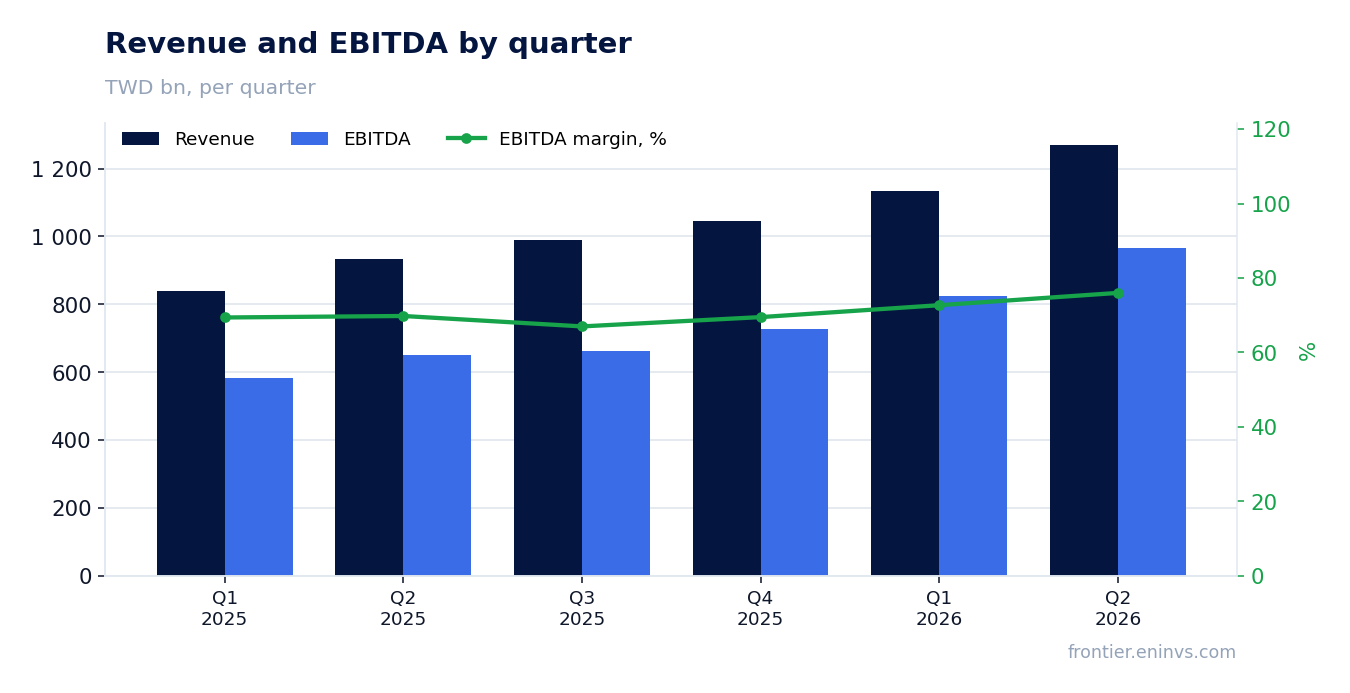
TSMC boasts a 3-year revenue CAGR of +18.9% and trades at 28.2x P/E, a reasonable premium for its dominant foundry position. Nu Holdings, despite a -26.5% 3-year revenue CAGR, trades at 110.1x P/E, a warning sign of overvaluation. Looking ahead, watch for memory chip demand sustainability and whether cyclical recoveries in fertilizers and lithium hold. The divergence between structural growth and cyclical spikes will define the next quarter.
Players: growth & yield (no absolute levels)
| Company | Industry | Revenue YoY | EBITDA YoY | Net profit YoY | P/E |
|---|---|---|---|---|---|
| Samsung Electronics (Q2) | Semiconductors & electronics | +130.0% | n/m | n/m | 10.0x |
| SK hynix (Q2) | Memory semiconductors | +256.8% | +420.9% | n/m | 8.0x |
| Hyundai Motor (Q2) | Automobiles | +1.9% | -29.6% | -15.9% | 9.5x |
| Kia (Q2) | Automobiles | +12.6% | -7.3% | +2.6% | 7.0x |
| LG Electronics (Q2) | Consumer electronics | +14.9% | +35.9% | +10.5% | 31.1x |
| POSCO Holdings (Q2) | Steel | +9.7% | +17.5% | +328.3% | 18.7x |
| Hyundai Mobis (Q2) | Auto components | +2.4% | +12.6% | +13.5% | 10.0x |
| LG Chem (Q2) | Chemicals & batteries | +19.0% | +52.9% | +126.1% | n/m |
| S-Oil (Q2) | Oil refining | +40.9% | n/m | n/m | 11.5x |
| Hanwha Aerospace (Q2) | Defence & aerospace | +47.2% | +107.8% | +253.1% | 23.6x |
| KT Corporation (Q2) | Telecom | -10.1% | -20.3% | -36.0% | 9.7x |
| HD Hyundai Heavy Industries (Q2) | Shipbuilding | +52.7% | +194.4% | +289.8% | 20.0x |
| LG Display (Q2) | Displays | +0.4% | -17.2% | -146.7% | 19.7x |
| Hanwha Ocean (Q2) | Shipbuilding | +65.2% | +207.7% | +366.6% | 12.6x |