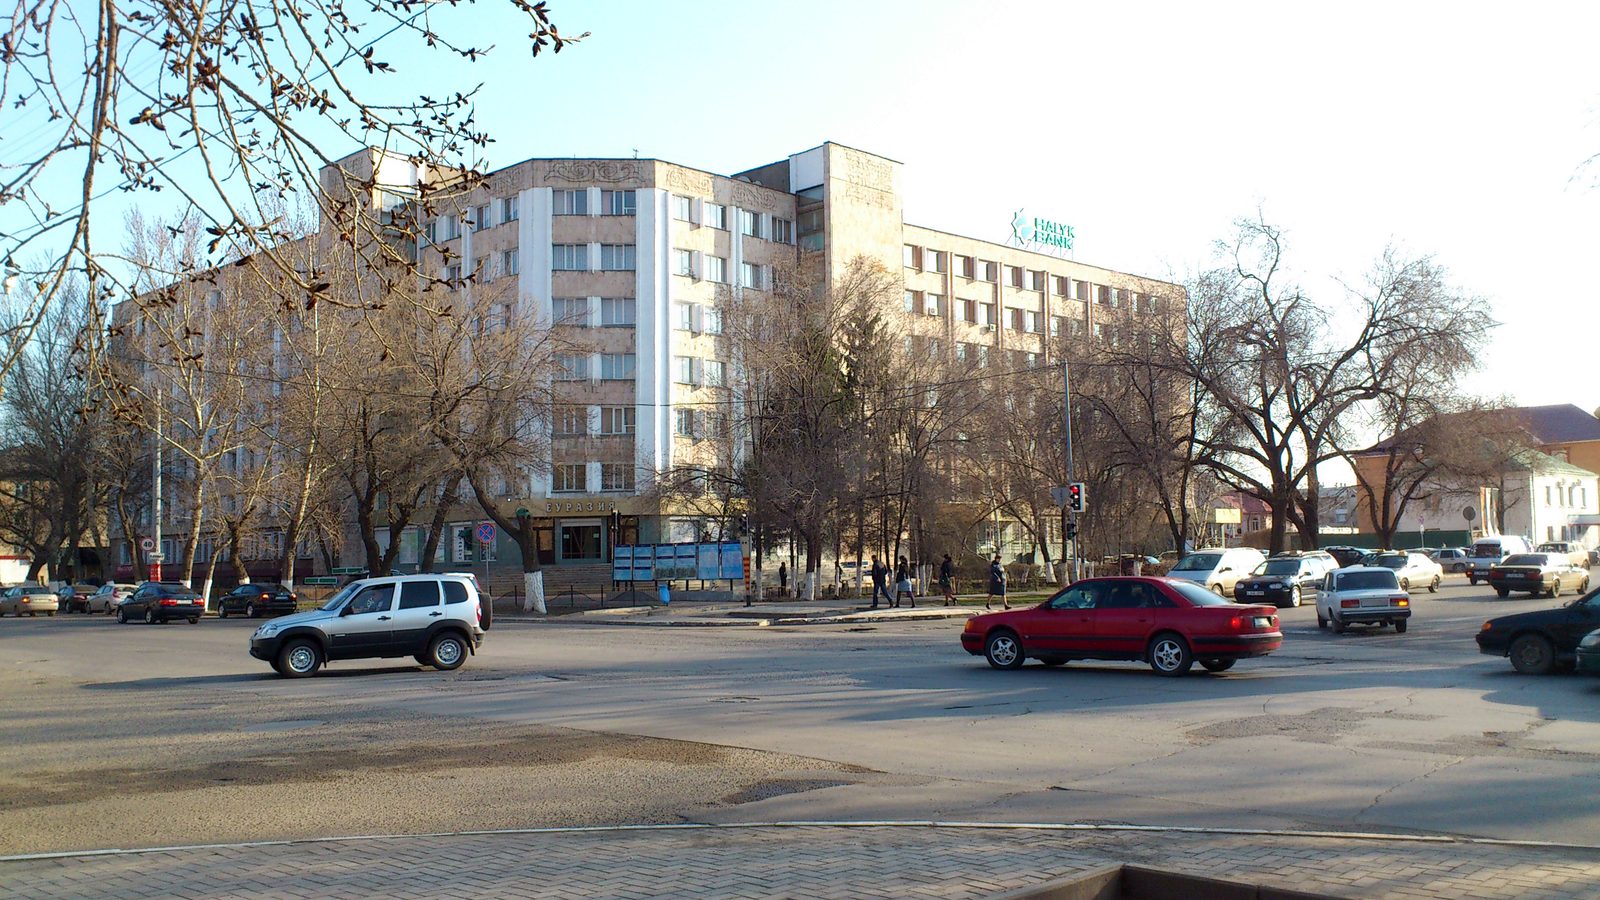
Halyk Bank is Kazakhstan’s largest universal bank, serving retail, SME and corporate clients with lending, deposits and payments.
Sector: Banks
HALYK
Shares: connector/market_inputs
Monetary columns are in B KZT, one decimal; scale (K/M/B/T) keeps values readable. For the period (default) shows P&L and cash flow for that row’s reporting window: quarterly amounts when the feed uses quarter-duration facts (typical US 10-Q revenue and income), quarterly cash flows after stripping YTD where only cumulative tags exist, and an implied Q4 on 31 Dec FY rows (P&L: FY minus Q1–Q3; operating / investing cash flow: FY 12m minus 9M YTD to 30 Sep when sourced from SEC builder evidence) so they match 10-Q scale. Some issuers still use cumulative YTD minus the prior row in the same calendar year. As reported shows values stored on each row (e.g. full-year on FY). Balance sheet is always as reported. Source JSON may use millions etc.; conversion uses amounts_unit per row.
| Date | Period | Status | Net interest incomeB KZT | Net profitB KZT | AssetsB KZT | EquityB KZT | ROE (annualized) | Source |
|---|---|---|---|---|---|---|---|---|
| 2026-06-30 | Q2 2026 (3M) | OK | 324.3 y/y 2.6% | 212.8 y/y -15.3% | 22036.3 y/y 12.3% | 3643.1 y/y 14.2% | 24.2% | Report (PDF) |
| 2026-03-31 | Q1 2026 (3M) | OK | 333.4 y/y 2.3% | 234.8 y/y -14.6% | 21195.6 y/y 12.4% | 3740.9 y/y 14.0% | 25.9% | Report (PDF) |
| 2025-12-31 | Q4 2025 (3M) | PARTIAL | 319.5 y/y 5.0% | 248.5 y/y -11.9% | 20908.5 y/y 12.7% | 3500.4 y/y 14.1% | 31.2% | Report (PDF) |
| 2025-09-30 | Q3 2025 (3M) | OK | -313.2 y/y 12.1% | -247.3 y/y 8.3% | 20410.3 y/y 15.6% | 3278.6 y/y 13.9% | 11.6% | Report (PDF) |
| 2025-06-30 | Q2 2025 (3M) | OK | 314.9 y/y 25.3% | 253.6 y/y 39.4% | 19615.7 y/y 17.1% | 3190.4 y/y 23.8% | 32.7% | Report (PDF) |
| 2025-03-31 | Q1 2025 (3M) | OK | 325.9 y/y 28.2% | 275.0 y/y 54.5% | 18855.9 y/y 18.5% | 3281.6 y/y 23.2% | 34.6% | Report (PDF) |
| 2024-12-31 | Q4 2024 (3M) | OK | 304.4 y/y -28.1% | 282.2 y/y -14.0% | 18548.4 y/y 19.7% | 3068.0 y/y 23.9% | 31.0% | Report (PDF) |
| 2024-09-30 | Q3 2024 (3M) | OK | -219.0 y/y 33.8% | -119.4 y/y 50.9% | 17650.1 y/y 23.9% | 2879.3 y/y 32.0% | 12.7% | Report (PDF) |
| 2024-06-30 | Q2 2024 (3M) | OK | 257.0 y/y 32.1% | 201.1 y/y 3.8% | 16749.9 y/y 17.6% | 2576.6 y/y 27.7% | 28.9% | Report (PDF) |
| 2024-03-31 | Q1 2024 (3M) | OK | 254.2 y/y 32.4% | 178.0 y/y -5.4% | 15910.9 y/y 12.5% | 2664.5 y/y 25.9% | 27.7% | Report (PDF) |
| 2023-12-31 | Q4 2023 (3M) | OK | 423.6 y/y — | 328.3 y/y — | 15494.4 y/y — | 2477.0 y/y — | 29.8% | Report (PDF) |
| 2023-09-30 | Q3 2023 (3M) | OK | -168.5 y/y — | -193.0 y/y — | 14249.6 y/y — | 2181.3 y/y — | 10.9% | Report (PDF) |
| 2023-06-30 | Q2 2023 (3M) | OK | 194.8 y/y — | 177.0 y/y — | 14241.5 y/y — | 2017.3 y/y — | 35.3% | Link |
| 2023-03-31 | Q1 2023 (3M) | OK | 192.1 y/y — | 188.2 y/y — | 14142.8 y/y — | 2116.3 y/y — | — | Report (PDF) |
<div class='muted' style='font-size:.72rem;line-height:1.2'><span style='color:#166534'>+25.4% y/y</span> · 78.9 bln mo <span style='color:#166534'>+4.5%</span></div> source: NBK
| Reported | Forecast | Monthly ×12 | |
|---|---|---|---|
| Reporting period | H1 2026 | ||
| RAS profit, quarter months | Jan 2026 70.6 bln Feb 2026 72.5 bln Mar 2026 67.0 bln Apr 2026 99.0 bln May 2026 89.2 bln Jun 2026 65.3 bln | Jan 2026 70.6 bln Feb 2026 72.5 bln Mar 2026 67.0 bln Apr 2026 99.0 bln May 2026 89.2 bln Jun 2026 65.3 bln | |
| RAS profit, following months | Jul 2026 75.6 bln | ||
| Forecast profit change (×1.01) | +1% | ||
| Annualised profit, mln RUB | 895.1 bln | 904.6 bln | 906.9 bln |
| Book (equity) | 3.6 trn | 3.6 trn | 3.6 trn |
| ROE (annualised) | 25% | 25% | 25% |
| Price / Book | 1.16x | 1.16x | 1.16x |
| Potential [ROE / P/B] | +21% | +21% | +21% |
| Card headline: avg of Forecast & Monthly | +21% | ||
Potential = annualised net profit / market cap (= ROE / P/B). 'Reported' is the last IFRS quarter annualised; 'Forecast' adjusts it for seasonality from the latest monthly RAS data (multiplier X = profit of the most recent months / profit of the quarter's months); 'Monthly ×12' annualises the latest RAS month. RAS = parent bank charter, IFRS = group; the bases differ, so the forecast is a momentum indicator.
| Period | Net profit (YTD) |
|---|---|
| Jul 2026 | 539.1 bln -5.9% y/y · 75.6 bln mo -23.7% |
| Jun 2026 | 463.6 bln -2.2% y/y · 65.3 bln mo +7.1% |
| May 2026 | 398.3 bln -3.6% y/y · 89.2 bln mo +13.1% |
| Apr 2026 | 309.1 bln -7.5% y/y · 99.0 bln mo +13.8% |
| Mar 2026 | 210.1 bln -15.0% y/y · 67.0 bln mo -19.1% |
| Feb 2026 | 143.1 bln -12.9% y/y · 72.5 bln mo -10.4% |
| Jan 2026 | 70.6 bln -15.3% y/y · 70.6 bln mo -15.3% |
| Dec 2025 | 976.9 bln +15.6% y/y · 80.0 bln mo +55.2% |
| Nov 2025 | 896.9 bln +13.1% y/y · 85.3 bln mo -18.0% |
| Oct 2025 | 811.6 bln +17.8% y/y · 84.5 bln mo -5.5% |
| Sep 2025 | 727.2 bln +21.2% y/y · 75.3 bln mo -6.1% |
| Aug 2025 | 651.9 bln +25.4% y/y · 78.9 bln mo +4.5% |
Period-end balances and loan-book quality from the National Bank of Kazakhstan per-bank return (bank-only, pre-consolidation, not IFRS).
| Period | Total assets | Gross loans | NPL 90+, % of loans | Stage 3, % of loans |
|---|---|---|---|---|
| Jul 2026 | 21.5 trn +11.5% y/y | 13.5 trn +8.4% y/y | 4.7% | 8.3% |
| Jun 2026 | 21.2 trn +10.5% y/y | 13.4 trn +8.9% y/y | 4.6% | 7.5% |
| May 2026 | 21.0 trn +12.9% y/y | 13.2 trn +10.7% y/y | 4.7% | 7.5% |
| Apr 2026 | 20.6 trn +11.0% y/y | 13.0 trn +9.8% y/y | 4.6% | 7.4% |
| Mar 2026 | 20.4 trn +11.7% y/y | 12.9 trn +10.2% y/y | 4.3% | 7.2% |
| Feb 2026 | 20.3 trn +11.4% y/y | 12.9 trn +11.1% y/y | 4.2% | 7.2% |
| Jan 2026 | 20.3 trn +12.5% y/y | 13.1 trn +13.3% y/y | 4.1% | 6.9% |
| Dec 2025 | 20.3 trn +13.0% y/y | 13.2 trn +12.7% y/y | 3.8% | 6.6% |
| Nov 2025 | 19.9 trn +14.2% y/y | 12.9 trn +16.1% y/y | 3.4% | 7.1% |
| Oct 2025 | 19.8 trn +13.9% y/y | 13.0 trn +21.3% y/y | 2.8% | 7.1% |
| Sep 2025 | 19.8 trn +15.5% y/y | 12.9 trn +21.7% y/y | 2.8% | 5.9% |
| Aug 2025 | 19.4 trn +12.8% y/y | 12.5 trn +19.5% y/y | 2.6% | 6.1% |
| Date | Per share | Details | Status | Source |
|---|---|---|---|---|
| 2026-08-25 | 2.436 USD | Ex-dividend: 2.436 USD per share | Paid | Yahoo Finance (ex-div) |
| 2026-04-29 | 2.5898 USD | Ex-dividend: 2.5898 USD per share | Paid | Yahoo Finance (ex-div) |
| 2025-09-22 | 1.5354 USD | Ex-dividend: 1.5354 USD per share | Paid | Yahoo Finance (ex-div) |
| 2025-05-02 | 2.3044 USD | Ex-dividend: 2.3044 USD per share | Paid | Yahoo Finance (ex-div) |
| 2024-12-12 | 0.7291 USD | Ex-dividend: 0.7291 USD per share | Paid | Yahoo Finance (ex-div) |
| 2024-05-14 | 2.2589 USD | Ex-dividend: 2.2589 USD per share | Paid | Yahoo Finance (ex-div) |
| 2023-05-30 | 2.251 USD | Ex-dividend: 2.251 USD per share | Paid | Yahoo Finance (ex-div) |
| 2022-10-24 | 1.0794 USD | Ex-dividend: 1.0794 USD per share | Paid | Yahoo Finance (ex-div) |
KASE: status follows wording in the news headline (paid vs intends to pay). Yahoo: amounts are cash dividends per share on ex-dividend dates (UTC calendar date). stockscope.uz (UZ): amounts are per share in UZS by publication date (not necessarily ex-div).
Investor reporting (IR): https://halykbank.com/results-and-presentations
Reporting forms detected in loaded periods: ✓ ✓ ✓ (Balance sheet / Profit or loss (P&L) / Cash flows)
Financial results, valuation multiples (P/E, P/B, EV/EBITDA), profitability and dividend yield of Halyk Bank of Kazakhstan JSC — from primary filings.
See also: The Cheapest Bank Stocks in the World (2026): Where Global Banks Trade Below Book · The Cheapest Stocks in the World (2026): What Value Investing Says About Buying Cheap · global valuation map