Chips and Cannons Crush the Consumer as Korea Splits in Two
This quarter was not about growth; it was about a violent bifurcation. Memory semiconductors posted median revenue growth of +256.8% year over year, while telecom contracted by -10.1% and displays crawled to +0.4%. The gap between the top and bottom industry medians exceeded 260 percentage points, the widest divergence in recent memory. If you owned chips, defence, or shipbuilding, you feasted. If you owned telecom, displays, or auto components, you starved.
Revenue growth by industry (median YoY)
Memory and defence rewrote the growth playbook
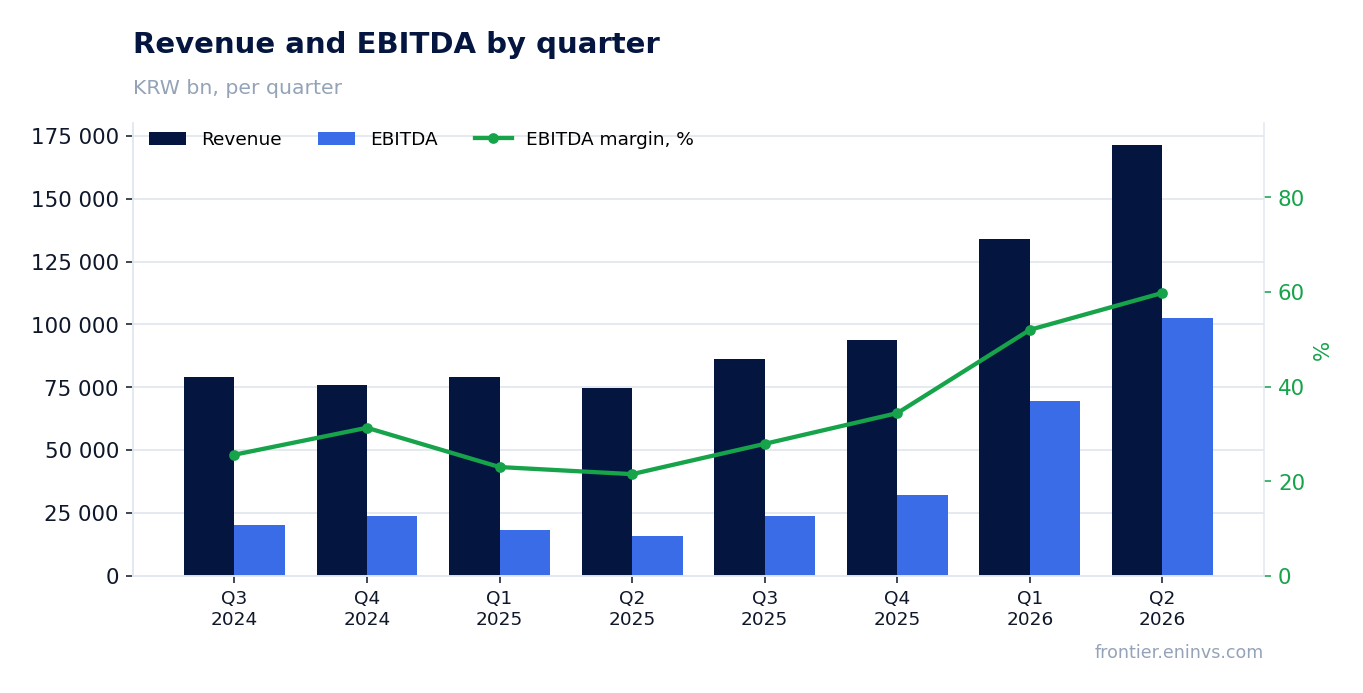
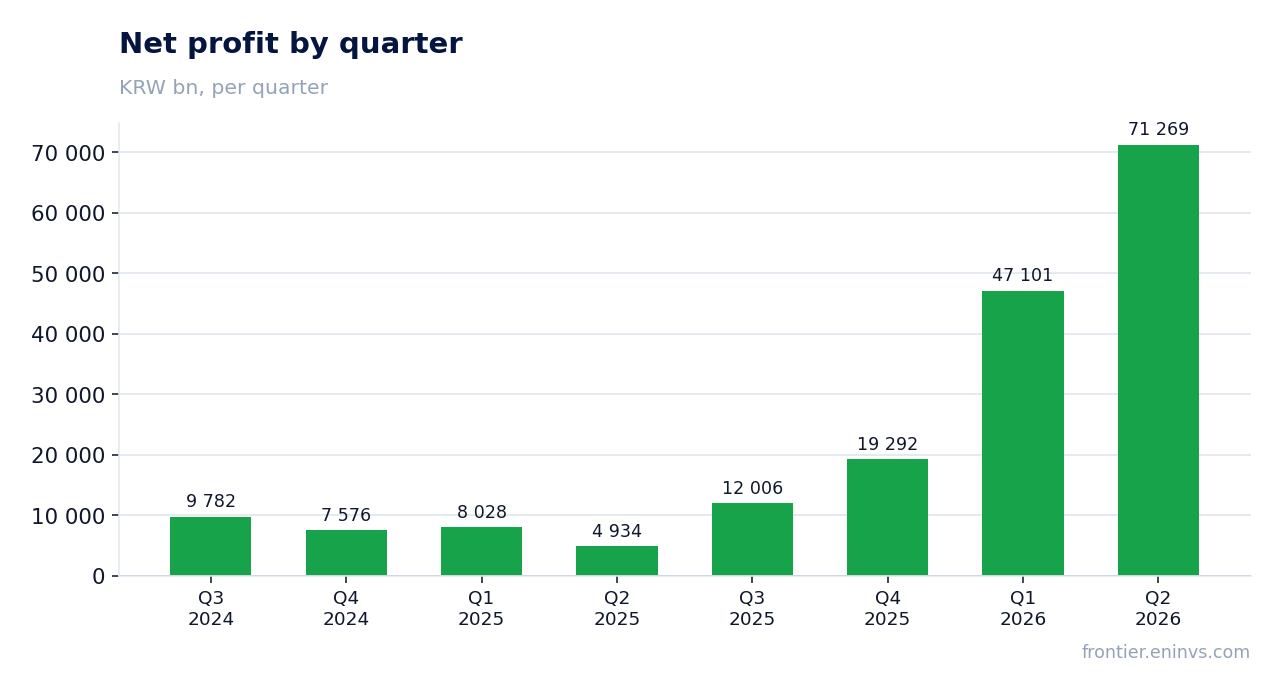
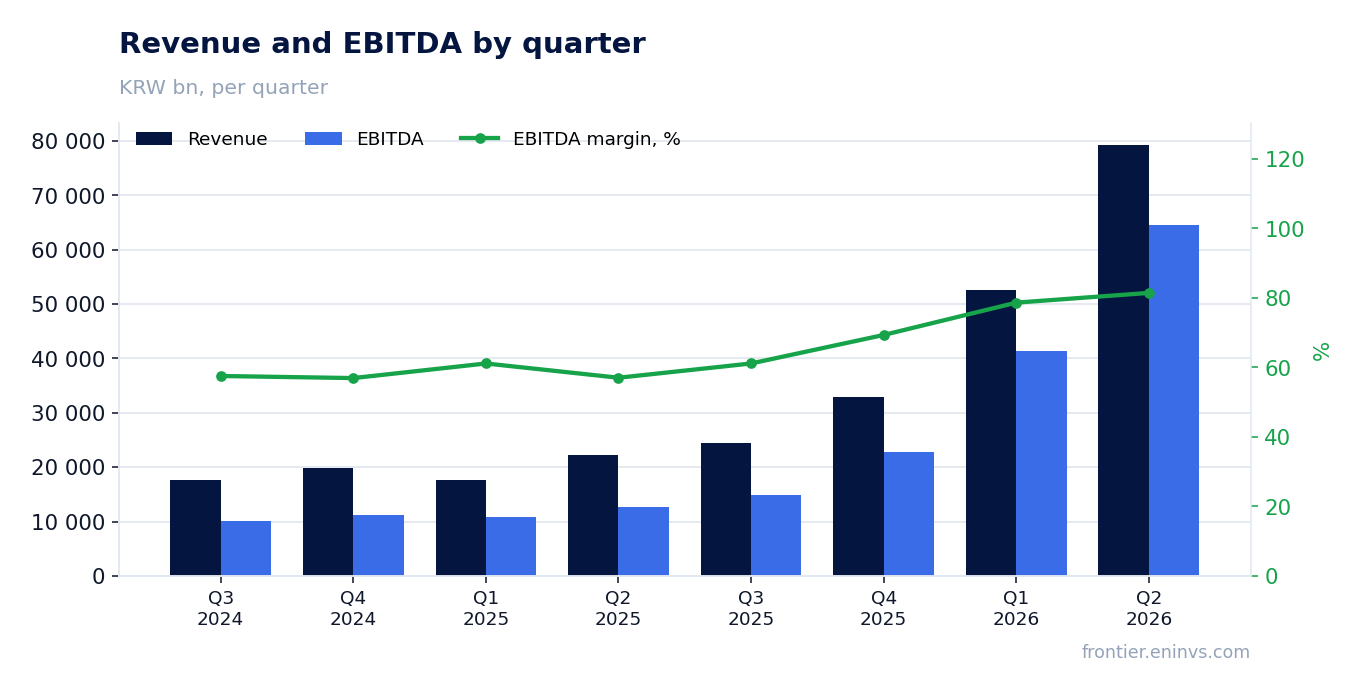
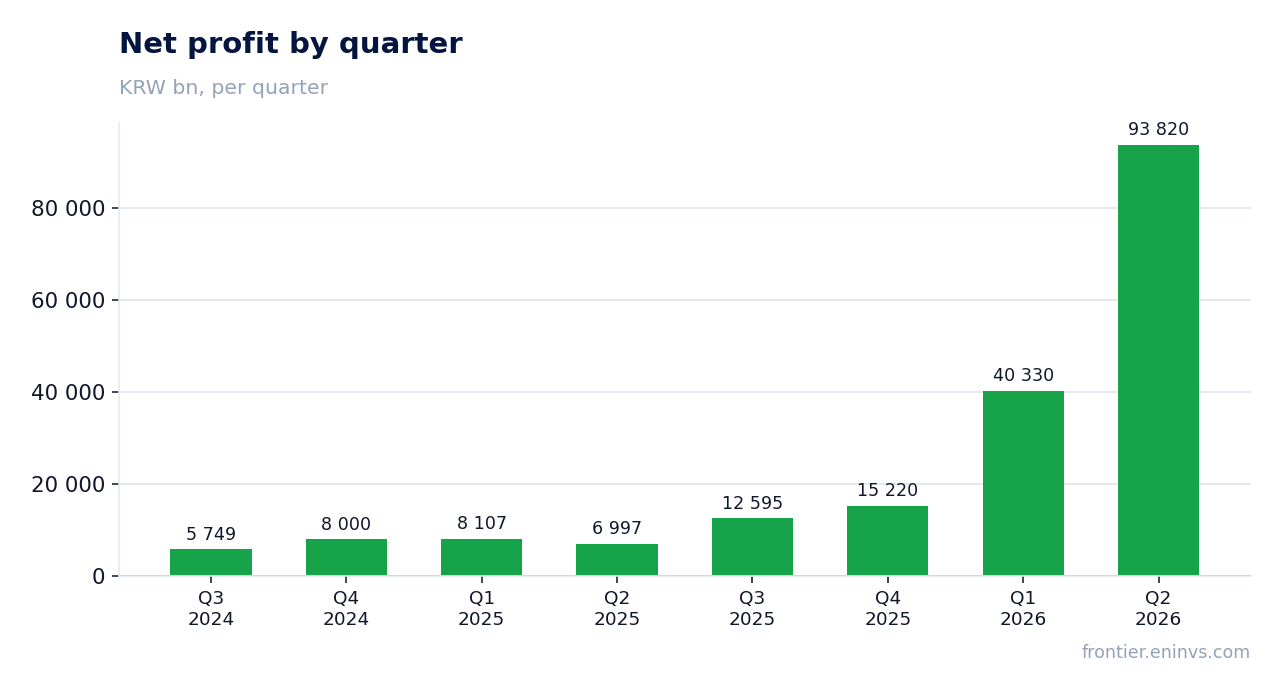
SK hynix delivered a staggering +256.8% revenue growth and +420.9% EBITDA growth, the highest of any company in our sample. Samsung Electronics, classified under semiconductors & electronics, grew revenue +130.0%, showing that the AI-driven demand cycle is broad and deep. In defence, Hanwha Aerospace grew revenue +47.2% and net profit +253.1%, while Hanwha Systems posted +45.5% revenue and +150.0% EBITDA growth. These are not one-off spikes; they reflect structural shifts in global supply chains and security spending.
Shipbuilders sailed past the wreckage of consumer-facing sectors
Hanwha Ocean led the shipbuilding trio with revenue +65.2% and net profit +366.6%, followed by HD Hyundai Heavy Industries at +52.7% revenue and +289.8% net profit. Samsung Heavy Industries grew revenue +20.4% but net profit only +4.8%, a laggard within its own winning industry. Meanwhile, telecom and displays were the clear losers: KT Corporation saw revenue fall -10.1% and net profit plunge -36.0%; LG Display eked out +0.4% revenue but net profit collapsed -146.7%. These are the sectors that failed to participate in the capex and AI boom.
The plot twist: Hyundai Motor's margin collapse despite revenue growth
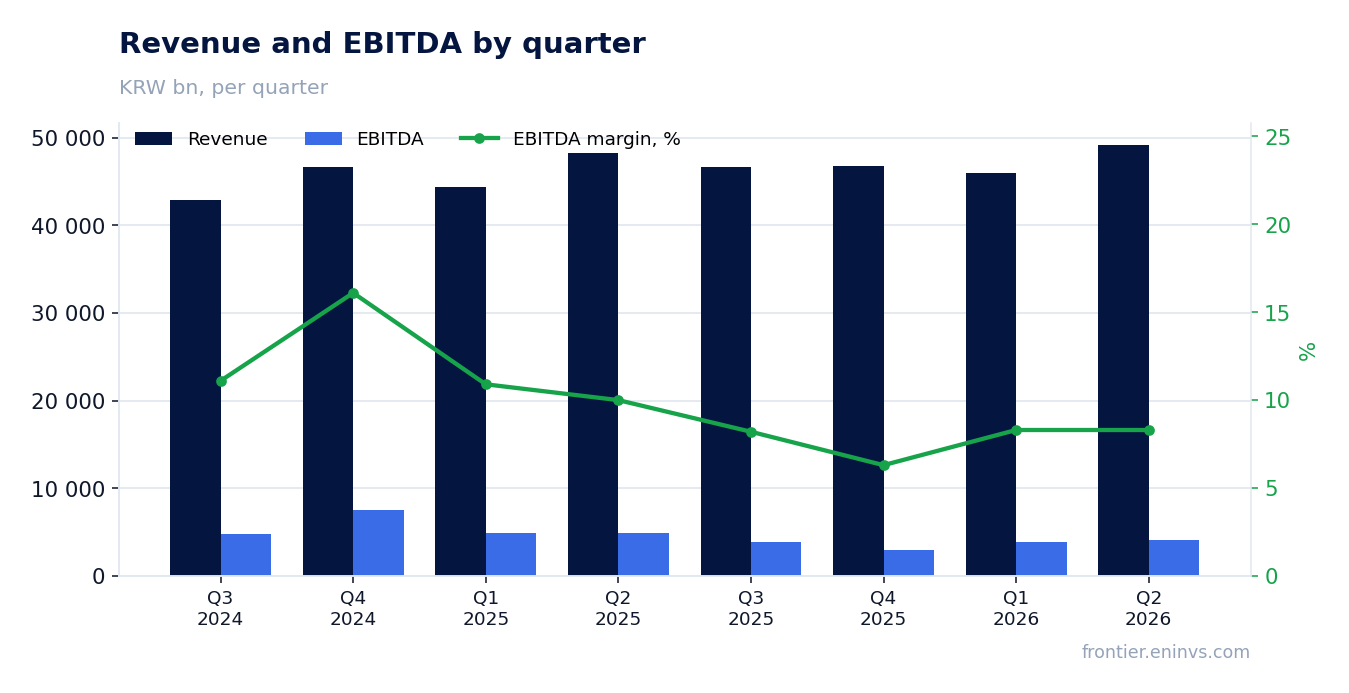
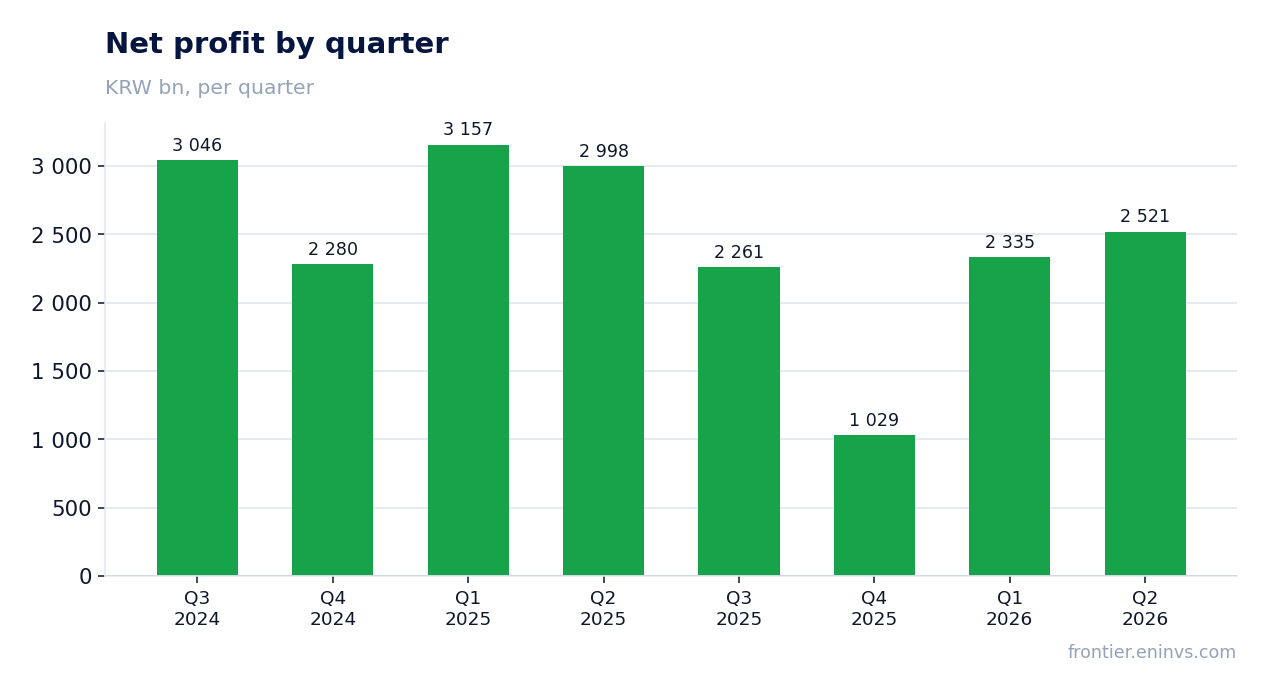
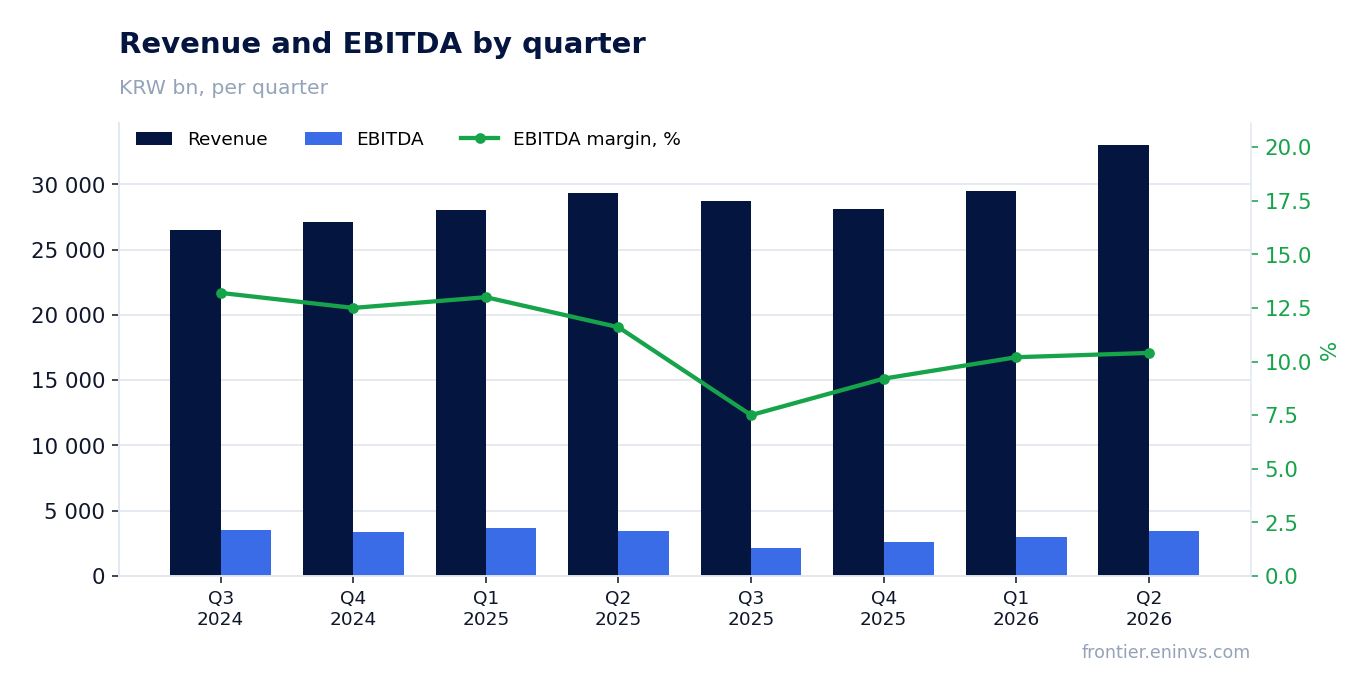
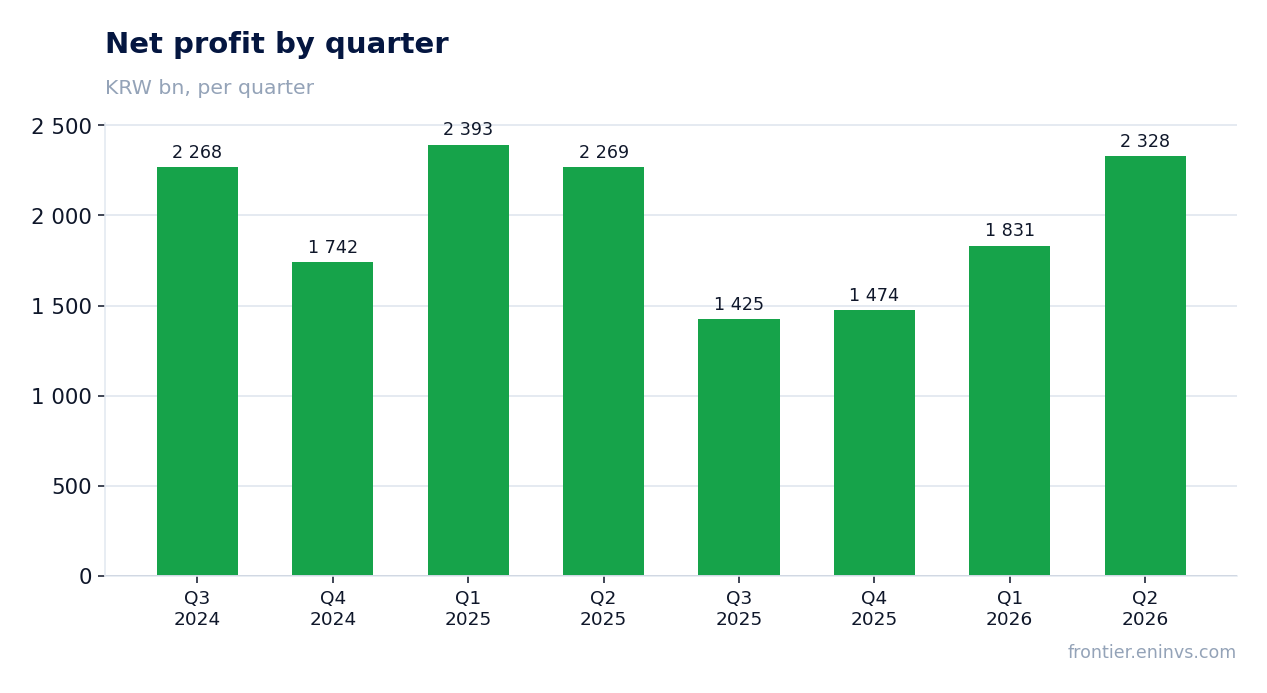
Hyundai Motor grew revenue +1.9% year over year, but EBITDA plummeted -29.6% and net profit fell -15.9%. That is a severe margin compression in an industry that grew +7.2% overall. Contrast this with Kia, which grew revenue +12.6% and net profit +2.6% — not spectacular, but far healthier. The divergence within automobiles is stark: Kia is navigating the cycle, Hyundai is struggling. This is the surprise of the season: a major automaker posting revenue growth yet haemorrhaging profitability.
Cheap for growth: shipbuilders and SK hynix offer value; Samsung Electro-Mechanics is priced for perfection
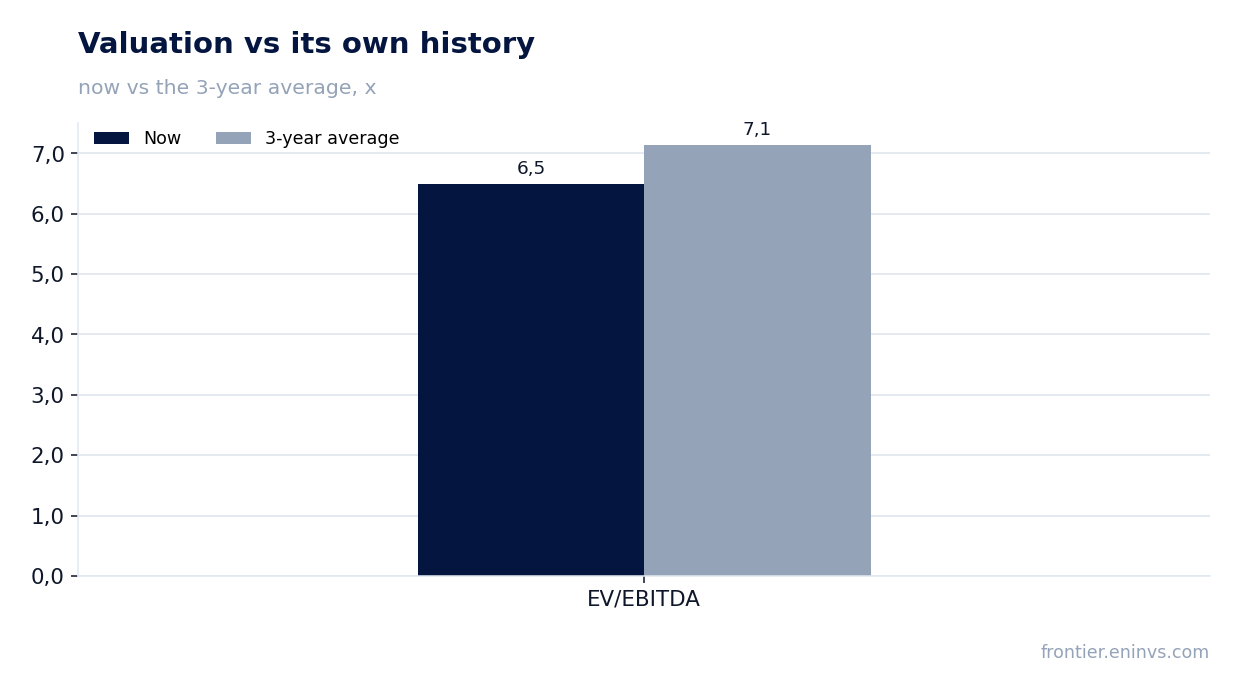
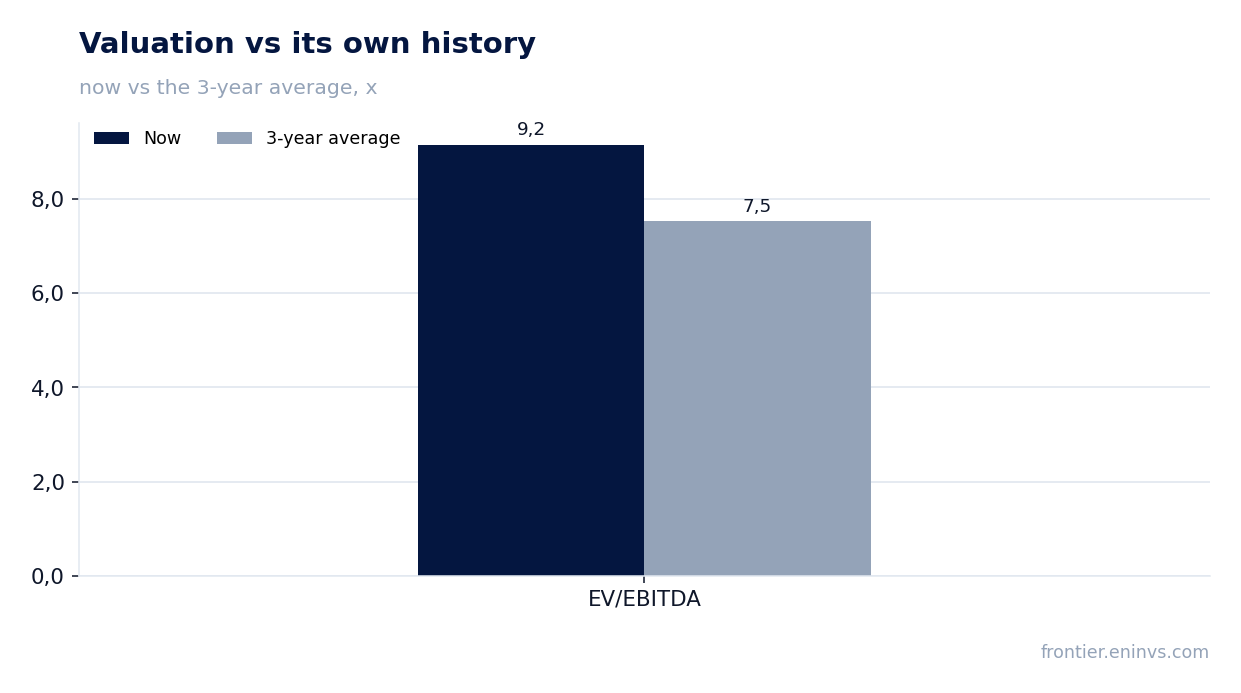
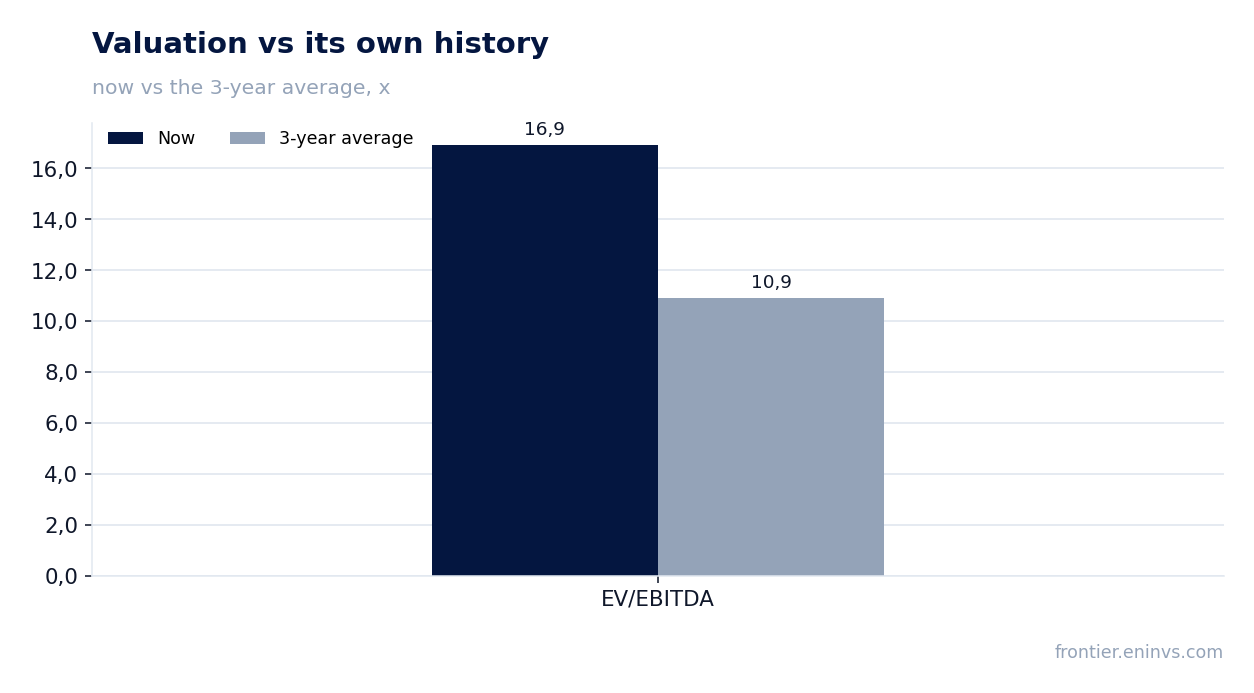
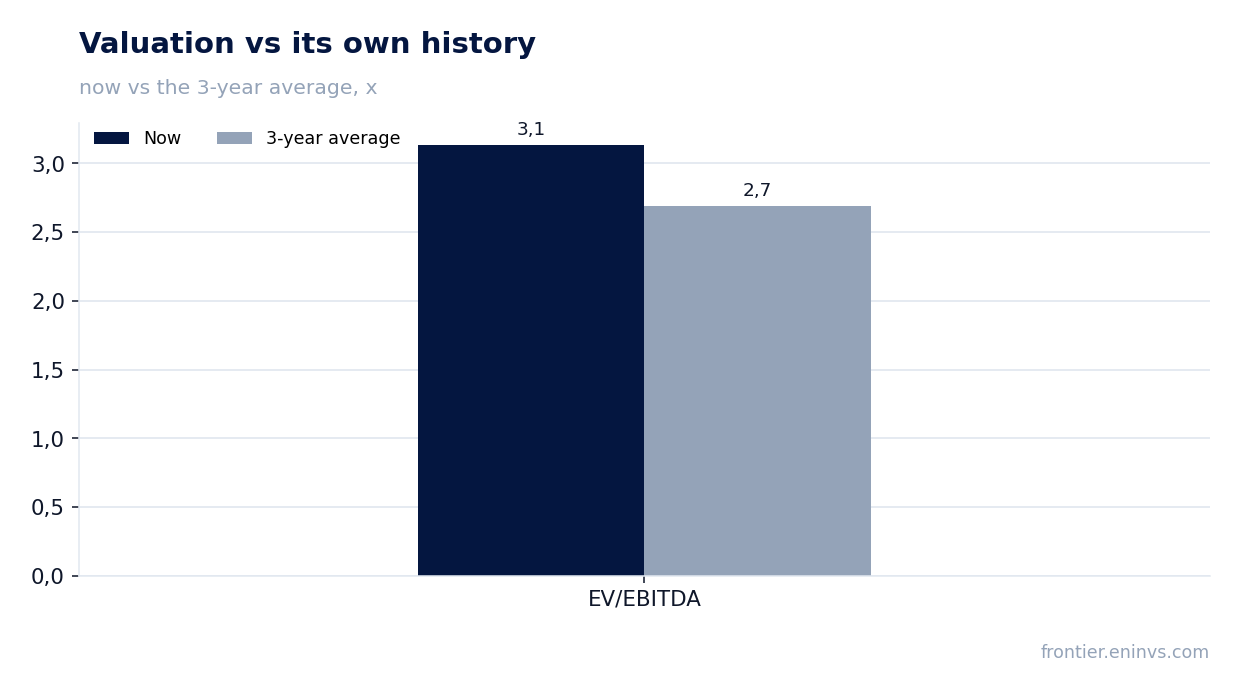
SK hynix trades at a P/E of 7.4x and EV/EBITDA of 8.3x — remarkably cheap for a company growing revenue at +256.8%. Hanwha Ocean, with +65.2% revenue growth, trades at just 10.6x earnings and 13.6x EV/EBITDA. HD Hyundai Heavy Industries, growing +52.7%, trades at 16.0x earnings and 10.5x EV/EBITDA. In contrast, Samsung Electro-Mechanics, growing revenue +24.2%, trades at a P/E of 111.5x and EV/EBITDA of 51.1x — a valuation that assumes flawless execution for years. Hanwha Systems, growing +45.5%, trades at 81.6x earnings and 43.3x EV/EBITDA. The market is paying up for defence electronics and components while ignoring the cheap cash generators in shipbuilding and memory.
Income hunters: banks and telecom offer the fattest yields in a growth-starved market
KB Financial Group and Shinhan Financial Group both trade at P/E ratios of 9.2x and 8.4x respectively, with stable revenue growth of +1.2% and +9.4%. KT Corporation, despite a -10.1% revenue decline, trades at a P/E of 9.6x and EV/EBITDA of 3.6x, suggesting the market has already priced in the bad news. While specific dividend yields are not provided, the low multiples and steady payouts from banks make them the go-to for income-focused investors. In a quarter where growth was binary, these sectors provided a safe harbour.
Looking at the three-year revenue CAGR, Hanwha Aerospace stands out with +55.8%, followed by Hanwha Ocean at +38.0% and SK hynix at +29.6%. These are the compounders that have consistently delivered. In contrast, HMM has a -16.3% three-year CAGR, and Samsung SDI has -13.0%, highlighting the volatility in shipping and batteries. The message for the next quarter: watch the AI and defence capex cycles, which show no signs of slowing. The bifurcation is likely to persist, and the cheap valuations in shipbuilding and memory may not last if earnings continue to surprise on the upside.
Players: growth & yield (no absolute levels)
| Company | Industry | Revenue YoY | EBITDA YoY | Net profit YoY | P/E |
|---|---|---|---|---|---|
| Samsung Electronics (Q2) | Semiconductors & electronics | +130.0% | n/m | n/m | 10.1x |
| SK hynix (Q2) | Memory semiconductors | +256.8% | +420.9% | n/m | 7.4x |
| Hyundai Motor (Q2) | Automobiles | +1.9% | -29.6% | -15.9% | 8.0x |
| Kia (Q2) | Automobiles | +12.6% | -7.3% | +2.6% | 5.9x |
| LG Electronics (Q2) | Consumer electronics | +14.9% | +35.9% | +10.5% | 31.3x |
| POSCO Holdings (Q2) | Steel | +9.7% | +17.5% | +328.3% | 17.2x |
| Hyundai Mobis (Q2) | Auto components | +2.4% | +12.4% | +13.5% | 8.7x |
| LG Chem (Q2) | Chemicals & batteries | +19.0% | +52.9% | +126.1% | n/m |
| S-Oil (Q2) | Oil refining | +40.9% | n/m | n/m | 12.9x |
| Hanwha Aerospace (Q2) | Defence & aerospace | +47.2% | +107.8% | +253.1% | 19.4x |
| KT Corporation (Q2) | Telecom | -10.1% | -20.3% | -36.0% | 9.6x |
| HD Hyundai Heavy Industries (Q2) | Shipbuilding | +52.7% | +194.4% | +289.8% | 16.0x |
| LG Display (Q2) | Displays | +0.4% | -17.4% | -146.7% | n/m |
| Hanwha Ocean (Q2) | Shipbuilding | +65.2% | +207.7% | +366.6% | 10.6x |