Hanwha Aerospace: Q2 revenue accelerated to +47.2%, but net profit barely grew due to one-offs
30 августа 2026 года Hanwha Aerospace раскрыла результаты за второй квартал 2026 года. Выручка выросла на 47,2% год к году, EBITDA – на 107,8%, однако чистая прибыль прибавила лишь 253,1% с базы прошлого года, которая была низкой. При текущей цене акция выглядит скорее привлекательно: мультипликатор EV/EBITDA 13,47 ниже собственного трёхлетнего среднего 16,13, а модель портала оценивает потенциал роста в +8%.
Key takeaways
— Выручка во втором квартале 2026 года выросла на 47,2% год к году, до 9 292,9 млрд вон, ускорившись после скромных +4,9% в первом квартале
— EBITDA-маржа во втором квартале достигла 17,3% против 12,3% годом ранее, чему способствовал операционный рычаг
— Чистая прибыль во втором квартале выросла на 253,1% год к году, но в первом квартале 2026 года она была почти вдвое выше – сказались разовые статьи
— Операционный денежный поток за последние 12 месяцев составил 4 049,8 млрд вон, но квартальная динамика крайне волатильна
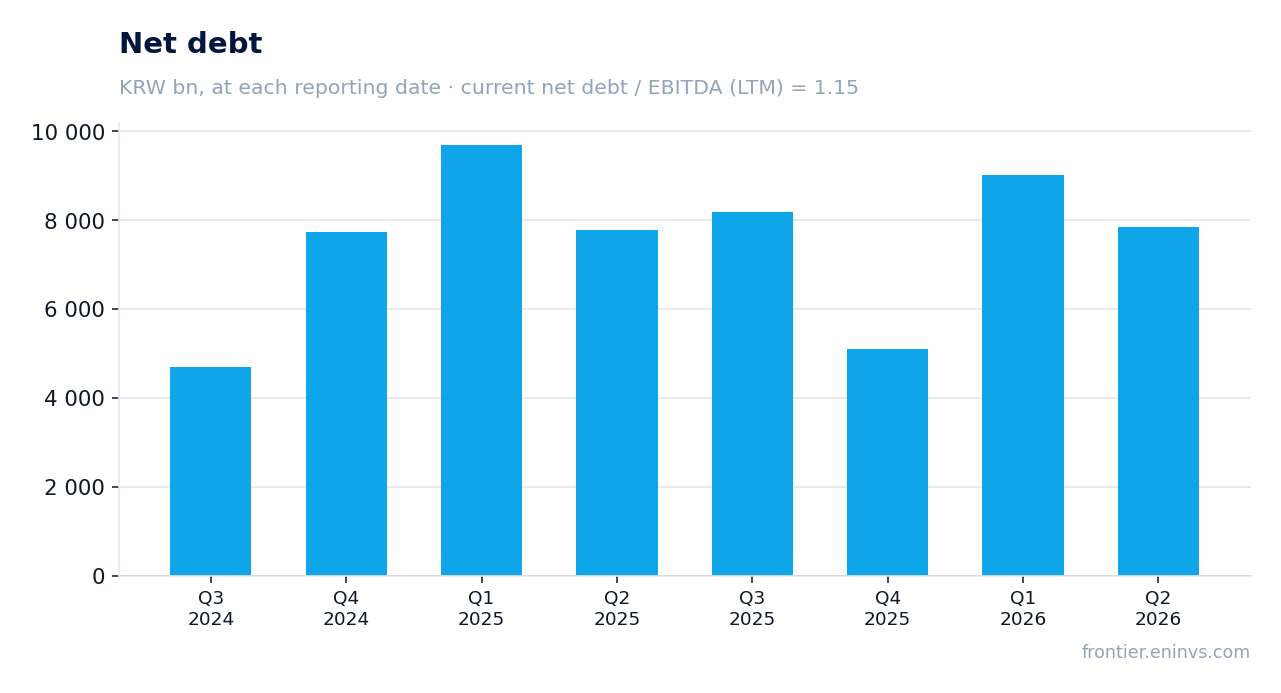
— Долговая нагрузка по состоянию на конец второго квартала – 1,15 EBITDA, что ниже среднего за три года
— Дивидендная доходность за последние 12 месяцев – 0,67%, что ниже ключевой ставки, но компания сохраняет возможности для роста выплат
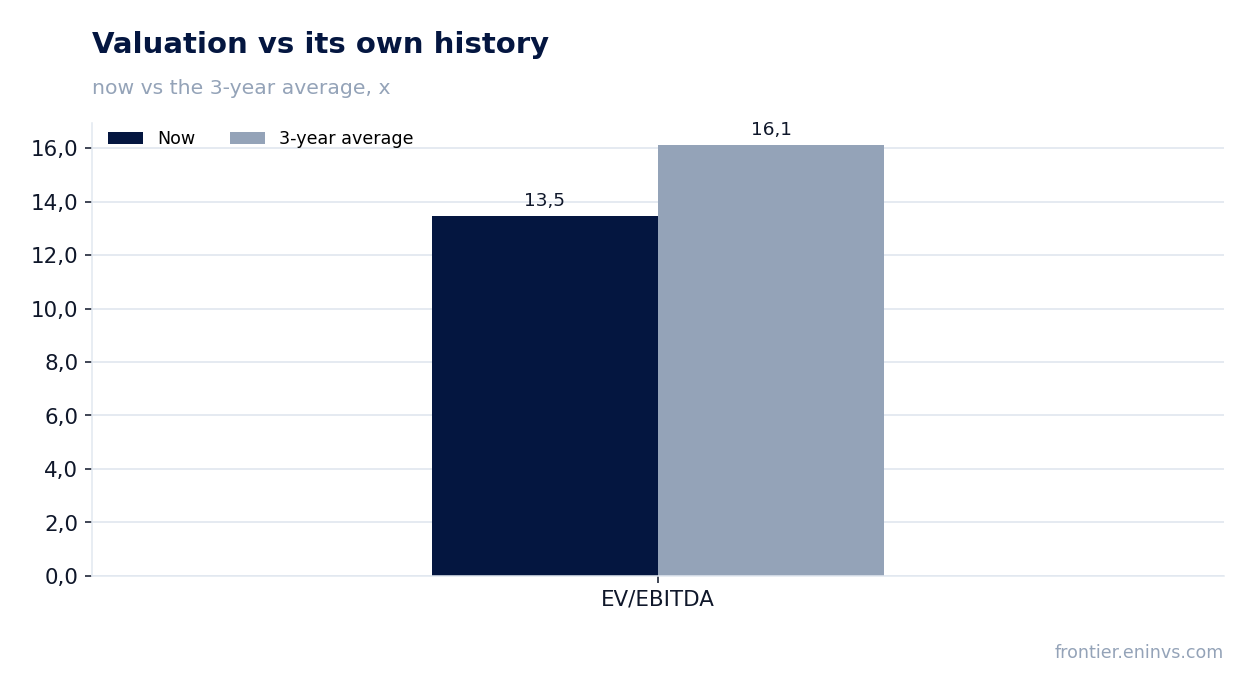
— Мультипликатор EV/EBITDA 13,47 ниже собственного трёхлетнего среднего 16,13, что даёт потенциал для роста котировок
Attractiveness
Key figures, KRW bn
| Metric | Q2 2025 | Q2 2026 | Change |
|---|---|---|---|
| Revenue | 6 311 | 9 293 | +47.2% |
| EBITDA | 775 | 1 609 | +107.8% |
| Operating profit | 861 | 1 365 | +58.5% |
| Net profit | 180 | 636 | +253.1% |
| Operating cash flow | 1 182 | 1 344 | +13.7% |
| Capex | 353 | 478 | +35.5% |
| EBITDA margin | 12.3% | 17.3% | +5.0 pp |
| Net margin | 2.9% | 6.8% | +3.9 pp |
Q2 2026 revenue grew 47.2% YoY to KRW 9,292.9 billion, accelerating after a modest +4.9% in Q1
In Q2 2026, Hanwha Aerospace's revenue reached KRW 9,292.9 billion, up 47.2% YoY. This marks a notable acceleration after Q1 2026, when growth was only +4.9% – the lowest in the past five quarters.
Quarterly dynamics show the company has returned to high growth rates after a temporary slowdown. For comparison, Q2 2025 growth was +170.3%, and Q4 2025 – +74.5%. The current growth rate remains substantial, though below last year's peak levels.
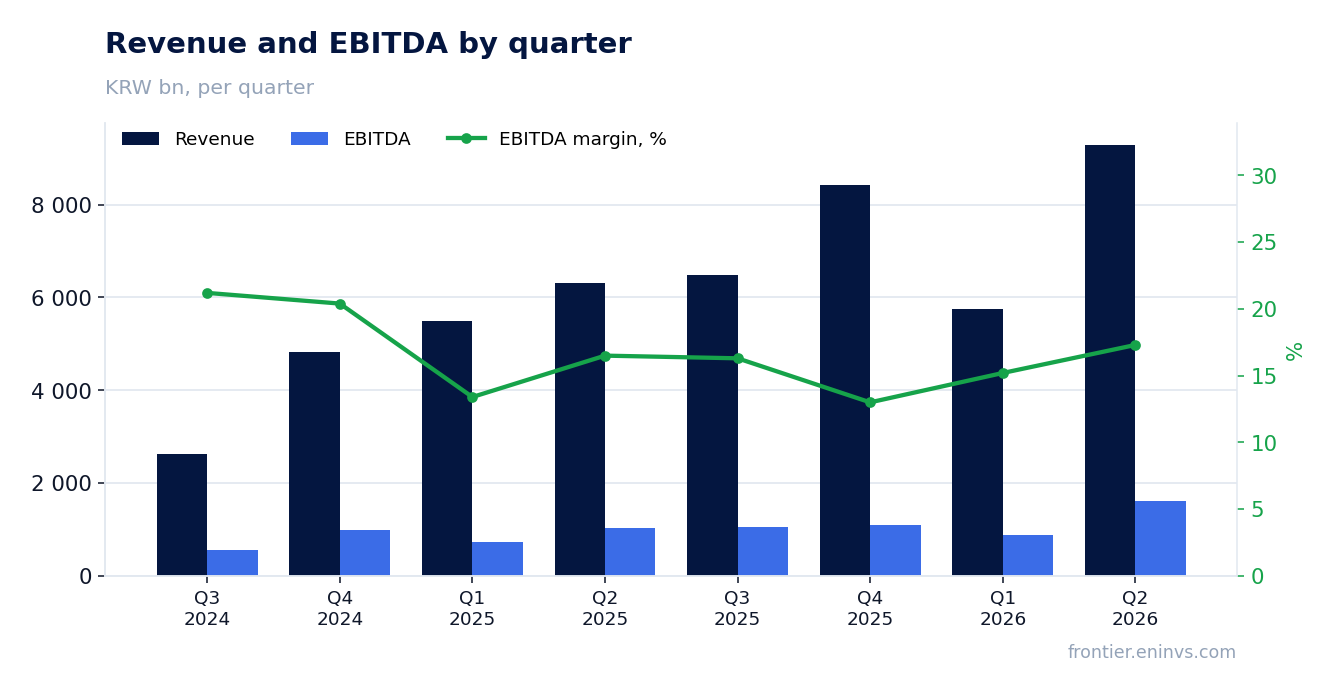
Q2 EBITDA margin reached 17.3% versus 12.3% a year earlier, helped by operating leverage
Q2 2026 EBITDA grew 107.8% YoY to KRW 1,609.5 billion, with the EBITDA margin expanding from 12.3% to 17.3%. The 5 p.p. margin expansion reflects operating leverage: with revenue up 47.2%, EBITDA grew more than twice as fast.
Such margin expansion is a positive signal, especially amid inflationary cost pressures. The company is managing to pass cost increases into prices or benefit from economies of scale.
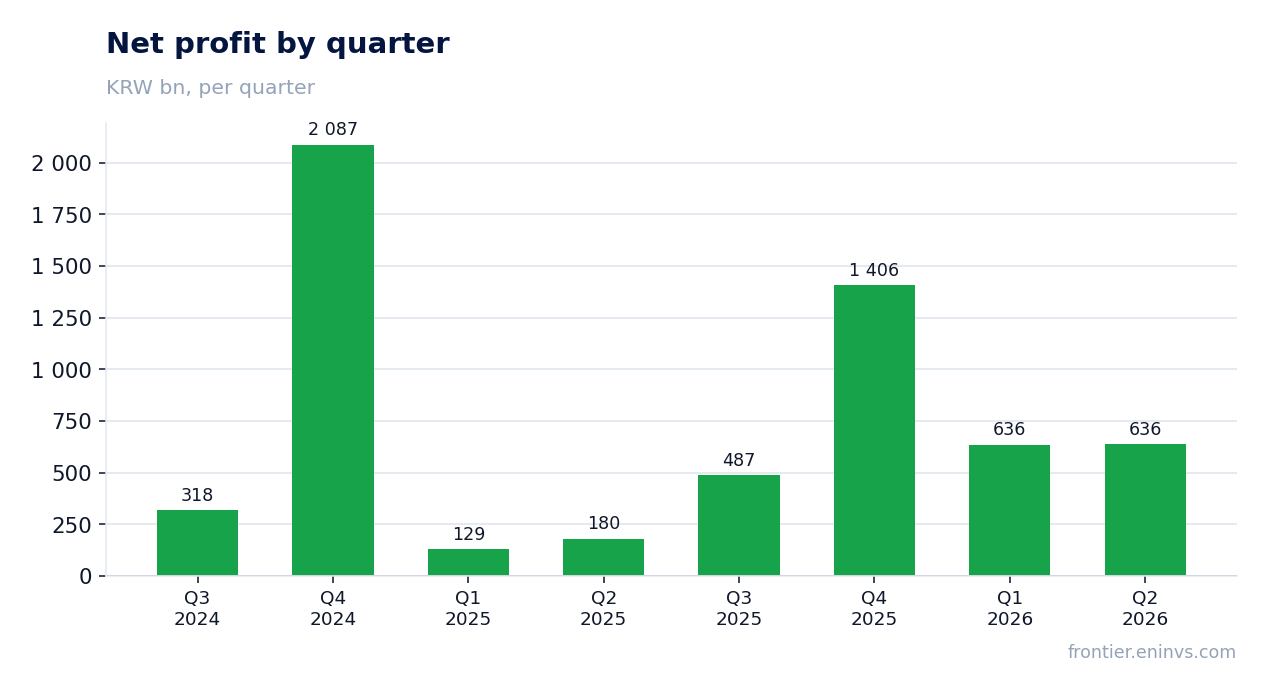
Q2 net profit grew 253.1% YoY, but Q1 2026 net profit was almost twice as high – one-offs at play
Q2 2026 net profit stood at KRW 636.4 billion, up 253.1% YoY. However, Q1 2026 net profit was KRW 635.9 billion – almost the same level, indicating stabilisation rather than explosive growth.
The annual net profit dynamics are distorted by a low base: in Q2 2025 net profit was only KRW 180.2 billion. In Q4 2025 it reached KRW 1,406.0 billion – likely due to one-off gains that are not recurring.
Operating cash flow for the last 12 months reached KRW 4,049.8 billion, but quarterly dynamics are highly volatile
Over the last 12 months (LTM), Hanwha Aerospace's operating cash flow reached KRW 4,049.8 billion. However, quarterly figures range from KRW -1,714.3 billion in Q1 2026 to +KRW 4,132.9 billion in Q4 2025.
Such volatility is typical for defence contractors with large advances and uneven contract execution. In Q2 2026, OCF was KRW 1,343.6 billion – positive, but below Q4 2025 levels.
Net debt/EBITDA stood at 1.15 at end-Q2, below the three-year average
At end-Q2 2026, net debt stood at KRW 7,853.0 billion, equivalent to 1.15 EBITDA for the last 12 months. This is a moderate level, especially for a capital-intensive defence sector.
Over the last 12 months, net debt increased by KRW 71.5 billion, but this is a small change relative to the scale of the business. The company retains financial flexibility for investments and payouts.
Trailing dividend yield is 0.67%, below the key rate, but the company retains room to grow payouts
Over the last 12 months, Hanwha Aerospace paid dividends with a yield of 0.67% at the current price. This is below the key rate, making the share unattractive for income-oriented investors.
However, with LTM net profit of KRW 2,391.3 billion and a conservative payout ratio, the company could increase dividends. The question is how much management is willing to allocate free cash flow to payouts rather than to growing defence orders.
EV/EBITDA of 13.47 is below its own three-year average of 16.13, leaving room for upside
The current EV/EBITDA multiple is 13.47 versus the three-year average of 16.13. This means the share trades at a discount of roughly 16% to its own history.
The portal's model estimates upside to fair value at +8%. Combined with accelerating revenue growth and margin expansion, this makes the share rather attractive.
Valuation on the latest reported figures
| Metric | Value |
|---|---|
| Market cap | 54 604 bn KRW |
| P/E (LTM) | 22.8 |
| EV/EBITDA (LTM) | 13.5 |
| P/B | 3.25 |
| Net debt / EBITDA (LTM) | 1.15 |
| Operating cash flow (LTM) | 4 050 bn |
| ROE | 13.5% |
| Dividend yield (12m) | 0.7% |
| EV/EBITDA, 3-year average | 16.1 |
Bottom line
Hanwha Aerospace delivered a strong quarter: revenue accelerated to +47.2%, EBITDA margin expanded to 17.3%, and leverage remains moderate (1.15 EBITDA). However, net profit barely grew compared to Q1 2026, suggesting one-offs in prior periods. The dividend yield is low (0.67%), but there is room to grow payouts. At the current price, the share trades below its own three-year multiple, supporting a 'rather attractive' verdict.
Open the company's financial profile 012450 →
See also: market overview · valuation map · stock screeners