Micron: an 84.6% gross margin and the contracts that promise to end the cycle
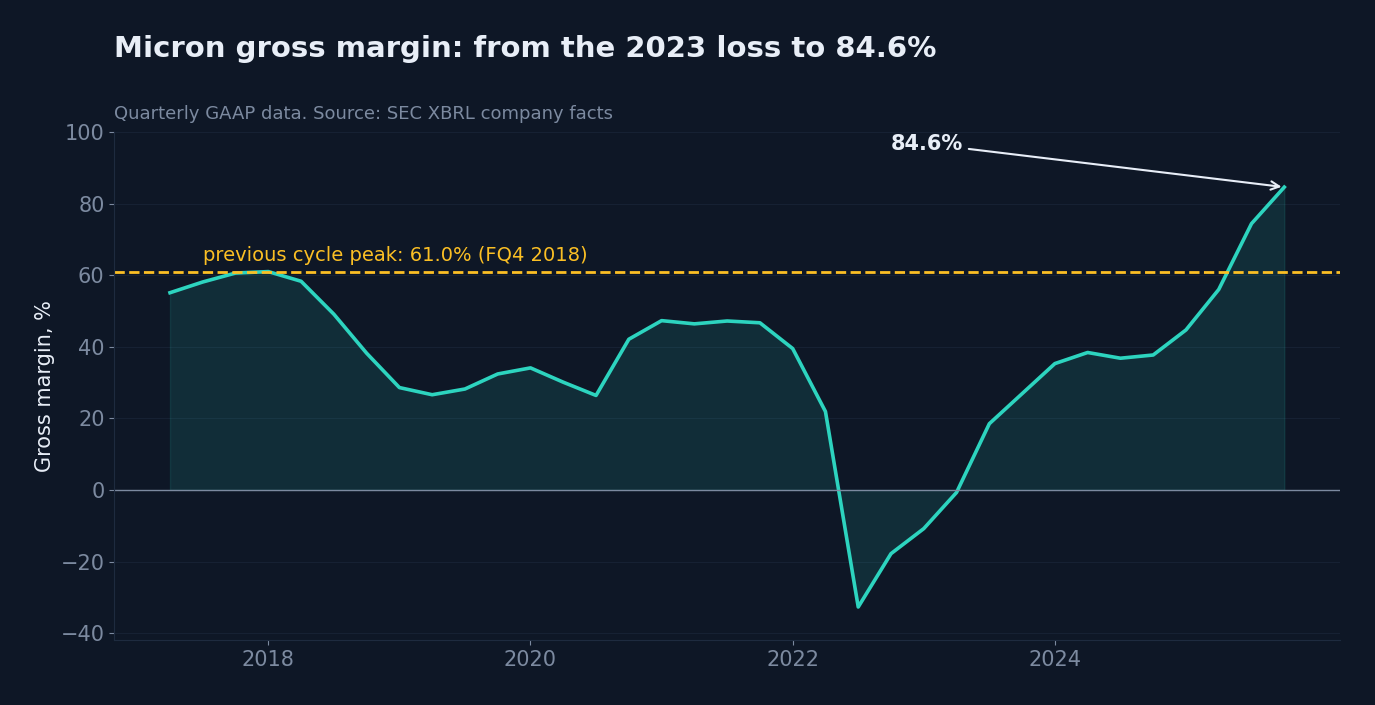
MU →A deep review of Micron Technology (Nasdaq: MU), the only American maker of DRAM and one of just three companies producing it at industrial scale anywhere. Micron has just reported a quarter with no precedent in its history: a gross margin of 84.6%, against a previous record of 61.0% set in 2018. The stock is up elevenfold in two years. What follows is what actually happened, what drove it, how durable the company's competitive position is, and what has to be true for the shares not to be a textbook trap at the top of a cycle.
The full financial history is on our company page.
Investment highlights
– A record quarter. Revenue of $41.5bn against $9.3bn a year earlier, a gross margin of 84.6% against a previous record of 61.0%, and $24.67 per share. Fourth quarter guidance is $50bn and $30.73 a share, reported on 30 September.
– Price did the work, not volume. DRAM average selling prices rose roughly 260% over the year while bit shipments rose about 20%. Since the autumn of 2024 the price index is up 3.9 times and the volume index by half.
– The shortage is structural. On TrendForce estimates DRAM supply falls 1-2% short of demand in 2026, the gap widens in 2027, and meaningful output from new industry capacity does not arrive before 2028. The DRAM market: $619bn in 2026 and $903bn in 2027.
– The business model is changing. Multi-year take-or-pay contracts with a price floor deliver, on the company's own account, a gross margin above the peak of any past cycle; $22bn of commitments are already signed, $18bn of it as cash deposits. The other side is a ceiling near the second-quarter 2026 price.
– The competitive position is uneven. In DRAM Micron is third at 24%, close behind SK hynix, but in HBM it is third at 18% against SK hynix's 50%. The main structural risk is China's CXMT: share up from 4% to 10% in a year, with the technology gap down to two or three years.
– Thirteen straight quarters ahead of its own guidance, the last five above the top of the range. The fourth-quarter outlook is probably conservative too.
– Valuation. 23 times trailing-twelve-month earnings, 14 times full fiscal 2026 and 8.3 times annualised fourth-quarter guidance. Net cash of $24bn for the first time in the company's history.
– Against its peers. Micron has the fastest growth in the group and shares the top EBITDA margin with SK hynix and TSMC, while its 17.2x multiple is half that of NVIDIA and Broadcom. The Koreans trade at 6.7-8.2x, but adjusted for country (a US median of 20.6x against Korea's 7.9x) that is 17.5-21.4x, so Micron carries no premium to its peers at all.
– Our model: a target price of $1,868 and an upside of plus 84% on a conservative memory price, today's volume and a 23.6x multiple. On a more cautious 18.7x it is $1,488 and plus 46%.
– The main risks. The contract floor protects the margin percentage, not the amount of profit: back at a 70% margin the multiple becomes 26. And our cycle indicator is at its maximum, after which twelve-month returns have historically been weak.
A quarter without precedent
Micron's third fiscal quarter of 2026 ended on 28 May. Revenue came in at $41.5bn against $9.3bn a year earlier, a 4.5-fold increase. Gross profit was $35.1bn, operating profit $33.3bn (80.4% of revenue) and net profit $28.2bn, or $24.67 per diluted share versus $1.68 a year ago.
For the first nine months of the year revenue reached $79.0bn and net profit $47.3bn.
Guidance for the fourth quarter, which closed at the end of August: revenue of $50bn plus or minus $1bn, gross margin around 86%, earnings of $30.73 per share. The report lands on 30 September. That is the nearest point at which every assumption in this review gets tested.
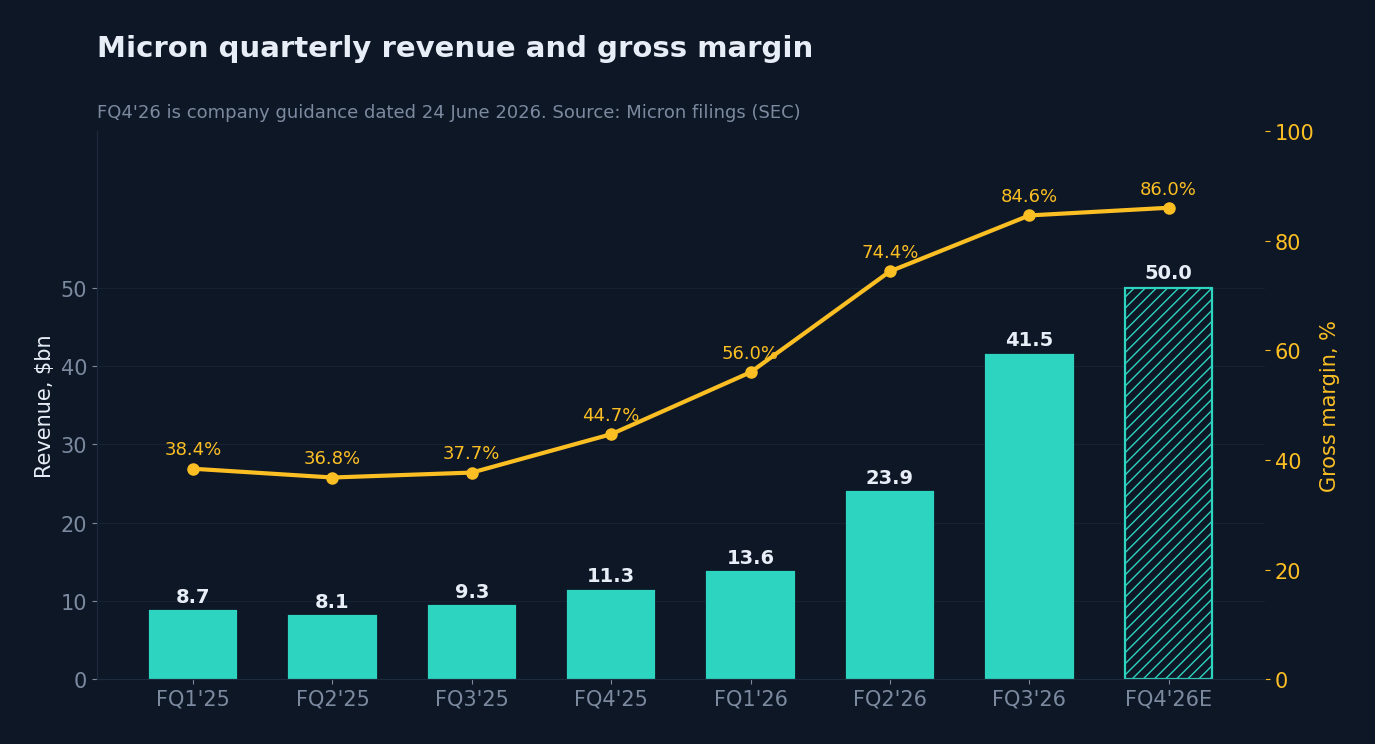
For scale. Gross margin is the share of revenue left after the direct cost of production. For a memory chipmaker it has historically swung from minus 30% at the bottom of a cycle to 55-60% at the top. Micron has visited both edges in three years.
All of the growth came from price, not from volume
This is the single most important observation in the report, and the company does not hide it. The 10-Q breaks down where the year-on-year sales growth came from:
– DRAM (the main memory that accounts for the bulk of the business) - revenue up 343%, of which average selling prices up roughly 260% while bit shipments rose only about 20%
– NAND (flash memory used in storage) - revenue up 361%, with prices up around 310% and volumes up by a low double-digit percentage.
Cost of goods sold rose from $5.8bn to $6.4bn over the year, or 10%, while revenue multiplied by 4.5. Micron is selling roughly the same bits it sold a year ago, at 3.5 times the price. That is where the 84.6% comes from: every increment of price drops into gross profit whole.
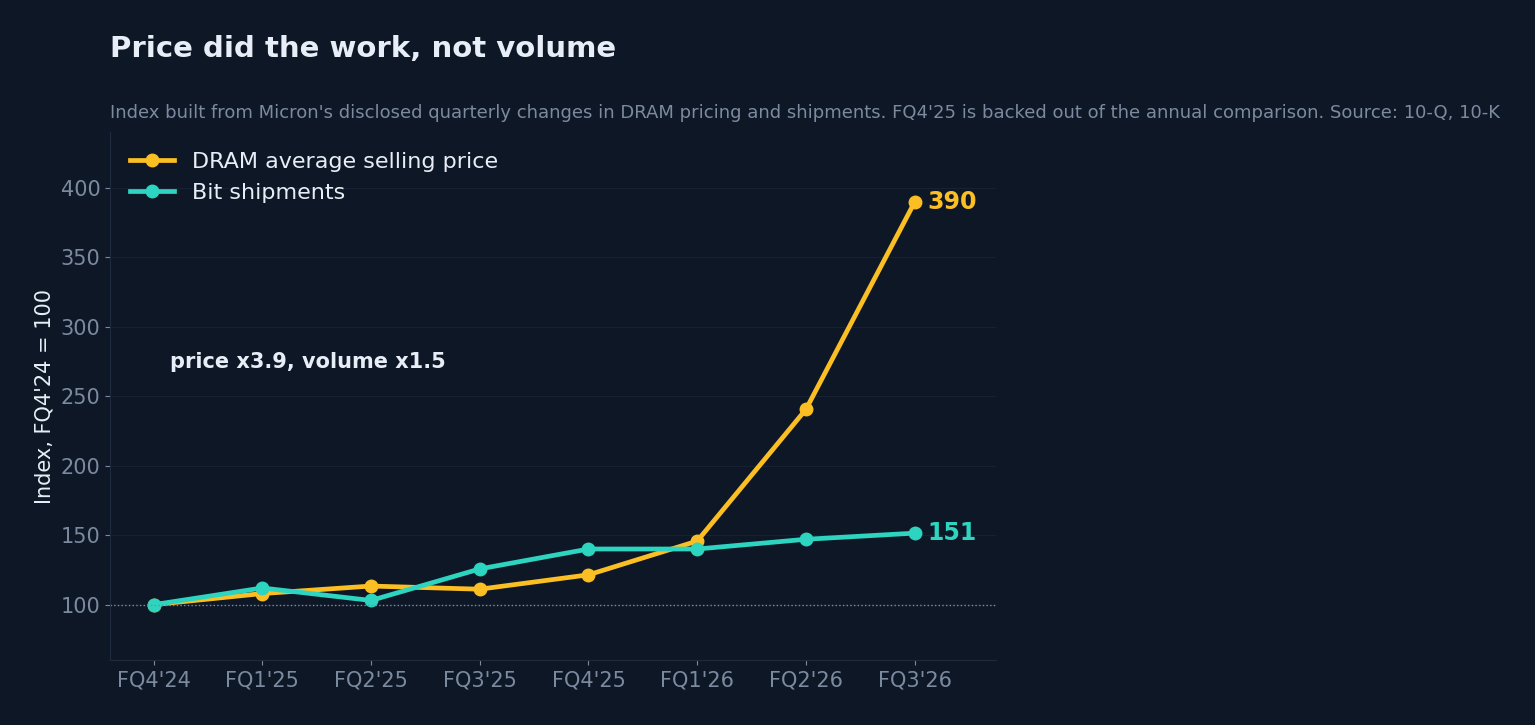
The same arithmetic in levels rather than percentages. Micron discloses the change in pricing and shipments in every quarterly filing; chained into an index, those disclosures show that since the autumn of 2024 the DRAM average selling price has risen 3.9 times while bit shipments have risen by half. Essentially all of the revenue growth is the upper line on the chart.
Industry prices tell the same story. On TrendForce estimates, conventional DRAM contract prices rose 45-50% in the fourth quarter of 2025, 93-98% in the first quarter of 2026 and 58-63% in the second. On the spot market on 7 September 2026 a DDR5 16Gb die was $54.3 and a DDR4 16Gb die $93.3; over the year, on the DRAMeXchange spot board, they are up roughly 480% and 690% respectively.
One detail deserves its own sentence: legacy DDR4 now costs almost twice as much as newer DDR5. Manufacturers are winding down older memory types and converting lines to DDR5 and HBM, while the equipment that takes DDR4 has not gone anywhere. It is hard to think of a starker illustration of the shortage.
The practical conclusion. This is not a story about operational improvement or a new product that displaced competitors. It is a price shock in an industry where Micron happens to be one of three recipients of the rent. So the thing to assess is not execution quality but the durability of the shortage itself.
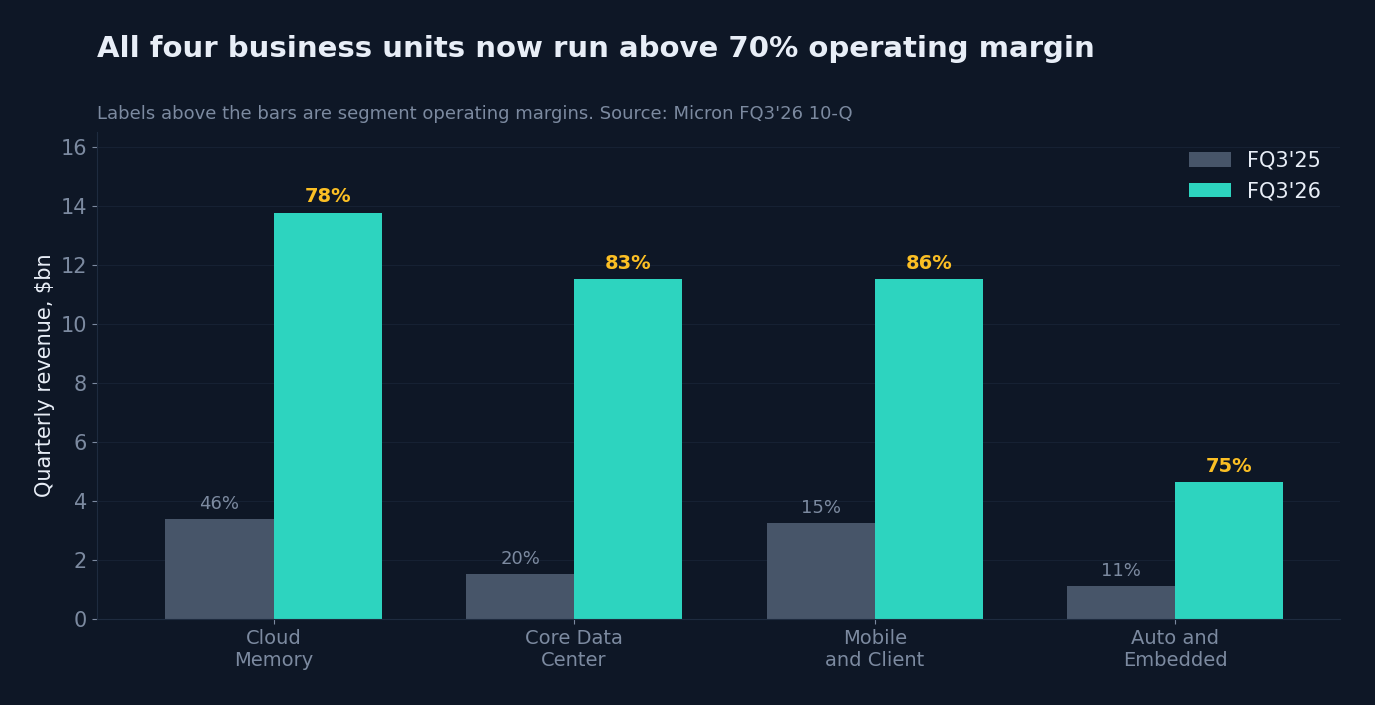
The breadth of the move shows up in the segments. All four business units now run operating margins above 75%, including automotive and embedded, which has nothing to do with artificial intelligence. When server memory and memory for household appliances earn equally well, that is a sign of shortage, not of product advantage.
The shortage is real, and there is no quick fix
An independent read on the industry from research house TrendForce (July-August 2026): the DRAM sufficiency ratio, which measures how far supply covers demand, stands at minus 1-2% in 2026, and the gap is expected to widen in 2027. The DRAM market is put at $618.7bn in 2026, a fourfold increase, and $903.3bn in 2027, up 46%. The whole memory market is forecast to exceed $1.28tn in 2027.
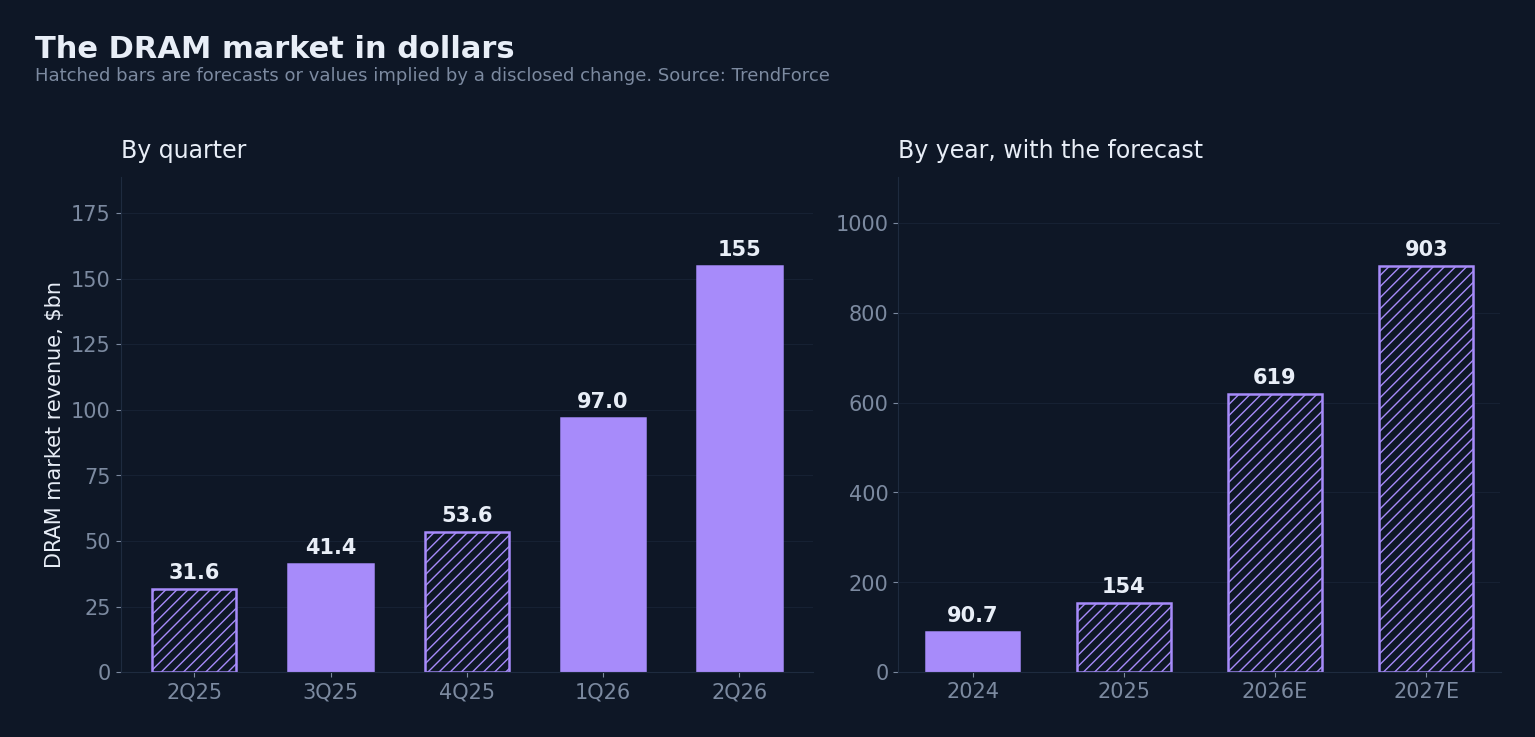
In money the picture looks like this. Quarterly revenue for the whole DRAM industry: $41.4bn in the third quarter of 2025, $97.0bn in the first quarter of 2026 and $154.7bn in the second - up 3.7 times in three quarters. By year: $90.7bn in 2024, around $154bn in 2025, a forecast $618.7bn for 2026 and $903.3bn for 2027. On TrendForce's numbers the DRAM market will therefore be roughly ten times its 2024 size within three years.
The flash forecast is more modest: $270.6bn in 2026 and $379.4bn in 2027. Together those give the $889bn memory market of 2026 and the $1.28tn-plus of 2027.
The reason the shortage cannot clear inside a year is arithmetic. HBM is high-bandwidth memory, the kind stacked next to AI accelerators. In 2026 it will account for only 9% of DRAM bits but consume 22% of the industry's silicon wafers; by the end of 2027 that becomes 13% of bits and 30% of wafers. HBM is assembled in multi-layer stacks, and each usable bit takes several times more silicon area than a conventional memory module. Every HBM bit a manufacturer sells is subtracted from the supply of ordinary memory. That is why prices have risen for server and consumer modules that have no direct connection to AI at all.
New plants do not help inside the forecast horizon: on TrendForce's estimate, meaningful output from new capacity will not arrive before 2028. Micron's own record shows the timescale. Ground was broken on the Boise, Idaho fab in September 2022, construction started in October 2023, and the first DRAM wafers are expected in mid-2027. Five years from shovel to product.
The real news is not the margin, it is the contracts with a price floor
In the third and fourth quarters Micron began signing what it calls strategic customer agreements. The terms are set out in the 10-Q, and they change the shape of the business more than the record margin does:
– they are take-or-pay, meaning the customer either lifts the agreed volume or pays for it anyway; volume commitments are locked in for several years
– for most agreements the price is either fixed or bounded by a floor and a ceiling
– for the largest agreements the ceiling approximates the market price of the second calendar quarter of 2026, and the floor holds for the whole term
– in the company's own words, gross margins under these contracts even at floor pricing will run well above the peak quarterly margin of any past cycle, which is to say above 61%
– a minority of the agreements carry no price bands and follow the market
– Micron expects $22bn of deposits and related financial commitments from agreements concluded so far, of which roughly $18bn arrives as cash.
What this means in substance. A memory maker has always traded cheaply on peak earnings precisely because peak earnings said nothing about next year. If the contracts work as described, a significant part of revenue for several years stops being a function of the spot price and starts to resemble contracted revenue with a guaranteed minimum margin. The $18bn of deposits also amounts to free financing for the build-out: customers are prepaying for the very capacity they have signed up for.
The other side sits in the same paragraph. A ceiling near the second-quarter 2026 level means further increases in spot prices will largely bypass Micron. The company has traded the upper tail of the distribution for the lower one.
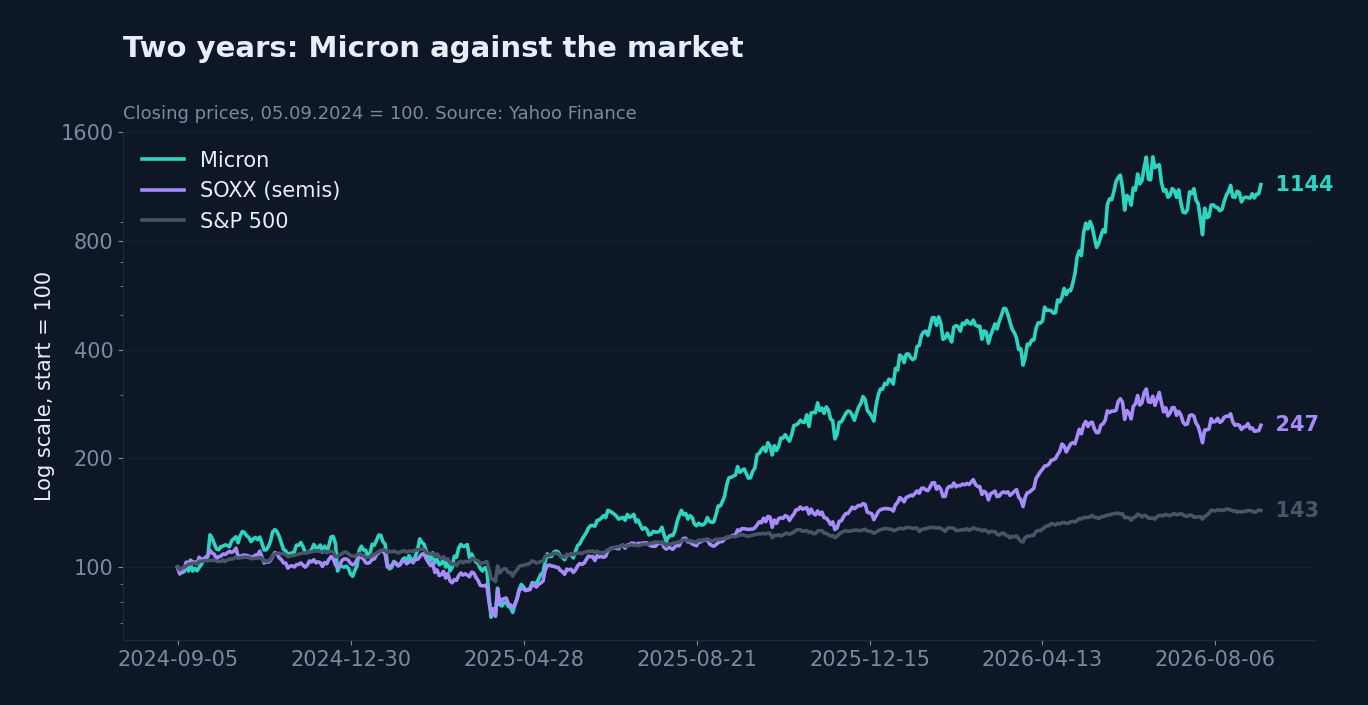
That is the most plausible explanation for the share price. From a high of $1,213 on 25 June the stock has drifted back to $1,017, down 16%, even though the reported numbers have only improved since. The market has worked out that the option on higher prices is now closed.
Strong in DRAM, a distant third in HBM
Two markets are often conflated here and need separating. Conventional DRAM is a three-way oligopoly in which Micron is firmly established. HBM is a narrower and far more profitable segment, and the line-up there is different.
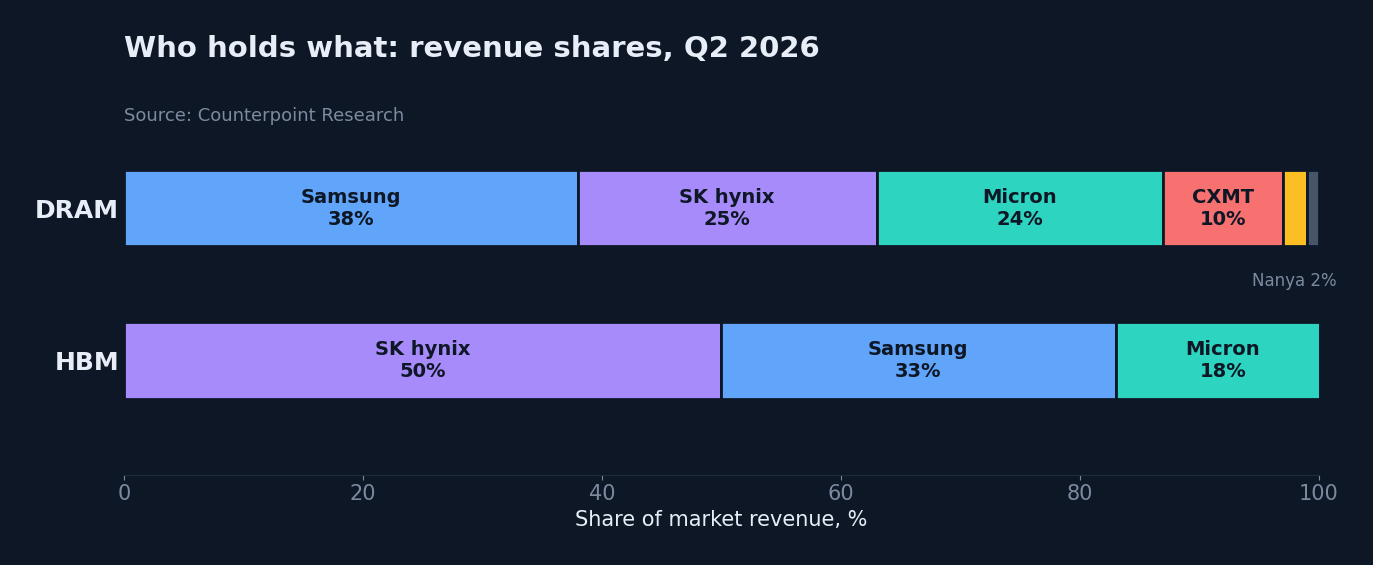
On Counterpoint Research data for the second quarter of 2026, in DRAM Samsung holds 38%, SK hynix 25% and Micron 24%, with China's CXMT at 10% and Taiwan's Nanya at 2%. Micron sits third, close behind SK hynix, and Counterpoint notes separately that Micron's DRAM revenue has risen fivefold in a year and that the company could take second place.
In HBM the picture is worse: SK hynix 50%, Samsung 33%, Micron 18%. SK hynix has lost 14 percentage points in that segment over the year, down from 64%, and Samsung was first into volume production of HBM4 in February 2026. In the most valuable part of the market Micron is the one catching up, and the competition there is real rather than nominal.
What is genuinely solid:
– Technology. HBM4 on the 1-beta process is already shipping in volume to the lead customer, with qualification samples out to several end customers; HBM4E on the next 1-gamma process is scheduled for volume production in 2027. Alongside that: 256GB DDR5 modules, LP5X SOCAMM2 in high-volume production, PCIe Gen6 drives and a 245TB SSD.
– The barrier to entry is money and time. Five years from groundbreaking to first wafer, and $27bn of capital expenditure in fiscal 2026 alone. That explains why the three incumbents are in no hurry to fight for share: Micron states plainly in its filing that its objective is to maintain stable bit share, not to grow it.
– Less dependence on a single buyer. The largest customer accounted for 10% of revenue in the first nine months of 2026, down from 16% a year earlier.
– Government support. Up to $6.4bn in grants under the US CHIPS Act, a 35% investment tax credit on US manufacturing investment, and a non-binding term sheet with New York State worth up to $5.5bn. In a world where memory has become a strategic commodity, the only American DRAM producer gets an extra layer of protection.
What could break the story
China. The main threat to the structure of the market is CXMT. On Counterpoint data its share of DRAM revenue has gone from 4% to 10% in a year, with revenue up 716%, and for the first time the combined share of the top three has fallen below 90%. The technology gap, once put at five years or more, has narrowed to two or three. In July 2026 the company raised $8.6bn in an IPO and is weighing a sixth fab; capacity of roughly 300,000 wafers a month is planned to reach 550,000-600,000 by 2028, comparable to SK hynix. For reference, Micron's own capacity at the end of 2026 is estimated at around 385,000 wafers a month (SemiAnalysis). CXMT plans volume production of HBM3E as soon as this year.
NAND is diverging from DRAM. TrendForce expects flash supply to turn loose in the second half of 2027 as new capacity comes online while consumer electronics demand stays weak. Micron's NAND prices are up 310% over the year, and that is the part of the business where the turn arrives first.
Micron's own capacity wave. The company is simultaneously building a second Idaho fab (output late 2028), a site in Clay, New York (supply from 2030), HBM packaging in Singapore from the first half of 2027 plus an additional fab in the second half of 2028, and in Taiwan the Tongluo fab bought from Powerchip for $1.8bn with shipments from mid-2027. The competitors are doing the same. Discipline in the memory industry has always held right up to the point where everyone starts building at once.
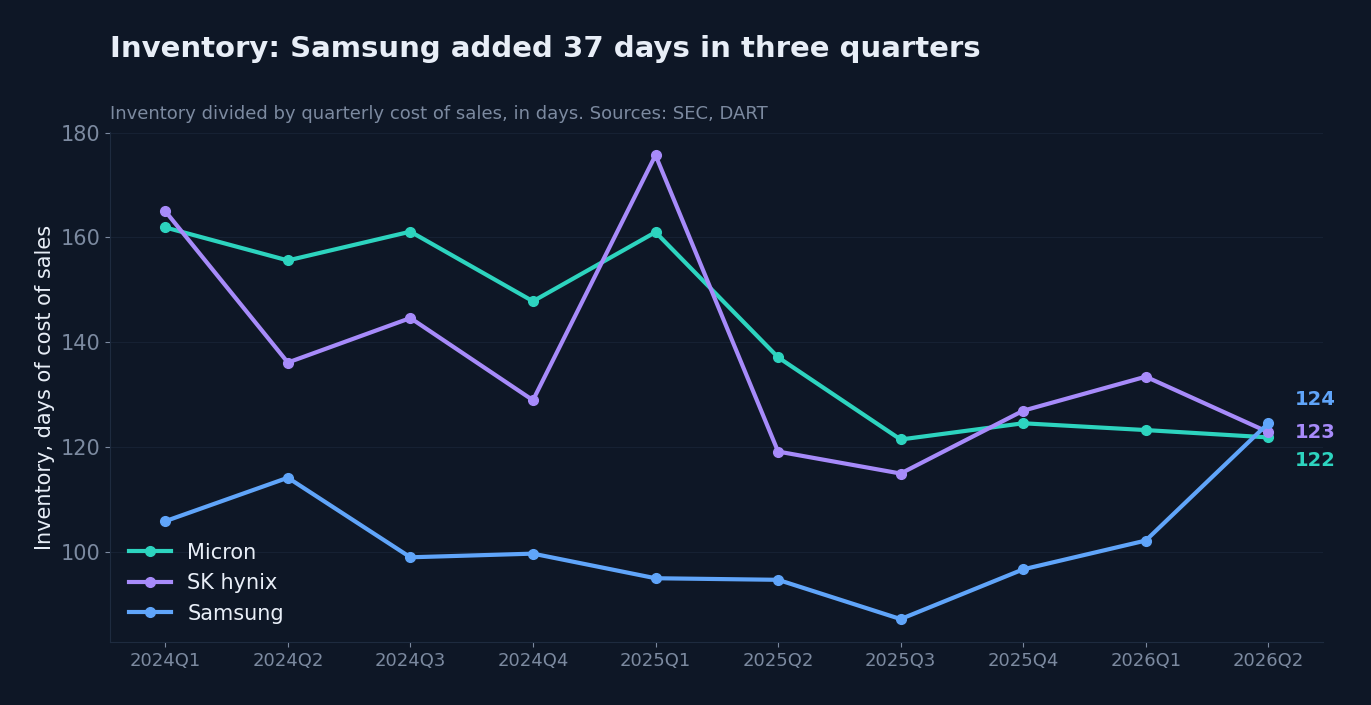
A competitor's inventory. Samsung's inventory has risen from 87 to 124 days of cost of sales in three quarters. Micron and SK hynix are stable around 122-123 days. On its own this is not a signal that the cycle has turned, since Samsung may be building for contracted shipments. But it is usually the first metric to break before prices do.
Tax. The effective rate has risen from 11.1% to 15.0% because of the Pillar Two global minimum, which in Singapore has offset the incentives Micron used to enjoy.
Our cycle indicator is pinned at its maximum, which historically is a bad sign a year out
We maintain our own composite indicator of the memory cycle. It pulls in monthly revenue from Taiwan's Nanya and Winbond, DRAM spot prices, and the trend in margins, inventory and capital spending at Micron and SK hynix; each component scores plus one, zero or minus one. The composite currently reads plus 5 out of 5 active signals, the maximum. Nanya's three-month revenue is up 50% on the prior three months and sevenfold year on year, Micron's margin gained 10 percentage points in a quarter, capex to revenue sits below its three-year median, and SK hynix's inventory days fell by 11.
A backtest over 2006-2026 produces an uncomfortable result. With a positive composite, the following six months are genuinely better than average for Micron shares: a median of plus 11.6% against plus 5.3% after negative readings. But over twelve months the sign flips: a median of plus 3.8% after strong readings against plus 18.7% after weak ones.
Put plainly, strong fundamental readings confirm a turn that has already happened rather than predict the next one. A maximum composite describes the present; it is not a forecast.
Thirteen straight quarters ahead of its own guidance
Micron publishes an outlook for the next quarter in every release: revenue, gross margin and earnings per share. The following release states the actual. Checked across thirteen consecutive quarters the record has no exceptions: revenue has never come in below the midpoint of the guided range.
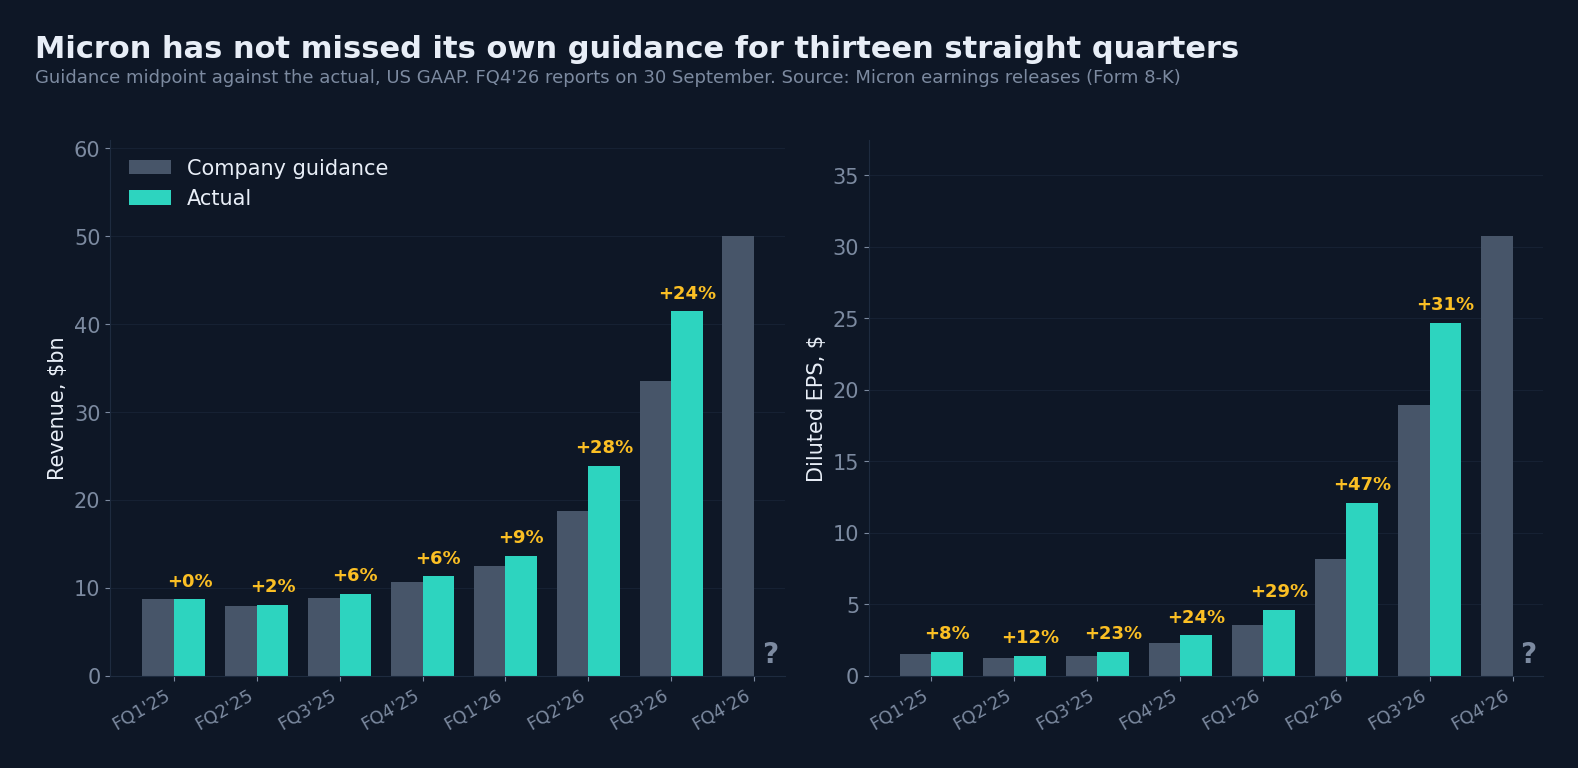
What matters more is how the size of the beat has changed. On revenue: plus 0.1% in the first quarter of fiscal 2025, plus 5.7% six months later, plus 9.1% in the first quarter of 2026, then plus 27.6% and plus 23.8% in the last two. On earnings per share the gap is wider still: plus 8% at the start of the run against plus 47% and plus 31% in the last two quarters. In each of the last five quarters the actual came in above not just the midpoint but the top of the guided range.
The mechanism is obvious, and it is also what limits the conclusion. Micron builds its outlook on the prices it can see when it reports, and in a shortage prices keep rising inside the quarter. This is not management being cautious, it is a market moving faster than anyone can forecast it. The same mechanism runs in reverse: at the turn of the cycle guidance will be systematically too high.
Two conclusions follow. First, the fourth-quarter guidance of $50bn and $30.73 a share is probably conservative. If the gap of the last two quarters repeats, 30 September brings revenue near $60bn and earnings around $40 a share, which is about 6.5 times earnings at the current price rather than 8.3.
The second conclusion is the cautious one, and it follows from the same contracts. Agreements with a price ceiling are precisely what should narrow this gap: if a large share of volume sells at a pre-agreed price, spot increases inside the quarter stop showing up in the result. Micron says explicitly that the contracts give it better visibility. Better visibility also means beats of this size are over.
Valuation: 8 or 23 times earnings, and the gap rests on a single assumption
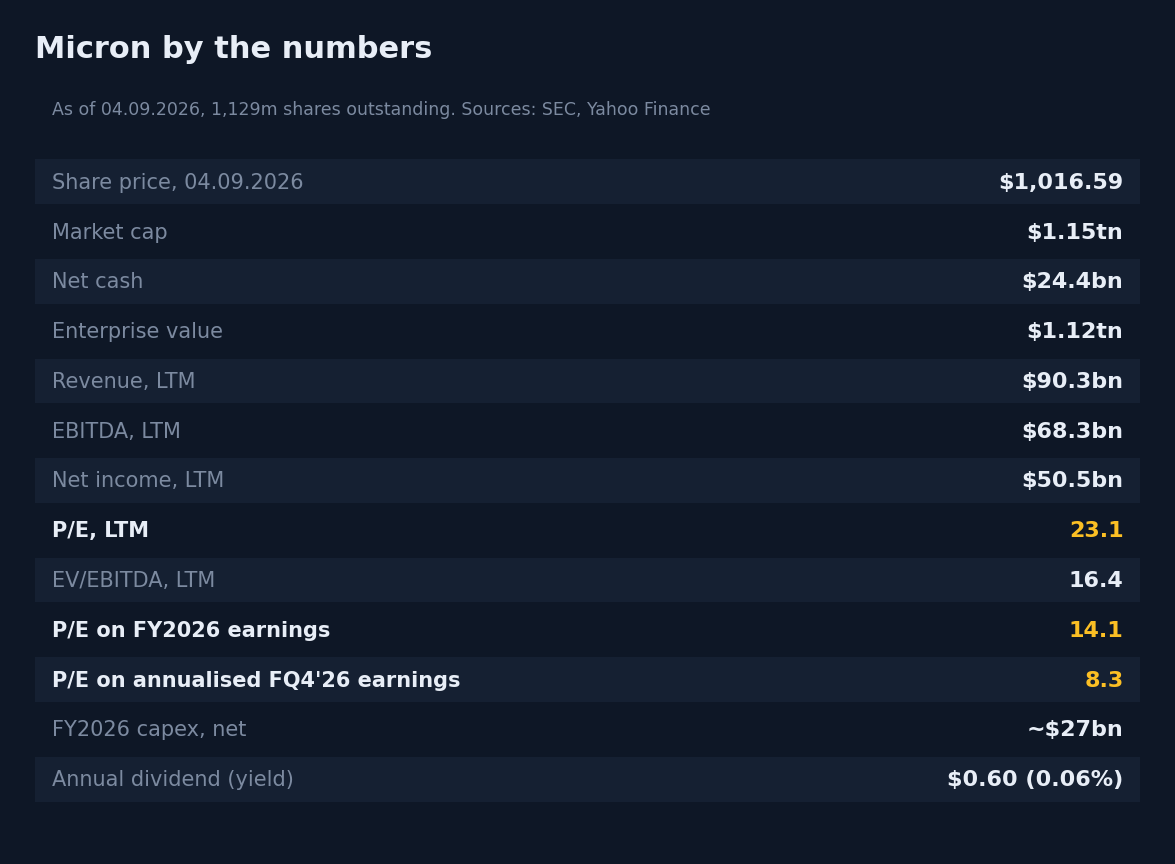
At $1,016.59 a share Micron is capitalised at roughly $1.15tn. For the first time in its history the company holds a net cash position: $30.1bn of cash and investments against $5.7bn of debt, cut from $14.6bn over nine months. Enterprise value is about $1.12tn.
From there everything depends on which earnings you treat as normal:
– on the last twelve months of profit ($50.5bn) the stock trades at 23.1 times earnings and 16.4 times EBITDA; adjusting for stock-based compensation ($954m over nine months), EV/EBITDAC is about 16.8
– on full fiscal 2026 earnings including fourth-quarter guidance ($72.13 per share) the multiple is 14.1
– on annualised fourth-quarter guided earnings it is 8.3 times, with EV/EBITDA on the annualised latest reported quarter at about 7.9.
Twenty-three times earnings is expensive for a cyclical company. Eight is cheap even for a stable one. The distance between those two numbers is the whole argument about Micron.
And this is where most write-ups fall into a trap. The contract floor protects the margin percentage, not the amount of profit. A margin is a ratio. If the price falls to the lower band, revenue falls with it while the cost of producing the same volume stays where it is. Working from the latest quarter, where cost of goods sold was $6.4bn:
– at today's 84.6% margin, gross profit is $35.1bn a quarter, which is about ten times earnings at the current share price
– at a 75% margin, revenue on the same volume falls to $25.6bn and gross profit to $19.2bn, and the multiple rises to roughly 20
– at 70%: $21.3bn of revenue, $14.9bn of gross profit, about 26 times earnings
– at 61%, the previous peak of the cycle: $16.4bn of revenue, $10.0bn of gross profit and more than 40 times earnings.
Only volume growth softens that arithmetic. At $27bn of capital spending a year, shipments by 2028 could be 50-60% above today's, which would put the same scenarios at roughly 12 to 25 times earnings instead of 20 to 42. The conclusion holds either way: 8.3 is a multiple on peak pricing, and the floor limits how far profit falls rather than holding it where it is.
So the argument about Micron is not whether the margin stays above 60%. It is two other questions: how high the floor sits in absolute prices, and how much volume it covers. The company has disclosed neither.
Capital returned to shareholders is meanwhile token. The dividend is $0.15 a quarter, a yield of 0.06%, and $7.84bn of the authorised $10bn buyback has been used over the life of the programme. The money is going into construction: $27bn of capex in fiscal 2026. An investor in Micron is paying not for distributions but for a claim on future capacity.
Against its peers: the fastest growth, cheaper than the AI names
Micron sits usefully against three groups at once: the other memory makers, the foundries, and the designers of AI silicon. Growth below is the latest reported quarter year on year; margin and multiple are trailing twelve months, so both sides of EV/EBITDA use the same window.
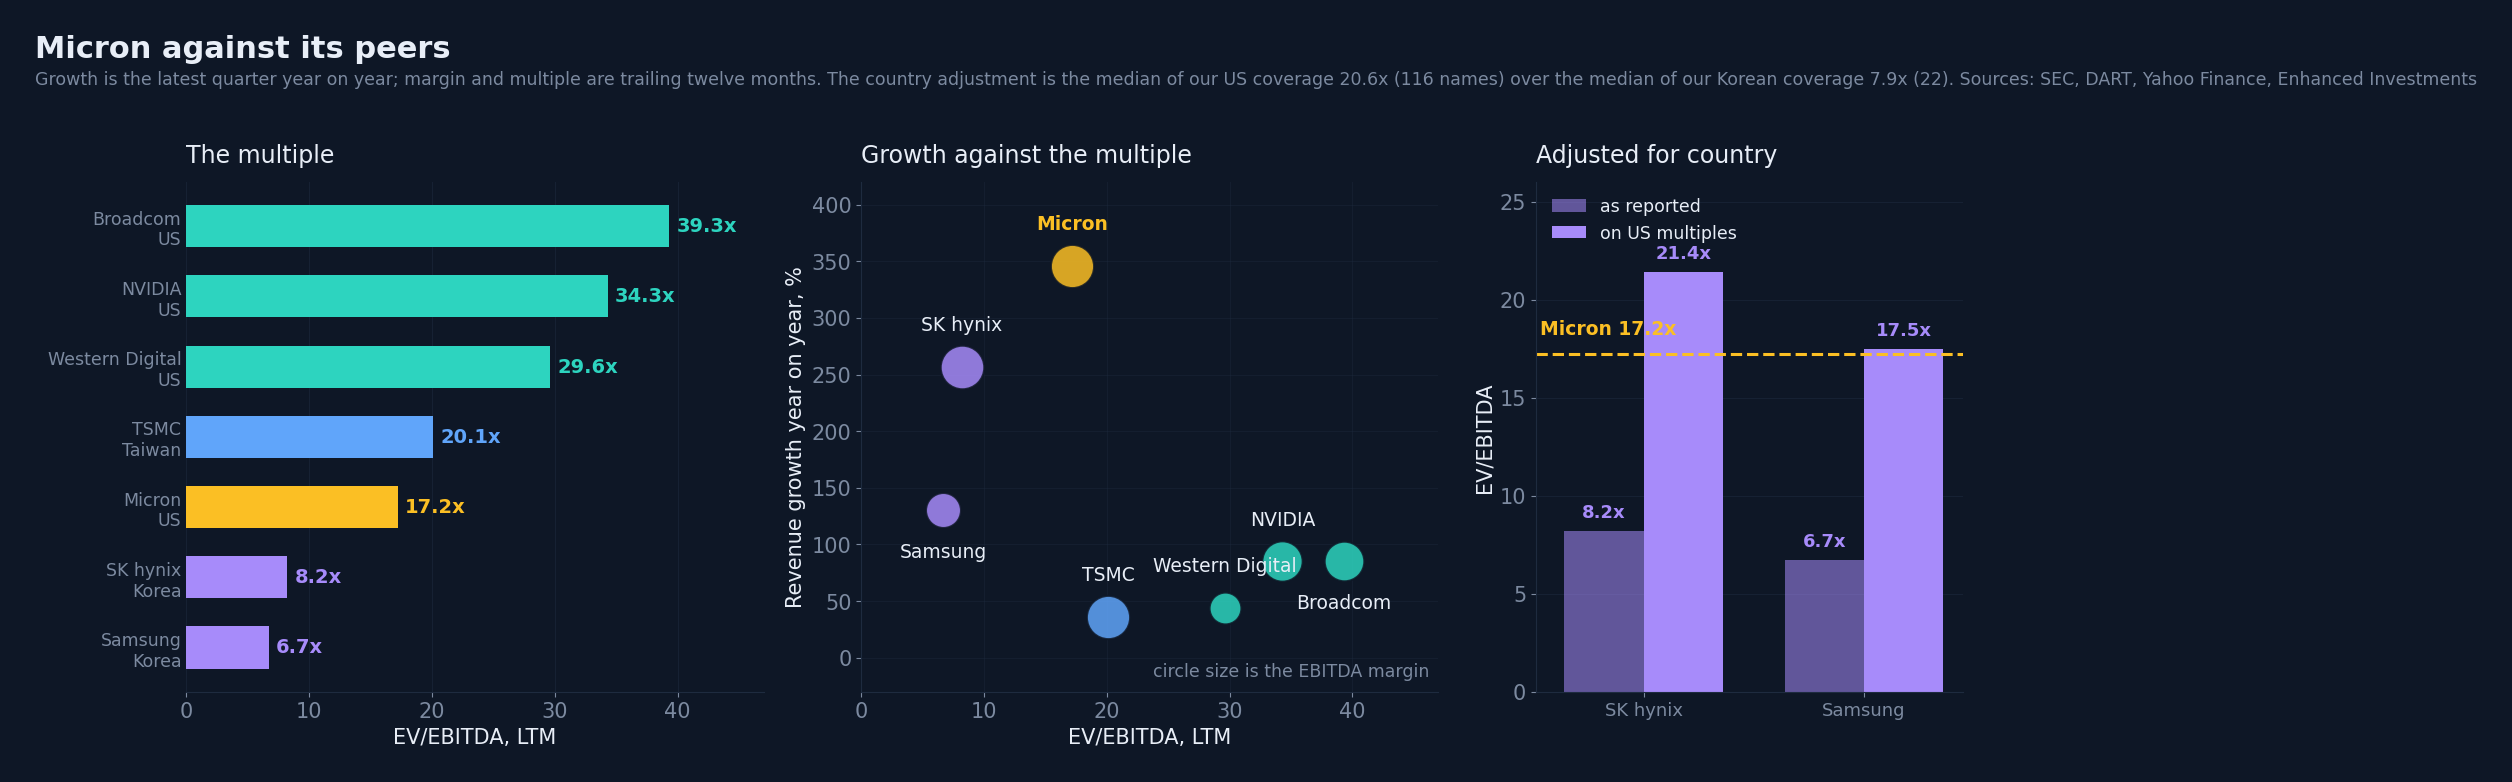
– Micron, US - $90bn of revenue over the year, growth of plus 346%, an EBITDA margin of 76%, EV/EBITDA 17.2x
– SK hynix, Korea - $140bn, plus 257%, margin 77%, 8.2x
– Samsung, Korea - $360bn, plus 130%, margin 48%, 6.7x
– NVIDIA, US - $253bn, plus 85%, margin 65%, 34.3x
– Broadcom, US - $89bn, plus 85%, margin 63%, 39.3x
– Western Digital, US - $13bn, plus 44%, margin 39%, 29.6x
– TSMC, Taiwan - $141bn, plus 36%, margin 76%, 20.1x.
The first thing that stands out: Micron has the fastest growth in the entire group and shares the top EBITDA margin with SK hynix and TSMC. Yet its multiple is half that of NVIDIA and Broadcom, and below TSMC's, a company growing ten times more slowly.
The second stands out even more. The Korean memory makers, on almost identical economics, trade at 6.7 and 8.2 times EBITDA, two to three times cheaper than Micron. SK hynix has the higher margin of the two and grows only slightly more slowly. On the face of it Micron carries a large premium to its closest peers.
But this is where the country of listing enters, and it is worth measuring rather than merely mentioning. Across our own coverage, on identical method, the median EV/EBITDA of 116 US companies is 20.6x and of 22 Korean companies 7.9x, a gap of 2.6 times - and that is about the market, not about memory.
Lift the Koreans onto US multiples and the picture inverts: SK hynix would trade at 21.4 times EBITDA, Samsung at 17.5, and Micron trades at 17.2. There is no premium to its closest peers at all; Micron is marginally cheaper, and the visible gap is the Korean discount. TSMC corroborates it from the other side: a Taiwanese company listed in the US through depositary receipts, trading at 20.1x, right on the US median.
Which leads into the next section. The argument about Micron's multiple is an argument about which group it belongs to: NVIDIA and Broadcom at 34-39x, or the country-adjusted Koreans at 17-21x. The case for the first is the HBM share and the data-centre contracts; for the second, the same cyclicality and essentially the same commodity. Either way the 23.6x we take as the target sits inside the range rather than above it.
Our model puts Micron at plus 84%
Economically Micron is a producer of a commodity with an exchange-quoted price, so it is worth running it through the same model we use for commodity producers. Three steps. First, take the latest reported quarter annualised, which is today's actual volume and cost, and reprice the revenue as if the price stood at a normalised level. Second, the conservative price is the midpoint between today's and the three-year average, and by the rule of the model conservative EBITDA can never exceed EBITDA at today's price. Third, multiply by the company's own historical EV/EBITDA, add net cash and compare with the market capitalisation.
The price input is our DRAM index built from Micron's disclosures, extended three years back. Today's level is 658 and the three-year average is 226, which is only 34% of the current price. The conservative case takes the midpoint, 442, implying a price decline of a third from here.
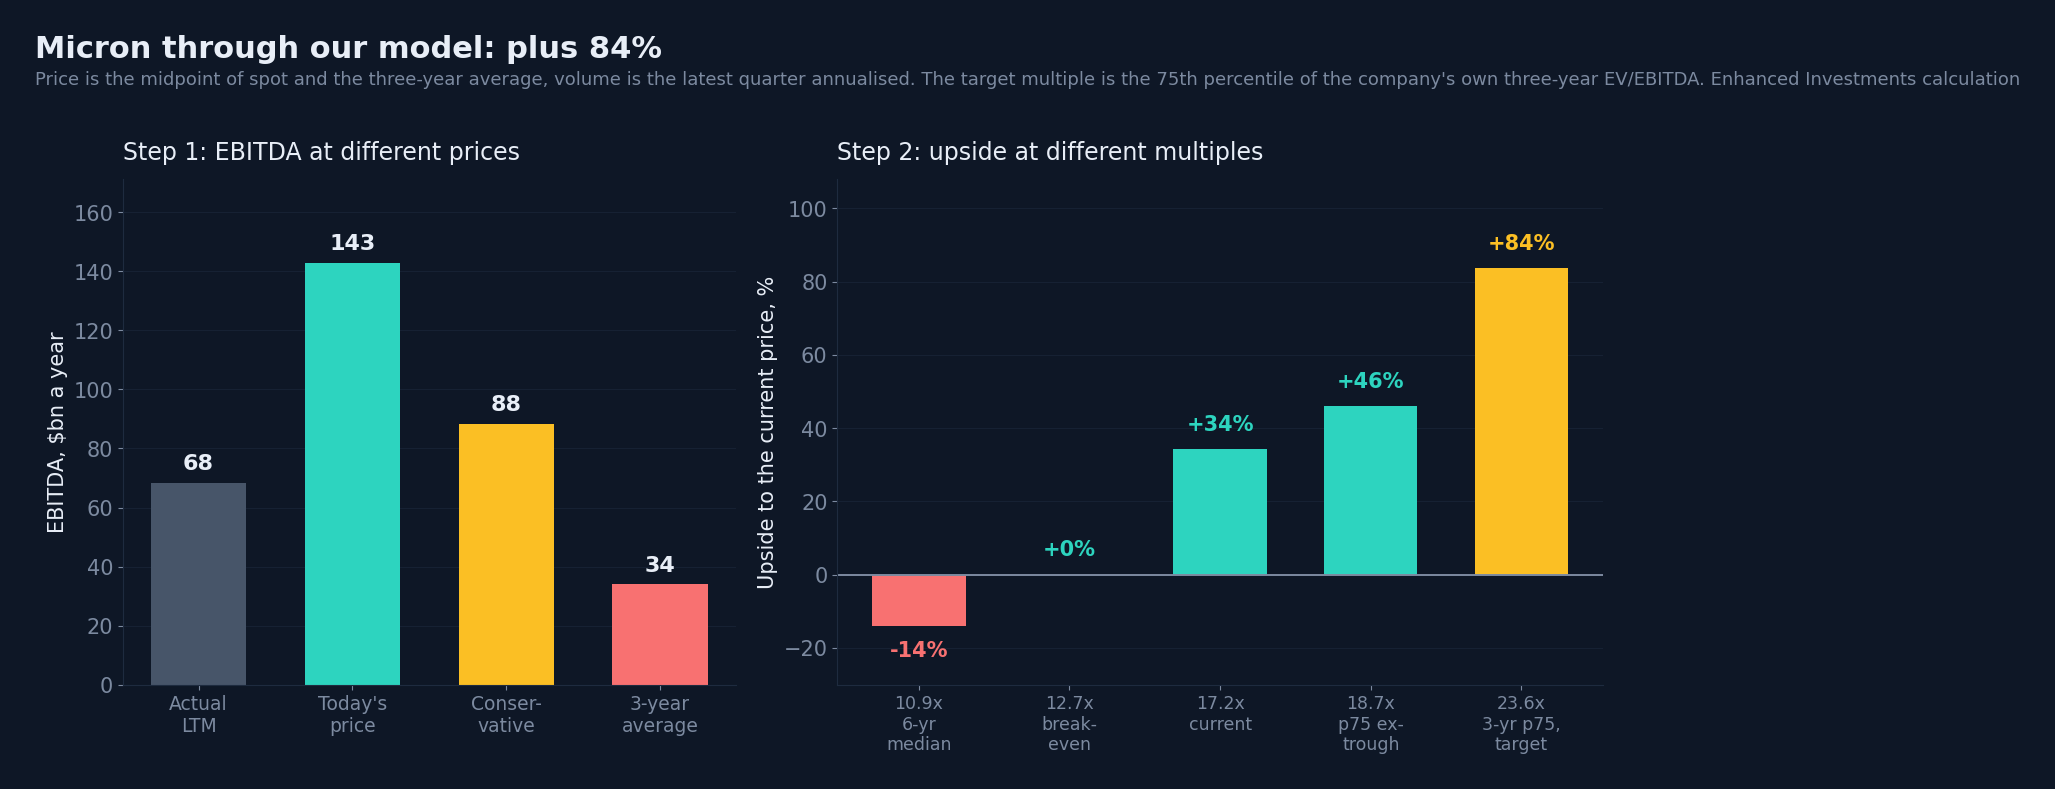
Annualised EBITDA comes out as follows: $143bn at today's price, only $34bn at the three-year average, and $88bn on the conservative basis. Actual EBITDA over the last twelve months was $68bn, because three of those four quarters ran at both lower prices and lower volumes.
Then the multiple. The target is the 75th percentile of Micron's own EV/EBITDA over three years, 23.6x - what the market itself has paid for this company in the upper part of its range over that period. It trades at 17.2x today.
That figure carries a distortion worth naming up front. Of the roughly 250 days on which the multiple stood at 23.6x or above, about 80% fall between September 2023 and July 2024, when the company was only emerging from a loss and the denominator was tiny: monthly medians in that stretch reached 40-80x. In every window that excludes that tail the percentile settles at around 18-19x: 18.7x over three years ex-trough, 19.1x over the last twelve months, 18.2x over two years and 18.1x over six.
The result: $88bn of EBITDA at 23.6x gives a target enterprise value of $2.08tn, plus $24bn of net cash, so $2.11tn against a $1.15tn market cap. A target price of $1,868 a share against today's $1,017, an upside of plus 84%. On the more cautious 18.7x it is $1,488 and plus 46%.
It is worth looking from the other side too. To justify today's price the market only has to pay 12.7 times normalised EBITDA. That is below the company's current 17.2x and below every percentile listed above, though still above its six-year median of 10.9x.
Three caveats, without which the number misleads. First, the three-year window contains the deepest trough in the industry's history - in 2023 Micron ran a negative gross margin, which drags the normalised price down further than an ordinary cycle deserves. Second, the model holds volume and cost at today's level while the company is building $27bn of capacity a year, so shipments in 2028 will be materially higher. Third, and most important: take-or-pay contracts with a price floor are precisely the argument that the price will not revert to the three-year average.
The main conclusion here deserves to be stated plainly. The memory price in this calculation is already taken conservatively, and all of the remaining uncertainty sits in the multiple. The upper part of the company's own historical range gives plus 84%, the stable 18-19x gives about plus 46%, and the six-year median gives minus 14%. A wide spread, but what matters is that it is set by what the market will pay for normalised earnings, not by a forecast of the DRAM price.
Volume is growing too, and by 2028 the model turns positive
It matters that the calculation above is not about reselling the same bits at a higher price. Micron's shipments are growing: the bit-shipment index has risen from 100 at the end of fiscal 2023 to 173, up 73%, of which plus 21% came in the last year alone. Price simply moved six times faster over the same period, which is why it drives almost the whole result.
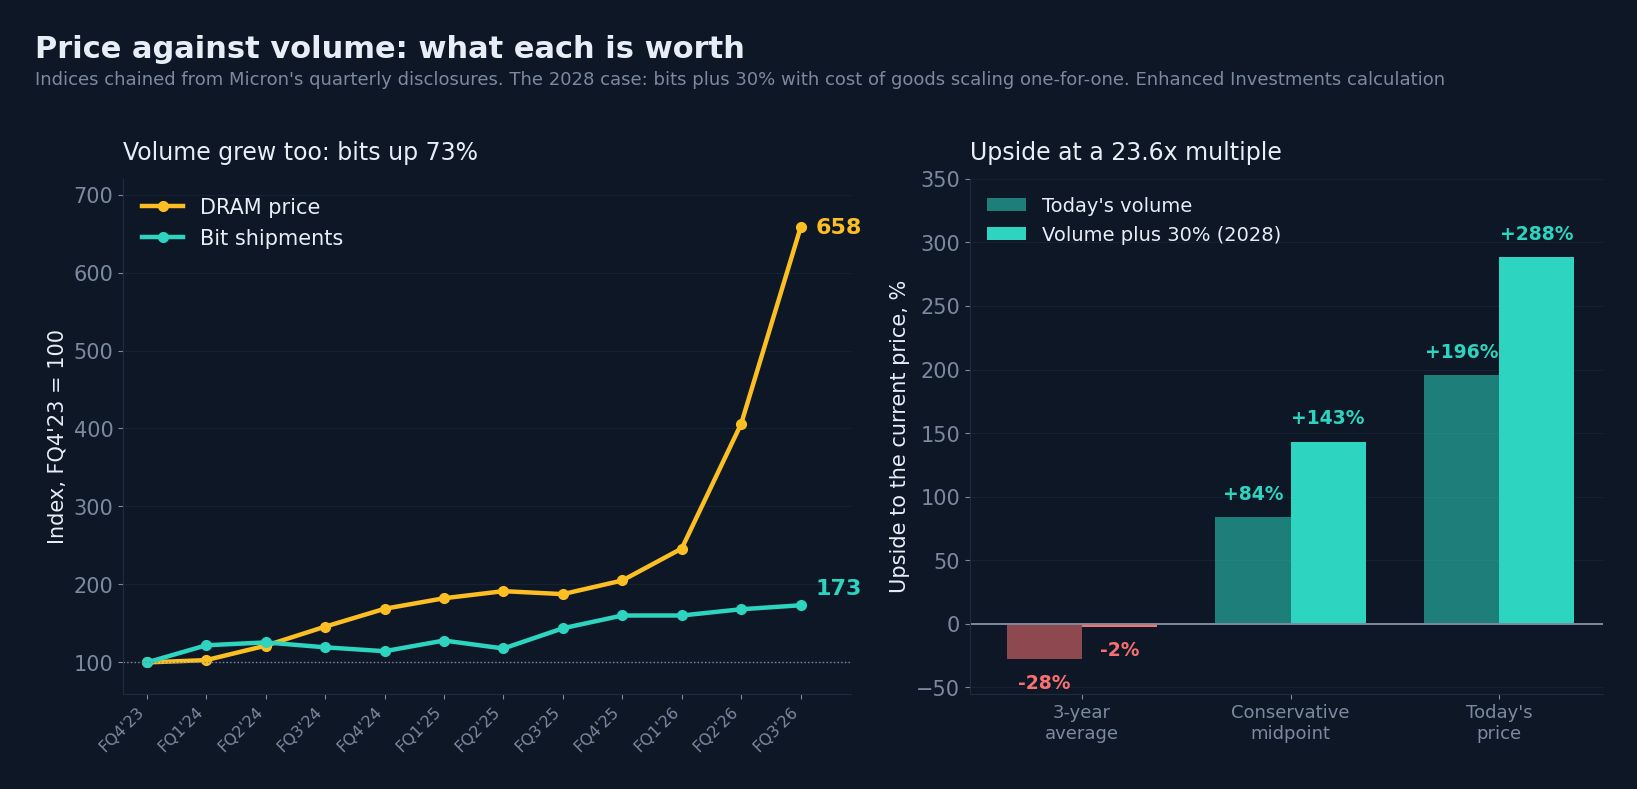
Next, add what the $27bn of annual capital spending is actually for. Take volume up 30% by 2028, two years at 14% a year, which is half the pace Micron has actually delivered over the past three years. Cost of goods in this case scales one-for-one with bits, with no improvement in cost per bit, and depreciation rises 40% for the new fabs.
The full picture across six combinations of price and volume, at the 23.6x target multiple:
– three-year average price: minus 28% on today's volume and minus 2% on the 2028 volume
– conservative midpoint: plus 84% today and plus 143% by 2028
– today's price: plus 196% now and plus 288% by 2028.
It is important not to get carried away here. At that multiple five of the six cases are positive, which means the model has stopped being a stress test and is describing a base case. The bottom row is the more useful one: even with prices back at the plain three-year average and no volume growth at all, the loss is 28%, and with the 2028 capacity it is roughly zero. That is the real boundary of the risk.
The same sum in reverse: for today's price to be fair at the target multiple, DRAM prices would have to fall 57% - almost to the three-year average, though still not quite to it.
So the answer to whether there is upside: on the company's own historical multiple, yes, and a substantial one. It rests on two assumptions: that the price does not go below the midpoint of today and the three-year average, and that the market will pay for Micron what it has paid on average over the past three years. The first is underpinned by the floor-price contracts; the second is underpinned by nothing, and that is where most of the risk sits.
An earnings-quality check: receivables tripled, but not in days
With growth like this, the first thing to check is whether the profit has been manufactured out of shipments that will never be paid for. Micron's receivables tripled, from $9.3bn to $31.0bn. But measured in days of revenue that is 68 days against 75 a year earlier, so collection has improved, not deteriorated. Inventory is steady at $8.6bn, or 122 days of cost of sales.
Cash flow corroborates the profit. Over nine months operating cash flow was $45.7bn against net profit of $47.3bn, capital expenditure was $19.6bn and free cash flow roughly $26bn. On the numbers there is nothing to fault in earnings quality.
Conclusion
Micron today is not a bet on the memory cycle, nor a pure bet on artificial intelligence. It is a bet that multi-year contracts with a price floor will survive the next downturn. Everything else in the story has already happened: prices rose, margins hit a record, the stock went up elevenfold in two years, and the contractual ceiling has been set.
For: the DRAM shortage is independently confirmed and structurally unfixable before 2028; the contract floor is, on the company's own account, above any previous peak; net cash for the first time in years; on current earnings the valuation is modest at 8 to 14 times; the company has beaten its own guidance for thirteen straight quarters and the fourth-quarter outlook is probably conservative too; volume is growing and not just price; on a conservative price, today's volume and the company's own historical 23.6x the model gives plus 84%, and plus 46% on a more cautious 18-19x; and earnings quality survives inspection.
Against: all of the growth came from price rather than volume; the contract floor protects the margin percentage rather than the amount of profit, and a return to a 70% margin puts the multiple at 26; the model's upside rests on the multiple, and on the company's six-year median it is negative; Micron is third in HBM with 18%; CXMT has multiplied its share by 2.5 in a year and closed the technology gap to two or three years; NAND is forecast to turn as early as the second half of 2027; and our cycle indicator is at its maximum, after which twelve month returns have historically been weak.
What to watch. The main event is the fourth-quarter report on 30 September, and with it any disclosure of how much 2027-2028 volume is under contract and where the floor sits. Those are the numbers that settle the central argument. After that come Samsung's and SK hynix's inventories in the next quarterly filings, and DRAM spot prices. Until those start falling, talk of a turn is premature.
The full Micron page with reporting history and multiples is on the Enhanced Investments portal. Company deep dives, weekly reviews and investment ideas are published in our Telegram channel Enhanced Investments.