Fertilizer Frenzy and Gas Gloom: The Great 2026 Divergence
This quarter's corporate results paint a picture of extreme divergence, with fertilizer and fuel retail surging while gas processing and toll infrastructure slump. The median revenue growth across industries ranges from a staggering +91.9% in fertilizers to a dismal -33.2% in gas processing, a spread of over 125 percentage points that underscores the uneven nature of the current economic landscape.
Revenue growth by industry (median YoY)
Fertilizers and fuel retail are the undisputed champions of growth
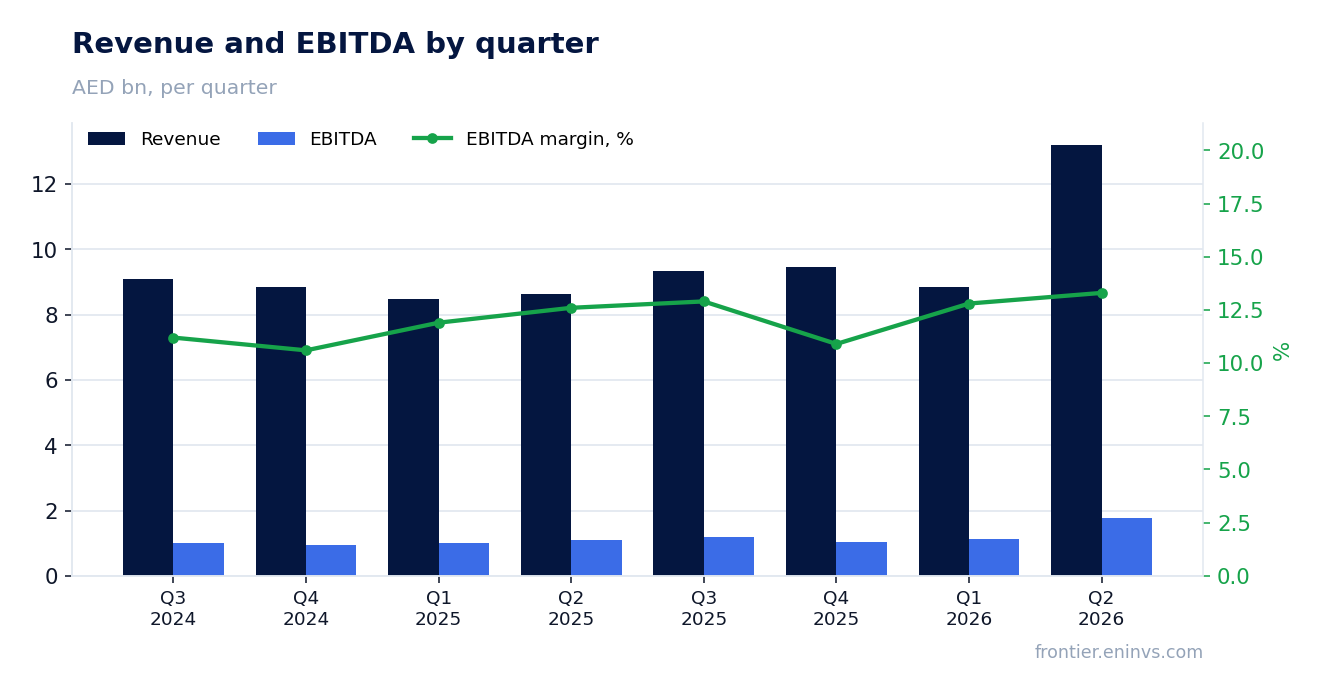
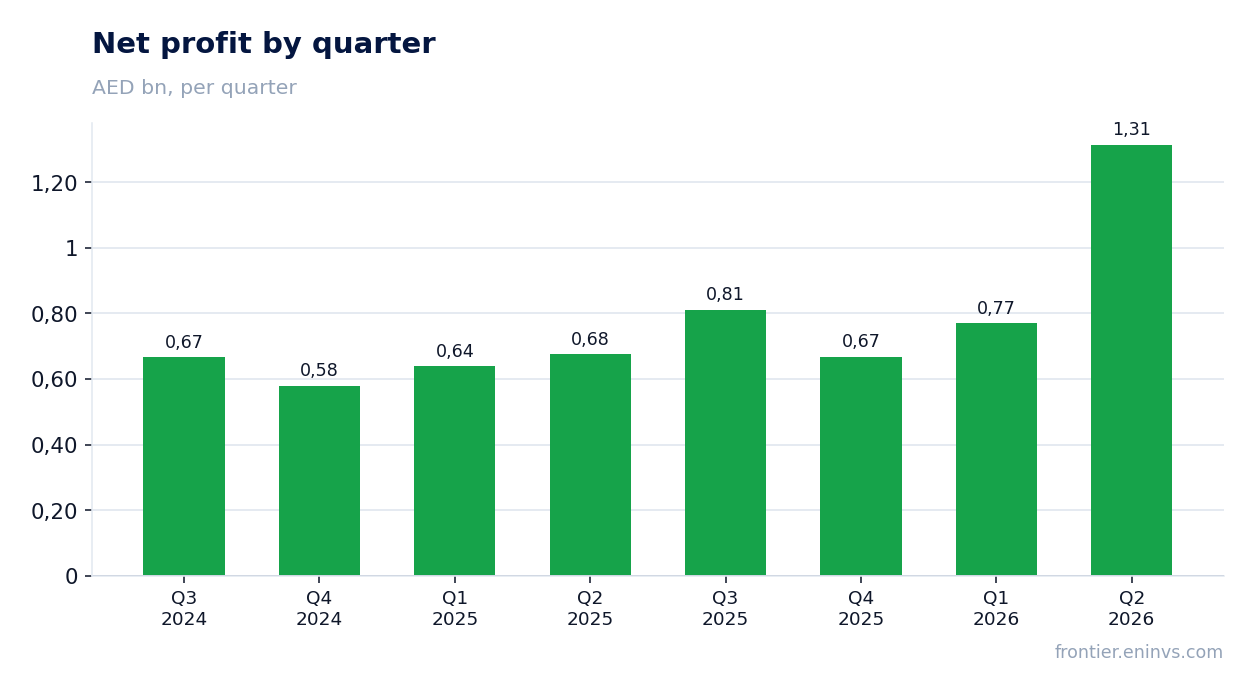
Fertiglobe (FERTIGLB) in fertilizers delivered a jaw-dropping +91.9% year-over-year revenue growth, with EBITDA up +79.7% and net profit skyrocketing +466.8%. This performance is a stark turnaround from its 3-year revenue CAGR of -17.5%, suggesting a cyclical rebound or a major operational shift. Meanwhile, ADNOC Distribution (ADNOCDIST) in fuel retail posted +52.8% revenue growth, +67.1% EBITDA growth, and +94.3% net profit growth, driven by robust demand and efficient operations.
These two sectors are leaving the rest of the market in the dust. The next closest industry, real estate development, grew revenue by +32.1%, less than half of fuel retail's pace. The surge in fertilizers and fuel retail is not just a flash in the pan—it reflects structural supply-demand imbalances and strategic positioning that could persist.
Gas processing and toll infrastructure are hemorrhaging
ADNOC Gas (ADNOCGAS) in gas processing saw revenue plummet -33.2% year over year, with EBITDA down -42.0% and net profit collapsing -52.0%. This is a sector-wide rout, as the median revenue growth for gas processing is -33.2%. Similarly, Salik (SALIK) in toll infrastructure reported a -12.0% revenue decline, with EBITDA down -14.1% and net profit falling -16.4%. These declines are particularly painful given the high valuation multiples these companies command—ADNOC Gas trades at a P/E of 16.1x and Salik at 26.7x, suggesting investors were pricing in growth that has now evaporated.
The plot twist: Talabat's revenue growth masks a profitability squeeze
Talabat (TALABAT) in food delivery reported a healthy +16.3% revenue increase, but this top-line strength is overshadowed by a -12.4% decline in EBITDA and a -17.9% drop in net profit. This deceleration from prior periods—where growth was likely stronger—signals intensifying competition and margin pressure. The company's P/E of 16.1x and EV/EBITDA of 11.8x may not fully reflect these headwinds, making it a potential value trap.
Cheap for growth: Emaar Development and Fertiglobe are bargains
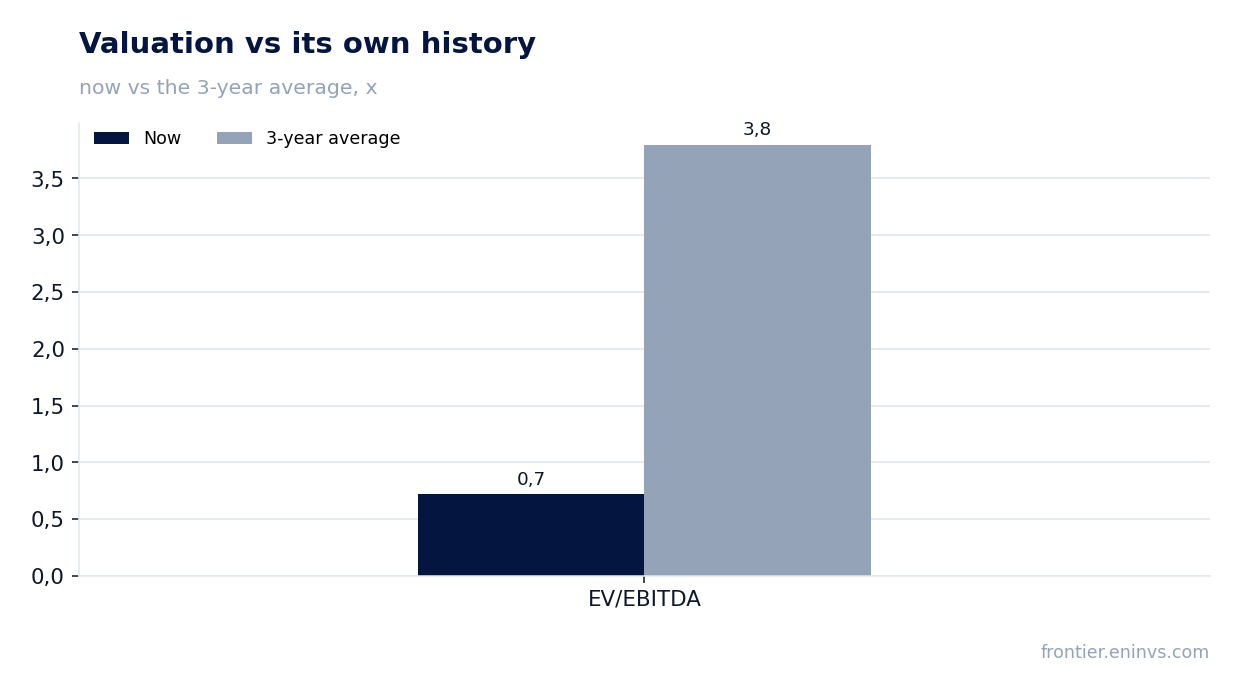
Emaar Development (EMAARDEV) is growing revenue at +32.1% and net profit at +43.6%, yet trades at a P/E of just 3.9x and EV/EBITDA of 0.7x—a valuation that screams deep value. Similarly, Fertiglobe (FERTIGLB) with its explosive +91.9% revenue growth and +466.8% net profit growth trades at a P/E of 11.8x and EV/EBITDA of 4.8x, which looks remarkably cheap for such momentum. In contrast, Parkin (PARKIN) with +13.6% revenue growth trades at a P/E of 26.3x and EV/EBITDA of 21.9x, a rich multiple that may be hard to justify if growth slows.
Income investors: Americana Restaurants and Spinneys offer solid yields
While dividend yields are not explicitly provided in the data, Americana Restaurants (AMR) and Spinneys (SPINNEYS) stand out as potential income plays. Americana, with a P/E of 20.4x and EV/EBITDA of 9.3x, has grown net profit by +40.3%, suggesting capacity for dividends. Spinneys, with a P/E of 12.6x and EV/EBITDA of 5.0x, grew net profit by +5.7% despite a revenue decline of -1.6%, indicating resilient margins. Both could appeal to yield-focused investors, though yields would need to be confirmed.
Looking at the long view, Emaar Properties (EMAAR) and ADCB (ADCB) have impressive 3-year revenue CAGRs of +25.7% and +18.2%, respectively, indicating sustained growth. However, the divergence between sectors is likely to persist as long as commodity cycles and consumer demand patterns remain uneven. Watch for signs of stabilization in gas processing and toll infrastructure, and whether the fertilizer and fuel retail booms can be sustained. The next quarter will reveal whether this is a temporary spike or a new normal.
Players: growth & yield (no absolute levels)
| Company | Industry | Revenue YoY | EBITDA YoY | Net profit YoY | P/E |
|---|---|---|---|---|---|
| e& (Etisalat Group) (Q2) | Telecom | +6.4% | — | -10.1% | 15.6x |
| TAQA (Abu Dhabi National Energy) (Q2) | Utilities | -2.4% | — | +21.7% | 39.5x |
| ADNOC Distribution (Q2) | Fuel retail | +52.8% | +67.1% | +94.3% | 17.5x |
| Emirates NBD (Q2) | Banks | +12.1% | n/a | +1.8% | 7.8x |
| Emaar Properties (Q2) | Real estate | +18.2% | +15.0% | +9.0% | 5.2x |
| First Abu Dhabi Bank (Q2) | Banks | +5.4% | n/a | +3.8% | 9.7x |
| DEWA (Dubai Electricity & Water) (Q2) | Utilities | -2.6% | -2.6% | +1.4% | 15.3x |
| Aldar Properties (Q2) | Real estate | +4.8% | +19.1% | +9.9% | 7.7x |
| Emaar Development (Q2) | Real estate development | +32.1% | +37.4% | +43.6% | 3.9x |
| Abu Dhabi Commercial Bank (Q2) | Banks | +21.3% | n/a | +31.5% | 9.4x |
| du (EITC) (Q2) | Telecom | +4.6% | +9.0% | +9.8% | 17.5x |
| Dubai Islamic Bank (Q2) | Banks | +1.7% | n/a | -0.1% | 6.8x |
| Abu Dhabi Islamic Bank (Q2) | Banks | +9.9% | n/a | +8.2% | 11.7x |
| ADNOC Gas (Q2) | Gas processing | -33.2% | -42.0% | -52.0% | 16.1x |