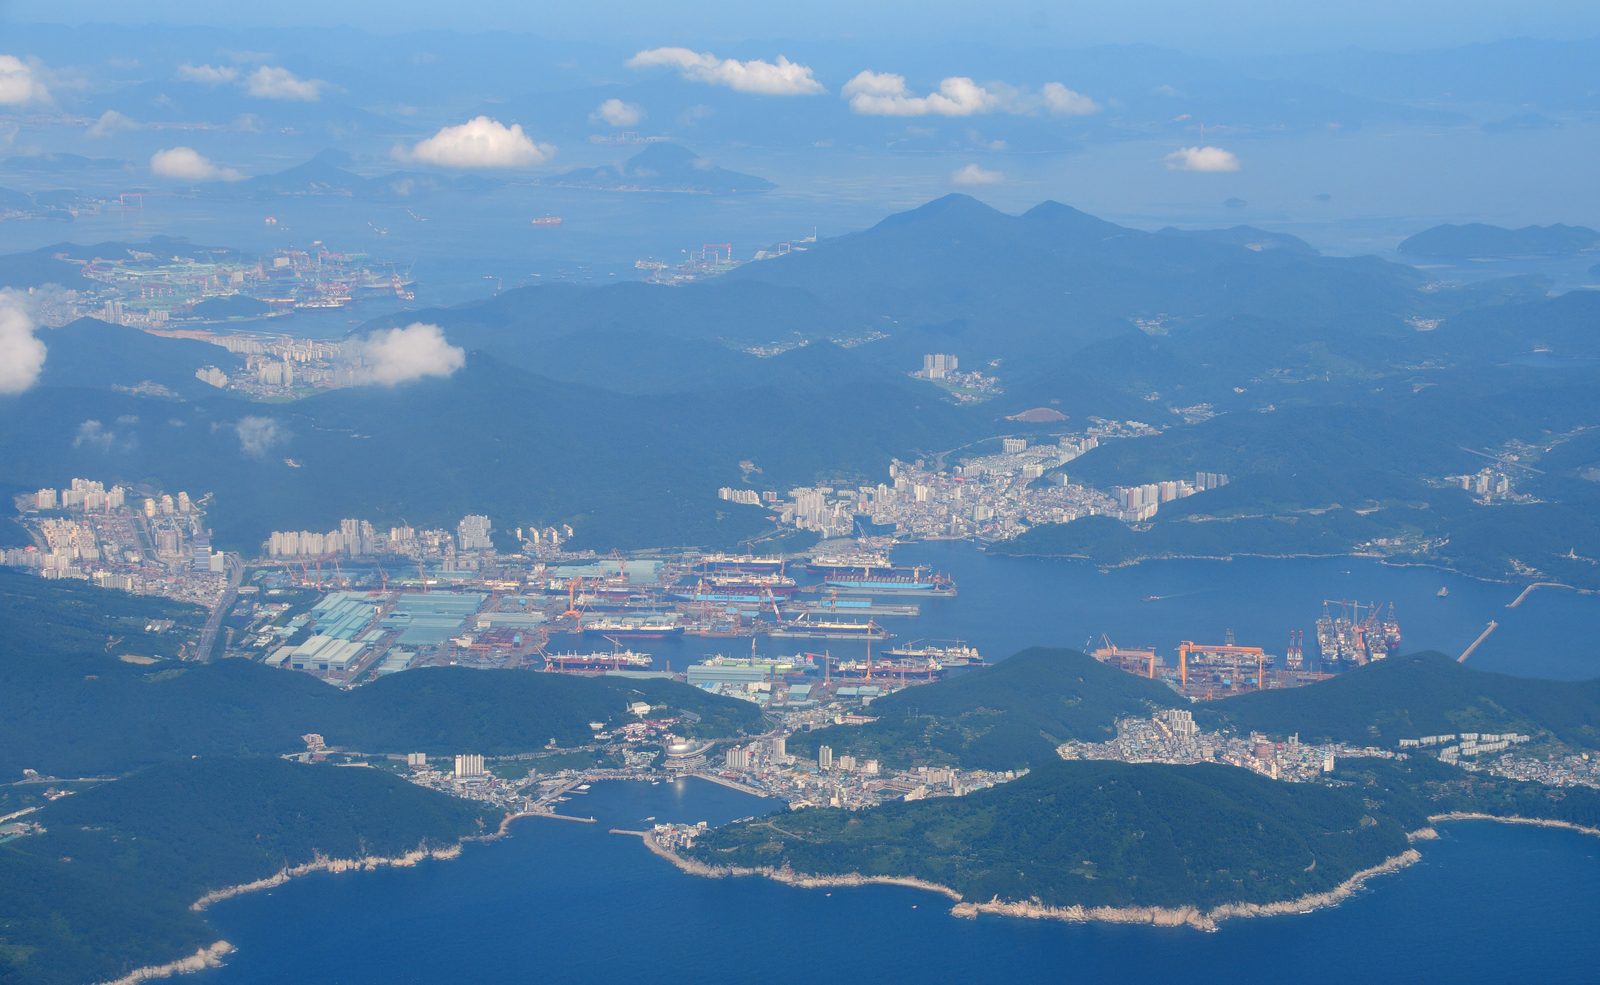
Hanwha Ocean is a South Korean shipbuilder and offshore contractor that constructs commercial vessels such as LNG carriers, tankers, and container ships, as well as offshore facilities like FPSOs and drilling rigs. It also engages in related engineering and construction projects, including infrastructure and power plants.
Sector: Shipbuilding
KR_042660
Net debt (table and EV/EBITDA): |short-term borrowings| + |long-term borrowings| + |other financial liabilities| when extracted + |non-controlling interest| when extracted − |cash and equivalents|; amounts in millions of the reporting currency.
Shares: verified/reconciled_vs_marketcap
Monetary columns are in T KRW, one decimal; scale (K/M/B/T) keeps values readable. For the period (default) shows P&L and cash flow for that row’s reporting window: quarterly amounts when the feed uses quarter-duration facts (typical US 10-Q revenue and income), quarterly cash flows after stripping YTD where only cumulative tags exist, and an implied Q4 on 31 Dec FY rows (P&L: FY minus Q1–Q3; operating / investing cash flow: FY 12m minus 9M YTD to 30 Sep when sourced from SEC builder evidence) so they match 10-Q scale. Some issuers still use cumulative YTD minus the prior row in the same calendar year. As reported shows values stored on each row (e.g. full-year on FY). Balance sheet is always as reported. Source JSON may use millions etc.; conversion uses amounts_unit per row.
| Date | Period | Status | RevenueT KRW | Operating profitT KRW | D&AT KRW | EBITDAT KRW | Net profitT KRW | Operating CFT KRW | Capex + M&AT KRW | AssetsT KRW | EquityT KRW | ROE (annualized) | Net debtT KRW | Source |
|---|---|---|---|---|---|---|---|---|---|---|---|---|---|---|
| 2026-06-30 | Q2 2026 (3M) | OK | 5.4 y/y 65.2% | 0.7 y/y 98.0% | 0.1 y/y 18.3% | 0.8 y/y 87.2% | 0.7 y/y 366.6% | 0.8 | -0.2 | 20.1 y/y 10.1% | 7.5 y/y 44.1% | 38.6% | 4.7 | DART |
| 2026-03-31 | Q1 2026 (3M) | OK | 3.2 y/y 2.1% | 0.4 y/y 70.6% | 0.1 y/y 33.0% | 0.5 y/y 64.4% | 0.5 y/y 131.8% | 0.2 | -0.1 | 20.8 y/y 14.4% | 6.8 y/y 34.1% | 30.8% | 5.2 | DART |
| 2025-12-31 | Q4 2025 (3M) | OK | 3.3 y/y 2.1% | 0.2 y/y 46.4% | 0.1 y/y 26.5% | 0.3 y/y 41.7% | 0.6 y/y 5.7% | 0.8 | -0.3 | 20.1 y/y 12.9% | 6.2 y/y 27.0% | 21.4% | 5.0 | DART |
| 2025-09-30 | Q3 2025 (3M) | OK | 3.0 y/y 11.8% | 0.3 y/y 1032.7% | 0.1 y/y 31.8% | 0.3 y/y 398.5% | 0.3 y/y — | -0.3 | -0.2 | 18.5 y/y 13.2% | 5.5 y/y 31.0% | 6.7% | 4.8 | DART |
| 2025-06-30 | Q2 2025 (3M) | OK | 3.3 y/y 29.9% | 0.4 y/y — | 0.1 y/y 40.2% | 0.4 y/y 1248.2% | 0.1 y/y — | 0.6 | -0.1 | 18.3 y/y 12.8% | 5.2 y/y 20.5% | 11.5% | 4.1 | DART |
| 2025-03-31 | Q1 2025 (3M) | OK | 3.1 y/y 37.6% | 0.3 y/y 388.5% | 0.1 y/y 20.8% | 0.3 y/y 226.6% | 0.2 y/y 322.6% | 0.2 | -0.1 | 18.2 y/y 22.0% | 5.1 y/y 16.6% | 17.3% | 4.6 | DART |
| 2024-12-31 | Q4 2024 (3M) | OK | 3.3 y/y 45.8% | 0.2 y/y 459.9% | 0.1 y/y 28.0% | 0.2 y/y 3675.6% | 0.6 y/y 102.6% | -0.3 | -0.1 | 17.8 y/y 28.0% | 4.9 y/y 12.8% | 11.7% | 4.8 | DART |
| 2024-09-30 | Q3 2024 (3M) | OK | 2.7 y/y 41.0% | 0.0 y/y -65.5% | 0.0 y/y 19.8% | 0.1 y/y -37.1% | -0.1 y/y -132.3% | -1.0 | -0.1 | 16.4 y/y 23.3% | 4.2 y/y 56.4% | -2.3% | 3.9 | DART |
| 2024-06-30 | Q2 2024 (3M) | OK | 2.5 y/y 39.3% | 0.0 y/y — | 0.0 y/y — | 0.0 y/y — | 0.0 y/y — | -0.5 | -0.1 | 16.2 y/y 19.0% | 4.3 y/y 86.0% | -2.5% | 2.5 | DART |
| 2024-03-31 | Q1 2024 (3M) | OK | 2.3 y/y 58.6% | 0.1 y/y — | 0.0 y/y — | 0.1 y/y — | 0.1 y/y — | -1.2 | -0.1 | 14.9 y/y 20.9% | 4.4 y/y 593.6% | 4.7% | 1.8 | DART |
| 2023-12-31 | Q4 2023 (3M) | OK | 2.2 y/y — | 0.0 y/y — | 0.0 y/y — | 0.0 y/y — | 0.3 y/y — | -0.5 | -0.1 | 13.9 y/y — | 4.3 y/y — | 4.6% | 0.4 | DART |
| 2023-09-30 | Q3 2023 (3M) | OK | 1.9 y/y — | 0.1 y/y — | 0.0 y/y — | 0.1 y/y — | 0.2 y/y — | -0.7 | -0.1 | 13.3 y/y — | 2.7 y/y — | 12.3% | 1.4 | DART |
| 2023-06-30 | Q2 2023 (3M) | OK | 1.8 y/y — | -0.2 y/y — | — y/y — | -0.2 y/y — | -0.2 y/y — | 0.0 | 0.0 | 13.6 y/y — | 2.3 y/y — | -64.1% | 0.8 | DART |
| 2023-03-31 | Q1 2023 (3M) | OK | 1.4 y/y — | -0.1 y/y — | — y/y — | -0.1 y/y — | -0.1 y/y — | -0.8 | — | 12.3 y/y — | 0.6 y/y — | — | 2.8 | DART |
| Short-term debt (incl. ST leases) | 3 428 199 |
| Long-term debt (incl. LT leases) | 2 759 259 |
| − Cash & equivalents | 1 446 204 |
| Net debt | 4 741 255 |
|---|
Net debt / LTM EBITDA: 2.4x
Quarterly values (KRW mln)
Year-over-year change
FCF (KRW mln)
Net debt / cash (KRW mln)
| year | 2022 | 2023 | 2024 | 2025 |
|---|---|---|---|---|
| cash flow / profit | — | -12.13x | -5.50x | 1.05x |
| accruals, % of assets | -5.5% | 15.0% | 19.2% | -0.3% |
Our earnings breakdowns and investment notes on this issuer.
Value the company creates per year, as a % of market cap
Value created per year: +44.0%
| 1. EBITDA growth (latest quarter YoY, annualised) [EBITDA latest qtr − EBITDA year-ago qtr] × annualisation X (2026-06-30 vs 2025-06-30) = (805 066 − 429 969) × 2.45 | 920 036 |
| 2. Current EV/EBITDA (LTM) (Market cap + Net debt) ÷ EBITDA (LTM) = (19 913 257 + 4 741 255) ÷ 1 974 661 | 12.5x |
| 3. Target multiple (Current EV/EBITDA + 8) ÷ 2 = (12.5 + 8) ÷ 2 | 10.2x |
| 4. Cash flow (balance method, LTM) Net-debt reduction + dividends + buybacks − equity issuance = -653 046 + 0 + 0 − 0 | -653 046 |
| 5. Value created per year (EBITDA growth × Target multiple + Cash flow − Dilution) ÷ Market cap = (920 036 × 10.2 + -653 046) ÷ 19 913 257 | +44.0% |
Amounts in millions of the reporting currency. EBITDA growth is the latest quarter vs the same quarter a year ago, annualised.
Caveats:
Group: industrials (Korea). Every peer trades on the same market, so no adjustment is needed.
| Company | Market | Cap, $bn | EV/EBITDA |
|---|---|---|---|
| Hyundai Rotem | Korea | 7.9 | 7.7x |
| HD Hyundai Heavy Industries | Korea | 27.4 | 9.5x |
| HMM | Korea | 16.5 | 10.4x |
| Samsung Heavy Industries | Korea | 11.7 | 11.5x |
| Hanwha Aerospace | Korea | 34.4 | 11.7x |
| Hanwha Systems | Korea | 11.0 | 44.5x |
| Group median | 11.0x | ||
| Group average | 15.9x | ||
| This company | Korea | 14.8 | 12.5x |
Group median 11.0x; this company 12.5x — a 14% premium.
Group average 15.9x; against the average this company is at a 21% discount. The average sits 45% above the median: Hanwha Systems (44.5x) skews the group.
At the adjusted group median the market cap would be -15% versus today.
The gap and the implied upside are measured against the median: one richly priced peer moves an average, not a median. The market adjustment uses our coverage medians (US 21.9x, Russia 4.0x, South Africa 5.1x, Kazakhstan 6.4x, India 18.7x, Indonesia 4.6x); it is about where a name is listed, not what it does. Peer multiples come from the nightly rebuild of 2026-10-16; the company's own is live.
No dividend rows found for this issuer (checked: Yahoo Finance (ex-div)).
Reporting forms detected in loaded periods: ✓ ✓ ✓ (Balance sheet / Profit or loss (P&L) / Cash flows)
Financial results, valuation multiples (P/E, P/B, EV/EBITDA), profitability and dividend yield of Hanwha Ocean (042660) — from primary filings.
See also: The Cheapest Stocks in the World (2026): What Value Investing Says About Buying Cheap · global valuation map