SK hynix: Q2 2026 net profit up 13-fold, but the key question is whether the company can sustain its margin
30 июля SK hynix раскрыла результаты за второй квартал 2026 года: выручка выросла на 256,8% год к году, до 79,3 трлн вон, чистая прибыль – на 1240,8%, до 93,8 трлн вон. Компания вышла на рекордную рентабельность, но акции торгуются с мультипликатором выше собственной трехлетней истории, что делает оценку менее привлекательной. Вердикт – «скорее привлекательно»: бизнес демонстрирует взрывной рост, но текущая цена уже учитывает значительную часть будущих успехов.
Key takeaways
— Q2 2026 revenue grew 256.8% YoY to KRW 79.3 trillion, driven by explosive AI memory demand
— EBITDA margin reached 81.4% versus 55.8% a year earlier, reflecting operating leverage and supply shortage
— Net profit of KRW 93.8 trillion in Q2 includes one-off effects, but operating profit also grew several-fold
— The company reduced net debt to a negative level, providing financial flexibility for investments and dividends
— Dividend yield remains low at 0.16% over the last 12 months, making the stock unattractive for income investors
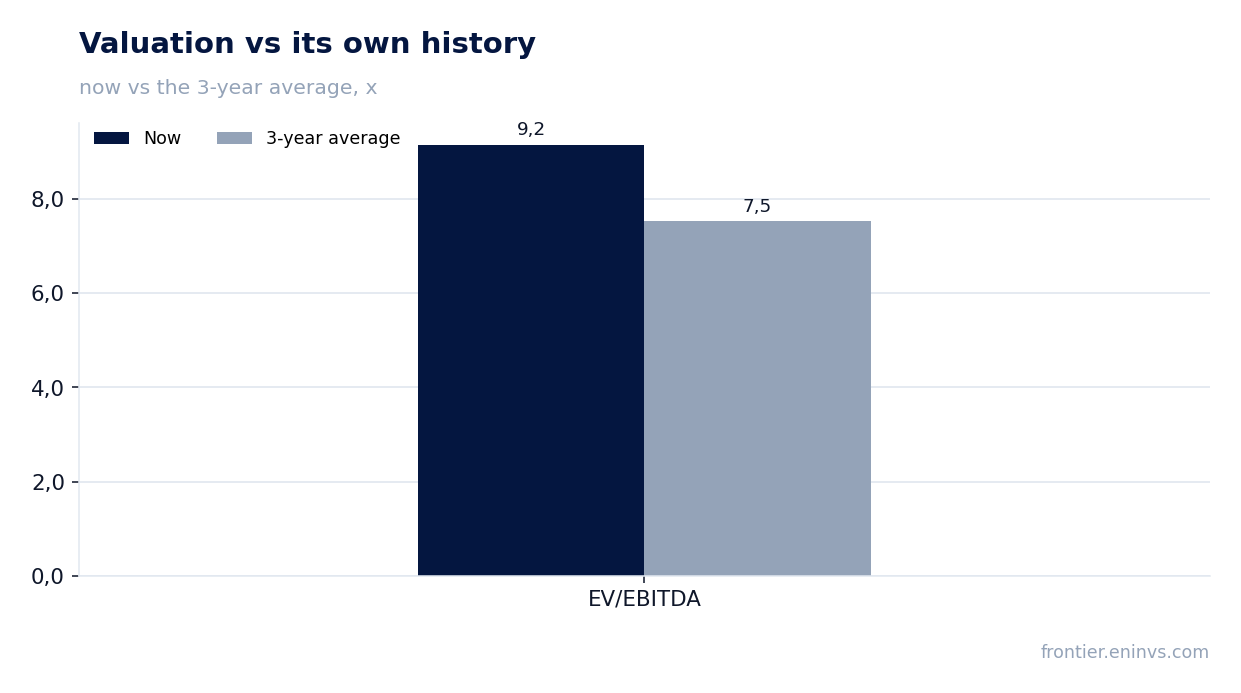
— The stock trades at P/E of 8.1 and EV/EBITDA of 9.2, above its 3-year average of 7.5, but still cheap relative to growth rates
Attractiveness
Key figures, KRW bn
| Metric | Q2 2025 | Q2 2026 | Change |
|---|---|---|---|
| Revenue | 22 232 | 79 319 | +256.8% |
| EBITDA | 12 397 | 64 573 | +420.9% |
| Operating profit | 9 213 | 60 543 | +557.2% |
| Net profit | 6 997 | 93 820 | +1240.8% |
| Operating cash flow | 9 166 | 65 412 | +613.6% |
| Capex | 4 621 | 11 129 | +140.8% |
| EBITDA margin | 55.8% | 81.4% | +25.6 pp |
| Net margin | 31.5% | 118.3% | +86.8 pp |
1. Q2 2026 revenue grew 256.8% YoY to KRW 79.3 trillion, driven by explosive AI memory demand
In Q2 2026, SK hynix revenue reached KRW 79.3 trillion, up 256.8% from the same period last year. This continues accelerating growth: Q1 2026 saw 198.1% growth, and Q4 2025 – 66.1%. The company is a key supplier of HBM memory for AI accelerators, and demand from chipmakers remains extremely strong.
Sequential dynamics are also impressive: revenue rose from KRW 52.6 trillion in Q1 2026 to KRW 79.3 trillion in Q2. This reflects not only seasonal strengthening but also capacity expansion and higher shipment volumes. The main driver remains the server segment, where AI workloads require increasing amounts of high-bandwidth memory.
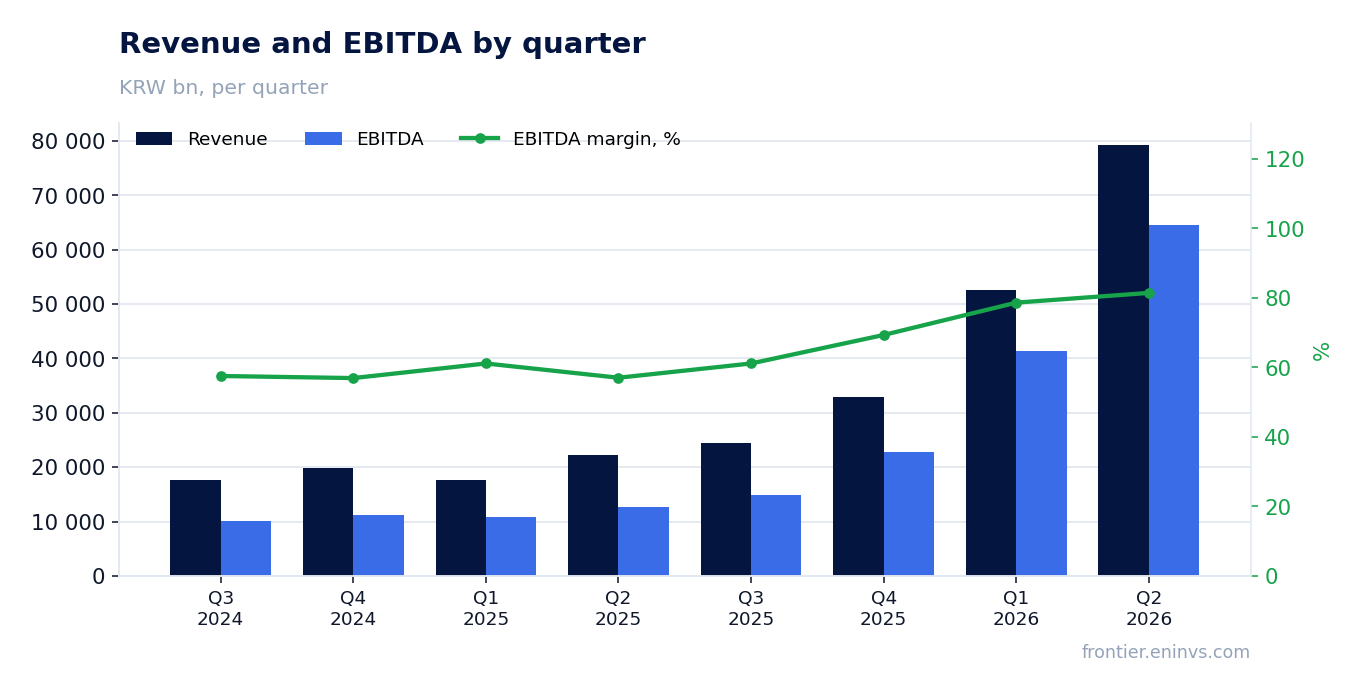
2. EBITDA margin reached 81.4% versus 55.8% a year earlier, reflecting operating leverage and supply shortage
EBITDA in Q2 2026 reached KRW 64.6 trillion, with margin at 81.4% versus 55.8% a year earlier. This extraordinary level was made possible by a combination of high memory prices and low unit costs. The company operates at full capacity, enhancing operating leverage.
Margin growth is also linked to favorable pricing: supply shortage in the HBM market allows manufacturers to set premium prices. However, such margins are unlikely to be sustainable in the long run – competitors are expanding capacity, and prices may correct. For now, the company is extracting maximum benefit from the current situation.
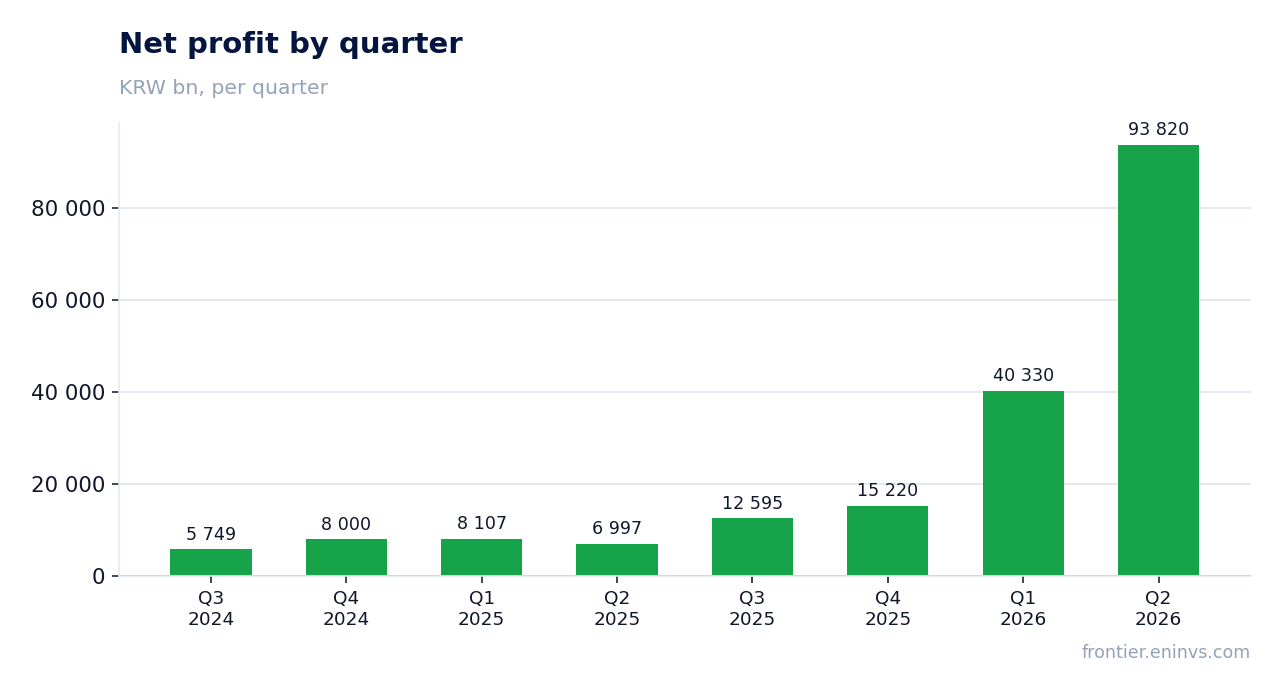
3. Net profit of KRW 93.8 trillion in Q2 includes one-off effects, but operating profit also grew several-fold
Net profit in Q2 2026 reached KRW 93.8 trillion, up 1240.8% from a year earlier. This growth is partly explained by one-off gains, including investment revaluation and tax effects. Operating profit was KRW 60.5 trillion, also reflecting a significant improvement in core operations.
Net margin was 118.3% – higher than EBITDA margin, which is only possible due to non-operating income. Investors should note that such one-off items will not repeat, and future quarterly net profit may be lower even if operating metrics remain strong.
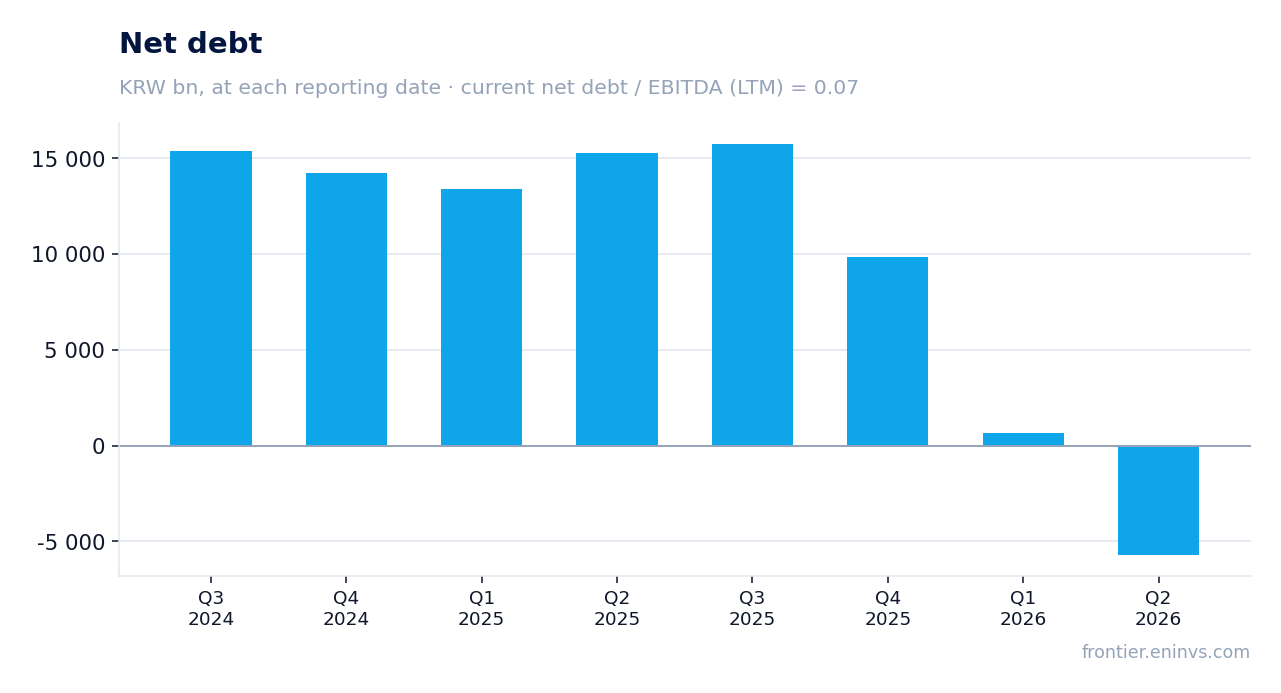
4. The company reduced net debt to a negative level, providing financial flexibility for investments and dividends
At the end of Q2 2026, SK hynix net debt was minus KRW 5.7 trillion, meaning cash exceeds debt. This is a sharp improvement from KRW 9.8 trillion a quarter earlier. Operating cash flow for the quarter reached KRW 65.4 trillion, allowing to finance capex of KRW 11.1 trillion and simultaneously reduce debt.
Net debt / EBITDA over the last 12 months is 0.07 – a minimal level. This gives the company room to increase investments in new production lines and maintain its dividend policy without additional borrowing. The financial cushion also protects against potential market downturns.
5. Dividend yield remains low at 0.16% over the last 12 months, making the stock unattractive for income investors
Over the last 12 months, SK hynix paid dividends of 0.16% of the current share price. This is a very low figure, especially against high risk-free yields. The company traditionally allocates a small portion of profit to dividends, preferring to reinvest in capacity expansion.
In the current year, given record profit, the company may increase payouts, but even doubling the dividend would leave yield below 0.5%. For income-seeking investors, the stock is not suitable. The main value for shareholders is created through capital appreciation, not dividend payments.
6. The stock trades at P/E of 8.1 and EV/EBITDA of 9.2, above its 3-year average of 7.5, but still cheap relative to growth rates
The current EV/EBITDA multiple is 9.2, above the 3-year average of 7.5. This indicates that the market is already pricing in high growth expectations. P/E of 8.1 looks moderate, but it is based on one-off net profit including non-operating income.
On the portal's model, the upside is +77% from the current price. This means that the fundamental valuation, based on EBITDA growth and target multiple, suggests significant potential. However, the realization of this potential depends on the company's ability to sustain high growth rates and margins amid increasing competition.
Valuation on the latest reported figures
| Metric | Value |
|---|---|
| Market cap | 1 319 756 bn KRW |
| P/E (LTM) | 8.1 |
| EV/EBITDA (LTM) | 9.2 |
| P/B | 10.94 |
| Net debt / EBITDA (LTM) | 0.07 |
| Operating cash flow (LTM) | 53 373 bn |
| ROE | 175.7% |
| Dividend yield (12m) | 0.2% |
| EV/EBITDA, 3-year average | 7.5 |
Bottom line
SK hynix delivered impressive Q2 2026 results: revenue grew 3.5-fold, EBITDA margin reached 81.4%, and net debt turned negative. However, part of the profit is one-off, and margins at such levels are unlikely to be sustainable. The stock trades above its own 3-year history on EV/EBITDA, but the portal's model suggests significant upside potential. The verdict is 'rather attractive': the business is in a supercycle phase, but investors should watch for signs of memory price normalization.
Open the company's financial profile 000660 →
See also: market overview · valuation map · stock screeners