Hyundai Motor: revenue grows, but EBITDA and profit decline, and leverage reaches 11.3x
On August 25, Hyundai Motor reported results for the second quarter of 2026. Revenue rose 1.9% year-on-year to KRW 49,215,328 million, but EBITDA fell 29.6% to KRW 4,069,797 million and net profit declined 15.9% to KRW 2,520,851 million. Given weak profit dynamics and high leverage, the shares look unattractive.
Key takeaways
— Revenue grows slowly: +1.9% year-on-year in Q2, to KRW 49.2 trillion
— EBITDA margin contracted from 12.0% to 8.3% due to a 29.6% drop in EBITDA
— Net profit fell 15.9% to KRW 2.5 trillion, with margin down from 6.2% to 5.1%
— Leverage reached 11.3x EBITDA for the last twelve months, with net debt up KRW 4.7 trillion in the quarter
— Operating cash flow in Q2 was KRW 1.5 trillion, but negative over the last twelve months – minus KRW 6.0 trillion
— Dividend yield of 2.6% looks modest given high leverage and weak cash flow
— The portal's model implies a 84% downside to fair value from the current price
Attractiveness
Key figures, KRW bn
| Metric | Q2 2025 | Q2 2026 | Change |
|---|---|---|---|
| Revenue | 48 287 | 49 215 | +1.9% |
| EBITDA | 5 777 | 4 070 | -29.6% |
| Operating profit | 3 602 | 2 851 | -20.8% |
| Net profit | 2 998 | 2 521 | -15.9% |
| Operating cash flow | -1 043 | 1 537 | to profit |
| Capex | 2 336 | 2 085 | -10.8% |
| EBITDA margin | 12.0% | 8.3% | -3.7 pp |
| Net margin | 6.2% | 5.1% | -1.1 pp |
Revenue grows slowly: +1.9% year-on-year in Q2, to KRW 49.2 trillion
In Q2 2026, Hyundai Motor's revenue reached KRW 49,215,328 million, up 1.9% year-on-year. This is a marked slowdown from the 7–9% growth rates seen in 2025.
Over the last twelve months, revenue reached KRW 188,714,200 million. Revenue growth remains positive, but its pace is slowing, which may indicate demand saturation or intensifying competition.
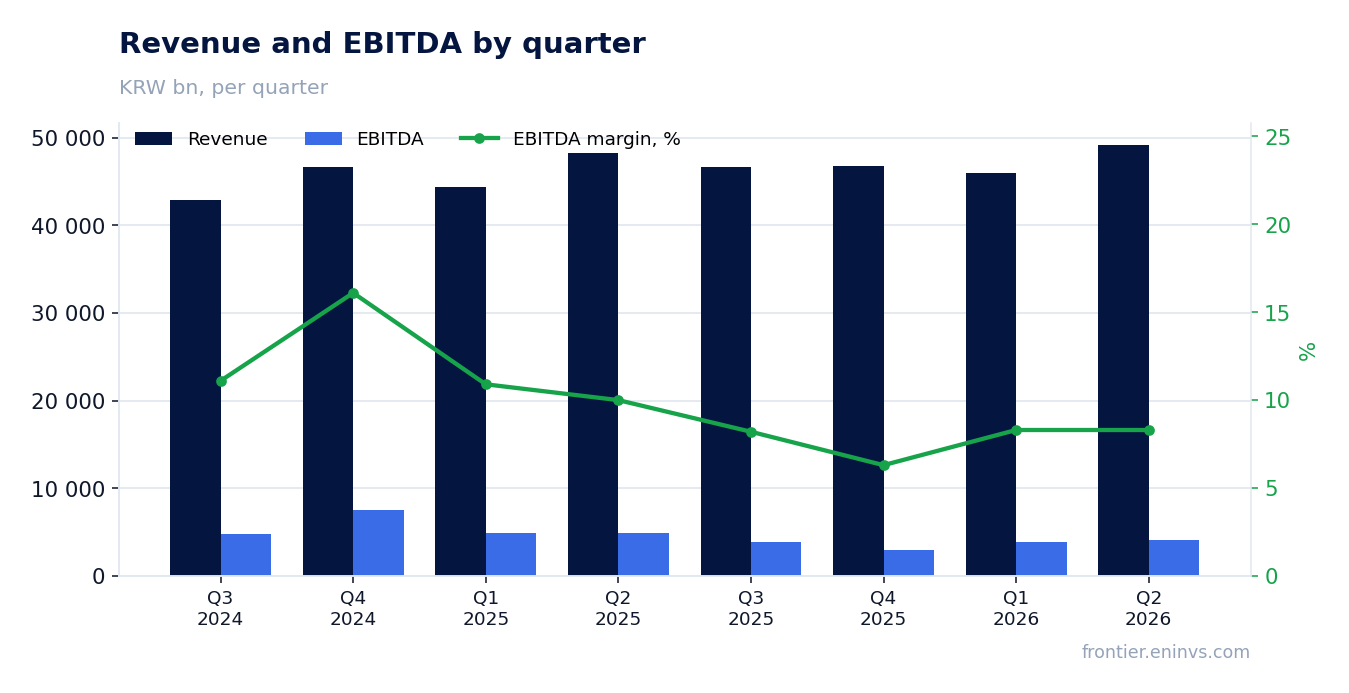
EBITDA margin contracted from 12.0% to 8.3% due to a 29.6% drop in EBITDA
EBITDA in Q2 2026 fell 29.6% year-on-year to KRW 4,069,797 million. This drove the EBITDA margin down from 12.0% to 8.3%.
The decline in EBITDA despite rising revenue points to pressure on operational efficiency. Causes may include higher costs or an unfavourable sales mix, but they are not disclosed in the report.
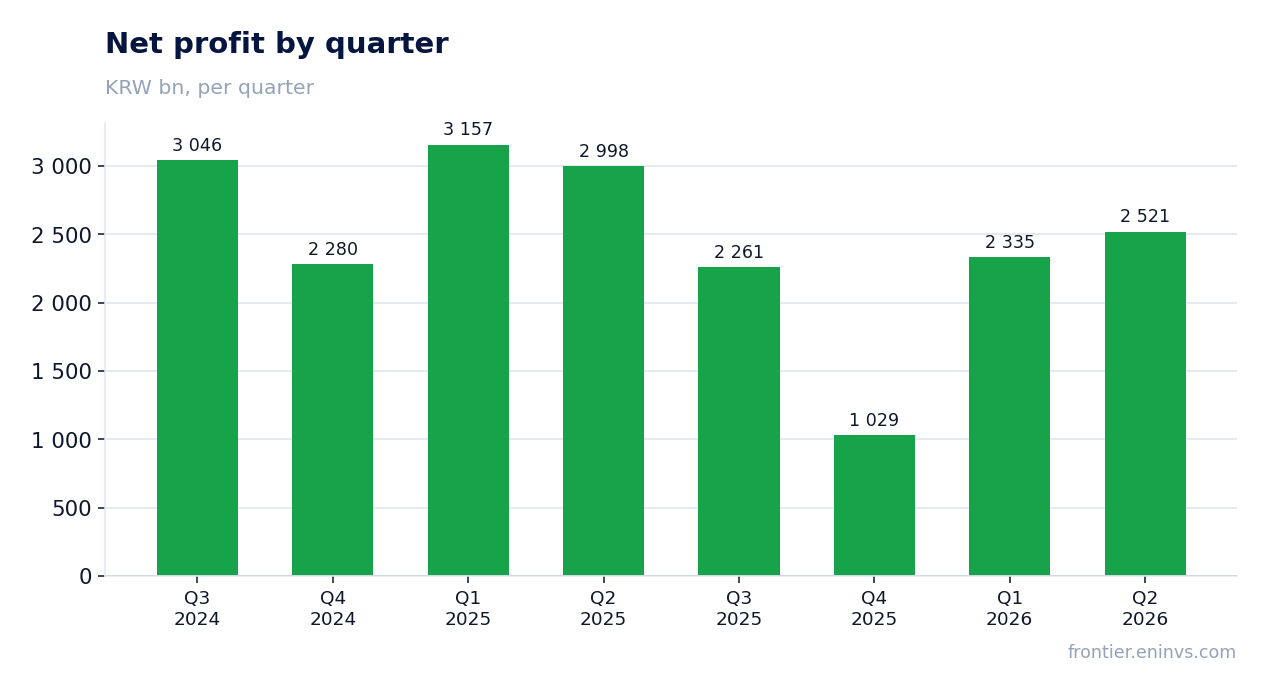
Net profit fell 15.9% to KRW 2.5 trillion, with margin down from 6.2% to 5.1%
Net profit for Q2 2026 was KRW 2,520,851 million, down 15.9% year-on-year. Net margin fell from 6.2% to 5.1%.
The decline in profit reflects not only operational pressure but also possibly higher financial costs related to high debt. Over the last twelve months, net profit reached KRW 8,146,587 million.
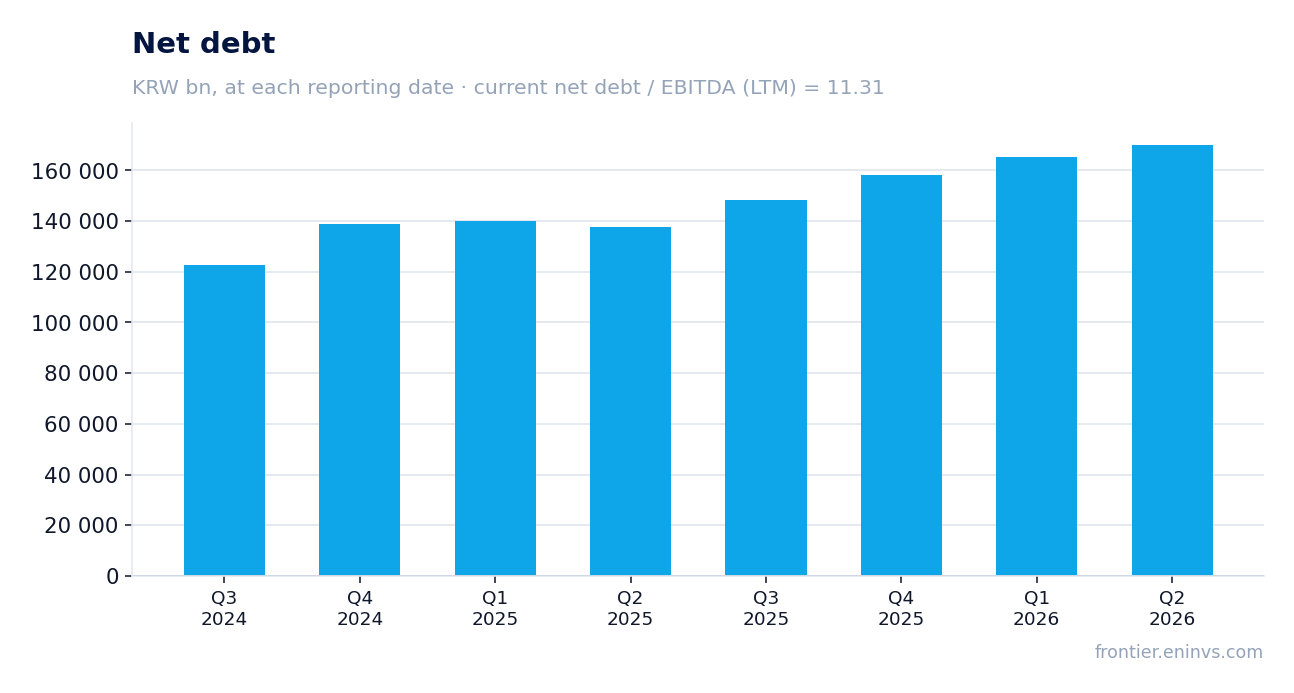
Leverage reached 11.3x EBITDA for the last twelve months, with net debt up KRW 4.7 trillion in the quarter
Net debt at the end of Q2 2026 stood at KRW 170,162,612 million, up RUB 4,722.4 billion (in rouble equivalent) from the previous reporting date. Over the last twelve months, the increase was RUB 32,346.6 billion.
The ratio of net debt to EBITDA for the last twelve months stands at 11.31. This is a high level that limits the company's financial flexibility and increases sensitivity to interest rates.
Operating cash flow in Q2 was KRW 1.5 trillion, but negative over the last twelve months – minus KRW 6.0 trillion
In Q2 2026, operating cash flow turned positive at KRW 1,536,730 million, but over the last twelve months it was minus KRW 5,991,300 million. This means the company spends more than it generates from operations.
Negative operating cash flow combined with high capital expenditures (e.g., KRW 2,085,097 million in Q2) forces the company to increase debt. This is a key risk for shareholders.
Dividend yield of 2.6% looks modest given high leverage and weak cash flow
Over the last twelve months, Hyundai Motor paid dividends providing a yield of 2.58% at the current price. This is below typical yields for investment-grade companies, especially given the risks.
Paying dividends with negative free cash flow and rising debt may prove unsustainable. Next year's dividend will likely depend on the company's ability to restore operating cash flow.
The portal's model implies a 84% downside to fair value from the current price
According to the portal's model, based on EBITDA growth and a target multiple, the fair value of the share is 84% below the current market price. This extreme gap indicates overvaluation by the market.
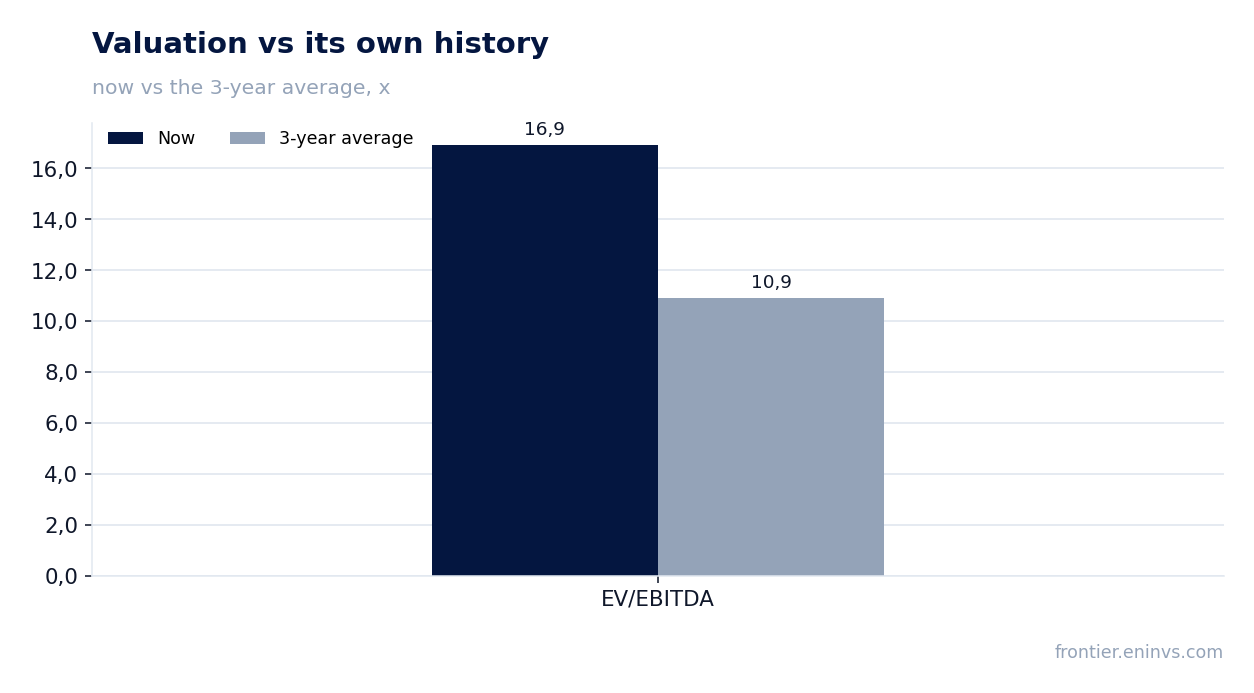
The current EV/EBITDA multiple is 16.93, significantly above the three-year average (10.92). P/E LTM is 9.64, which looks moderate, but with falling profits and high debt, such a valuation is questionable.
Valuation on the latest reported figures
| Metric | Value |
|---|---|
| Market cap | 78 538 bn KRW |
| P/E (LTM) | 9.6 |
| EV/EBITDA (LTM) | 16.9 |
| P/B | 0.62 |
| Net debt / EBITDA (LTM) | 11.31 |
| Operating cash flow (LTM) | -5 991 bn |
| ROE | 7.5% |
| Dividend yield (12m) | 2.6% |
| EV/EBITDA, 3-year average | 10.9 |
Bottom line
The strength of the report is revenue growth, but it slowed to 1.9%, while profitability and cash flow deteriorated significantly. EBITDA margin contracted to 8.3%, operating cash flow over 12 months is negative, and leverage reached 11.3x EBITDA. The dividend yield of 2.6% does not compensate for these risks. The shares trade at an EV/EBITDA multiple of 16.9 versus the three-year average of 10.9, which looks unjustified. Verdict – unattractive.
Open the company's financial profile 005380 →
See also: market overview · valuation map · stock screeners