HD Hyundai Heavy Industries: revenue and profit doubled, but the key question is whether the company can sustain its margin
On August 25, HD Hyundai Heavy Industries reported results for the second quarter of 2026. Revenue grew 52.7% year on year, EBITDA rose 194.4%, and net profit increased 289.8%. The shares look attractive: the EV/EBITDA multiple is almost half its own three-year average, and the portal's model implies 44% upside.
Key takeaways
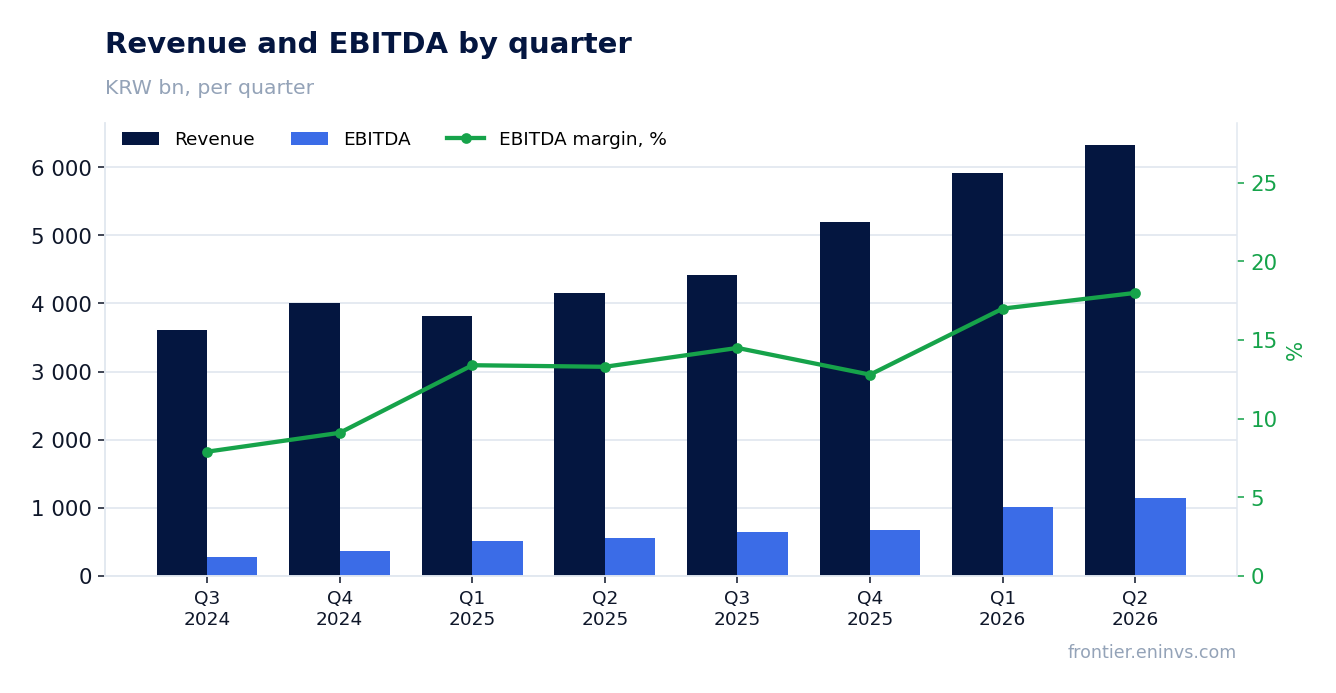
— Revenue in Q2 2026 grew 52.7% year on year to KRW 6,332.2 billion
— EBITDA margin doubled from 9.4% to 18.0% thanks to operating leverage and lower costs
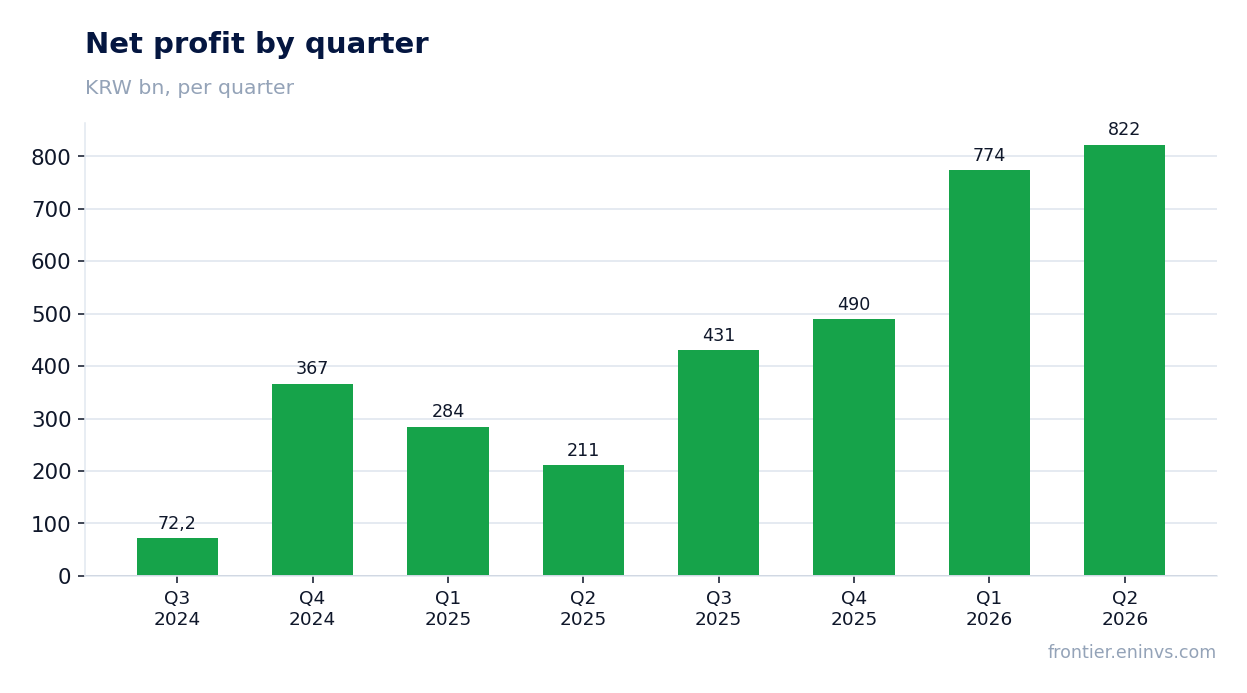
— Net profit almost quadrupled to KRW 822.1 billion on the back of higher operating profit
— Operating cash flow in Q2 2026 was KRW 1,842.7 billion, more than three times the year-ago figure
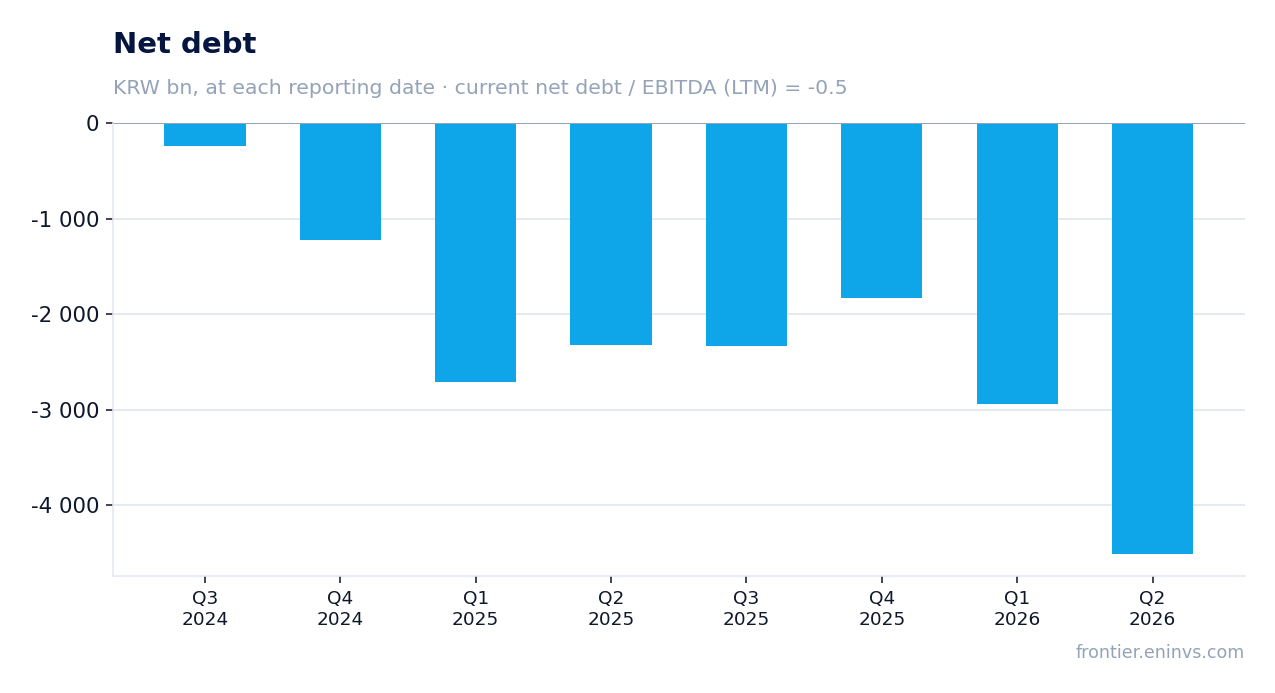
— Net debt is negative at minus KRW 4,516.5 billion; the company remains a net lender
— Trailing twelve-month dividend yield is 2.17%, below the key rate, but payments are backed by strong cash flow
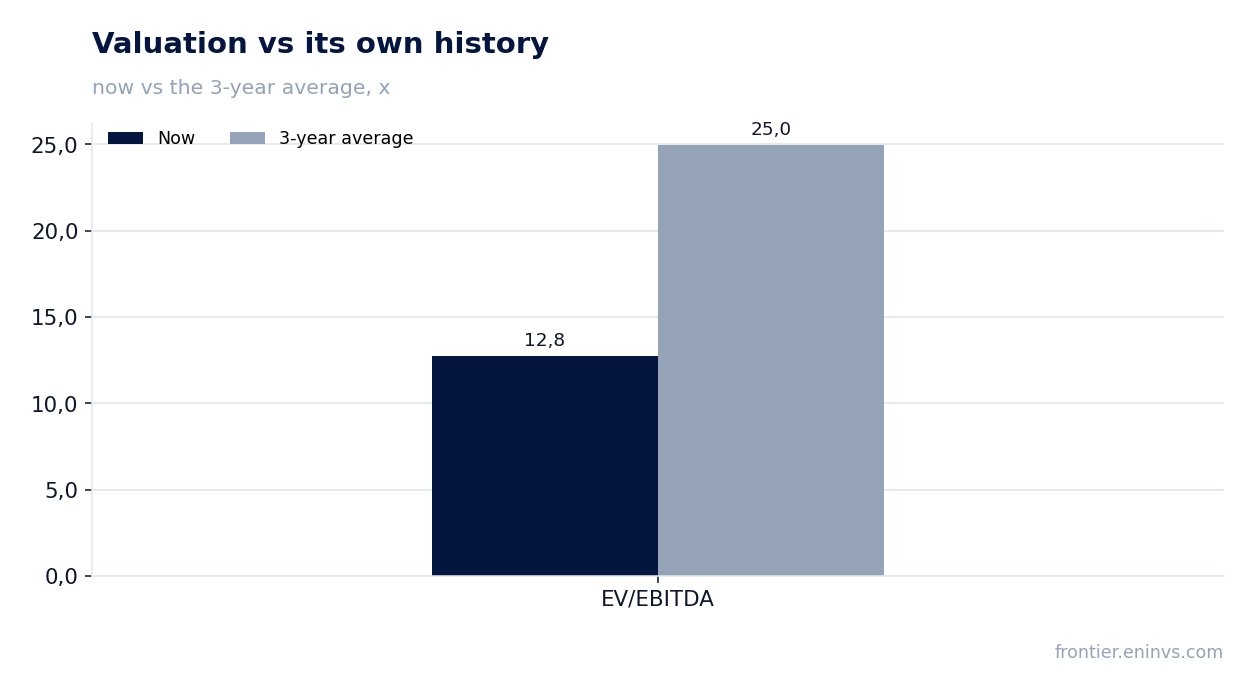
— EV/EBITDA is 12.8 versus the three-year average of 25.0 — the stock trades at a discount to its own history
Attractiveness
Key figures, KRW bn
| Metric | Q2 2025 | Q2 2026 | Change |
|---|---|---|---|
| Revenue | 4 147 | 6 332 | +52.7% |
| EBITDA | 388 | 1 142 | +194.4% |
| Operating profit | 471 | 1 040 | +120.6% |
| Net profit | 211 | 822 | +289.8% |
| Operating cash flow | 501 | 1 843 | +267.5% |
| Capex | 111 | 120 | +8.4% |
| EBITDA margin | 9.4% | 18.0% | +8.6 pp |
| Net margin | 5.1% | 13.0% | +7.9 pp |
Revenue in Q2 2026 grew 52.7% year on year to KRW 6,332.2 billion
In Q2 2026, HD Hyundai Heavy Industries' revenue reached KRW 6,332.2 billion, up 52.7% year on year. This continues the acceleration: in Q1 2026 growth was 54.8%, and in Q4 2025 it was 29.6%.
The main driver remains shipbuilding: the order book accumulated in previous years is converting into revenue. The company also benefits from favorable conditions in the maritime transport market and strong demand for eco-friendly vessels.
EBITDA margin doubled from 9.4% to 18.0% thanks to operating leverage and lower costs
In Q2 2026, the EBITDA margin was 18.0% versus 9.4% a year earlier. Revenue growth of 52.7% with EBITDA growing faster at 194.4% indicates strong operating leverage: a significant portion of costs is fixed, so additional volumes bring disproportionately high profit.
Lower unit costs for steel and components, as well as improved shipyard efficiency, also supported the margin. The question is how sustainable this level is: if raw material prices rise or capacity utilization declines, the margin could revert to historical levels.
Net profit almost quadrupled to KRW 822.1 billion on the back of higher operating profit
Net profit in Q2 2026 was KRW 822.1 billion, up 289.8% year on year. Operating profit rose to KRW 1,039.9 billion — almost three times the Q2 2025 figure.
The net margin reached 13.0% versus 5.1% a year earlier. The profit growth is driven by operations, not one-off items, making the result more qualitative.
Operating cash flow in Q2 2026 was KRW 1,842.7 billion, more than three times the year-ago figure
Operating cash flow in Q2 2026 reached KRW 1,842.7 billion versus KRW 501.4 billion a year earlier. Capital expenditures remained modest at KRW 119.9 billion, well below the operating flow.
Free cash flow (operating flow minus capex) was about KRW 1,722.8 billion, providing comfortable dividend coverage and further debt reduction. Over the last twelve months, operating cash flow was KRW 3,510.4 billion.
Net debt is negative at minus KRW 4,516.5 billion; the company remains a net lender
At the end of Q2 2026, net debt was minus KRW 4,516.5 billion, meaning cash and equivalents significantly exceed debt. The net debt to EBITDA ratio for the last twelve months is minus 0.5.
The company continues to build its cash position: net debt decreased by KRW 1,579.4 billion in the quarter and by KRW 2,187.4 billion over the last twelve months. This provides financial flexibility for dividends, investments, and potential M&A.
Trailing twelve-month dividend yield is 2.17%, below the key rate, but payments are backed by strong cash flow
Over the last twelve months, the company paid dividends providing a yield of 2.17% at the current price. This is below the key rate, making the stock less attractive for income-oriented investors.
However, payments are backed by strong cash flow: operating cash flow over the last twelve months was KRW 3,510.4 billion, covering dividend payments many times over. If current profitability is maintained, the company could increase dividends, boosting the yield.
EV/EBITDA is 12.8 versus the three-year average of 25.0 — the stock trades at a discount to its own history
The current EV/EBITDA multiple is 12.8 versus the three-year average of 25.0. The stock trades at half its own historical valuation, indicating that the market is underpricing current results.
The trailing twelve-month P/E is 19.3, and ROE is 32.5%. According to the portal's model, the stock has +44% upside to its current price. The main risk to the valuation is a possible decline in margins after the peak of the shipbuilding cycle.
Valuation on the latest reported figures
| Metric | Value |
|---|---|
| Market cap | 48 636 bn KRW |
| P/E (LTM) | 19.3 |
| EV/EBITDA (LTM) | 12.8 |
| P/B | 5.21 |
| Net debt / EBITDA (LTM) | -0.50 |
| Operating cash flow (LTM) | 3 510 bn |
| ROE | 32.5% |
| Dividend yield (12m) | 2.2% |
| EV/EBITDA, 3-year average | 25.0 |
Bottom line
HD Hyundai Heavy Industries delivered a strong quarter: revenue grew 52.7%, the EBITDA margin doubled to 18.0%, and net profit almost quadrupled. Cash flow remains robust, net debt is negative, providing financial flexibility. The stock trades at a discount to its own history and, according to the portal's model, has 44% upside. The key question is the sustainability of margins after the cycle peak; if current trends hold, the shares look attractive.
Open the company's financial profile 329180 →
See also: market overview · valuation map · stock screeners