Samsung Electro-Mechanics: revenue accelerated to +24.2%, yet the 46.4 EV/EBITDA multiple is nearly six times its own three-year average
On August 28, Samsung Electro-Mechanics reported Q2 2026 results: revenue grew 24.2% year on year, EBITDA 64.5%, and net profit 143.3%. Despite these figures, the shares look unattractive: EV/EBITDA of 46.4 versus its own three-year average of 7.8.
Key takeaways
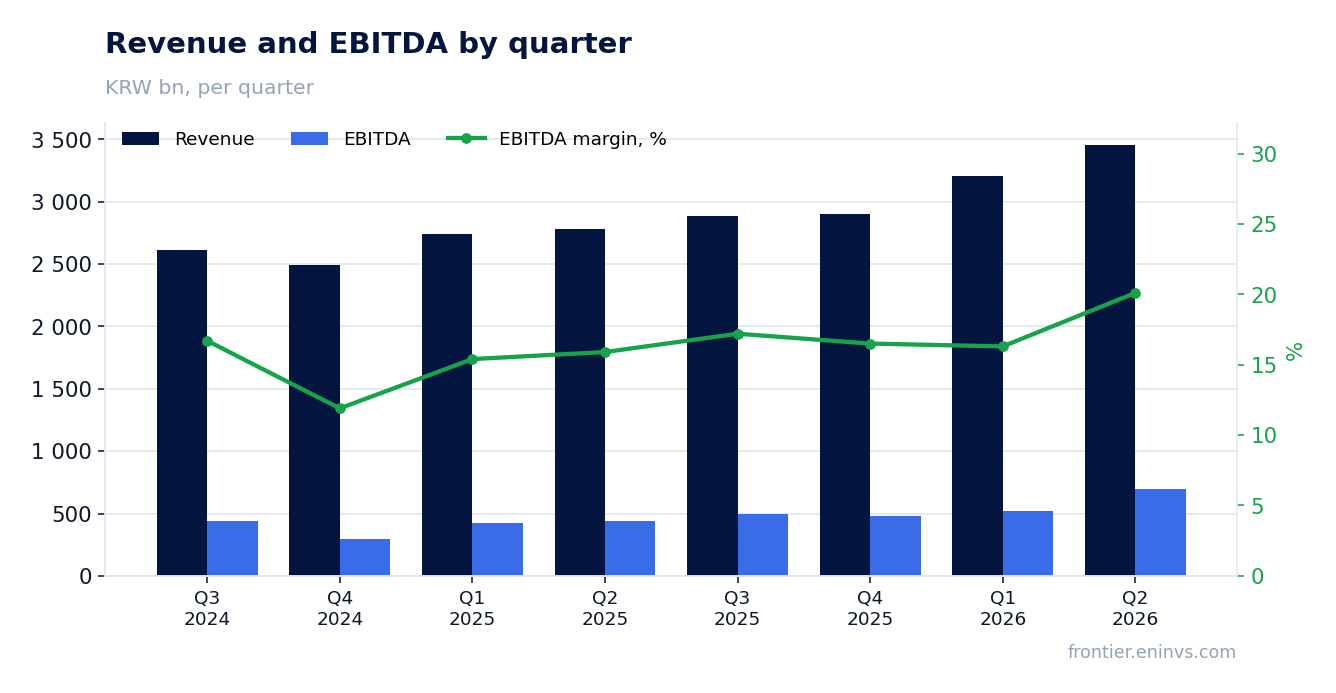
— Q2 2026 revenue grew 24.2% year on year – the fastest in the last four quarters
— Q2 2026 EBITDA margin reached 20.1% versus 15.2% a year earlier – operating leverage worked on rising demand
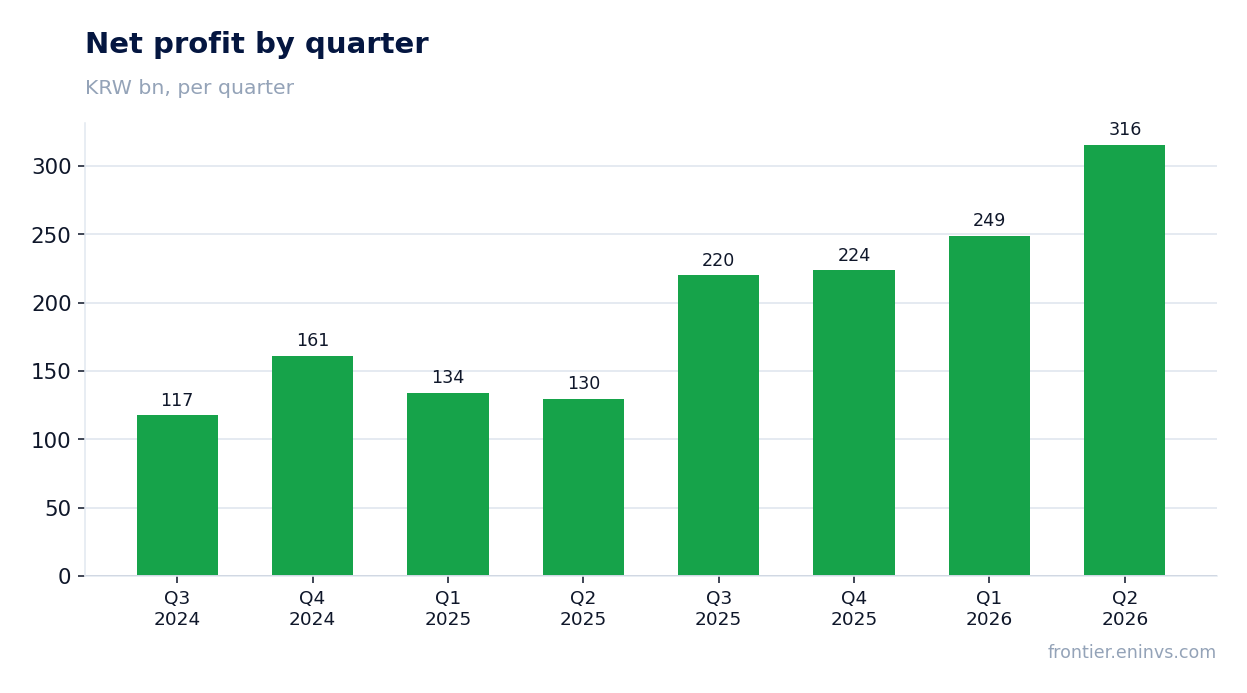
— Quarterly net profit rose 143.3% year on year, but the 9.1% net margin is still below pre-crisis levels
— Free cash flow stayed negative in Q2 2026: capex of 603.0 billion won exceeded operating cash flow of 581.2 billion
— Trailing twelve-month dividend yield is just 0.17% – payouts lag the surge in market cap
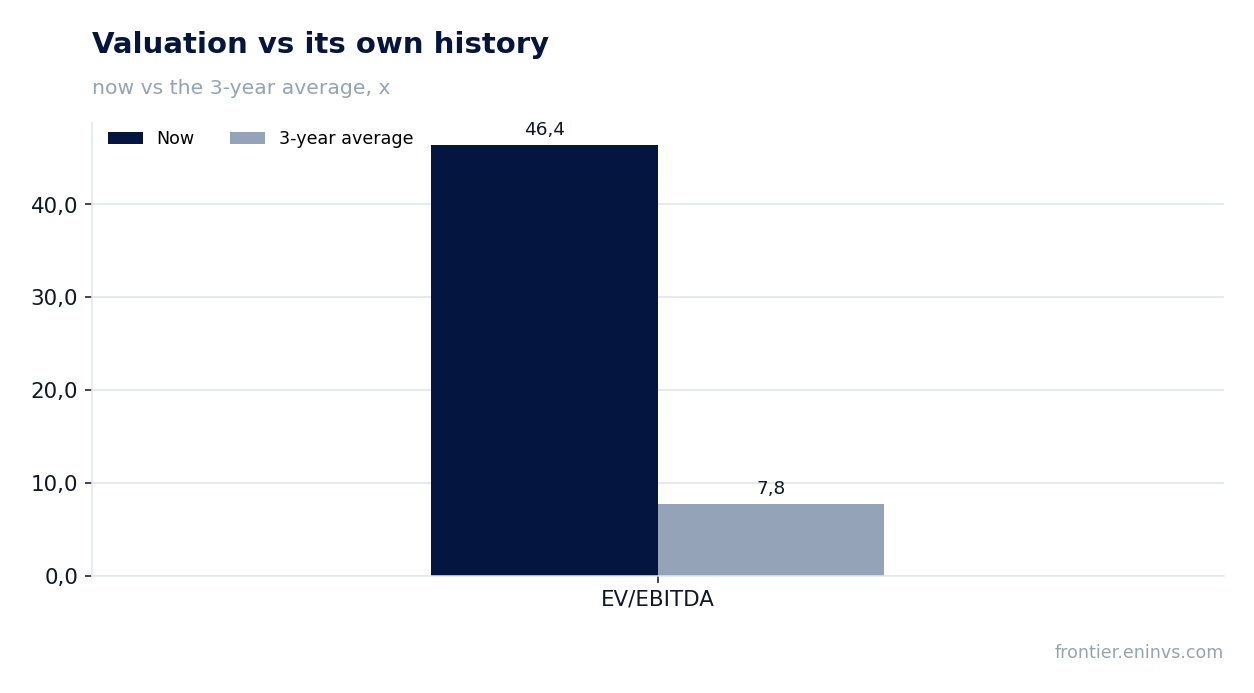
— The 46.4 EV/EBITDA multiple is nearly six times its own three-year average of 7.8 – the market prices in continued hypergrowth
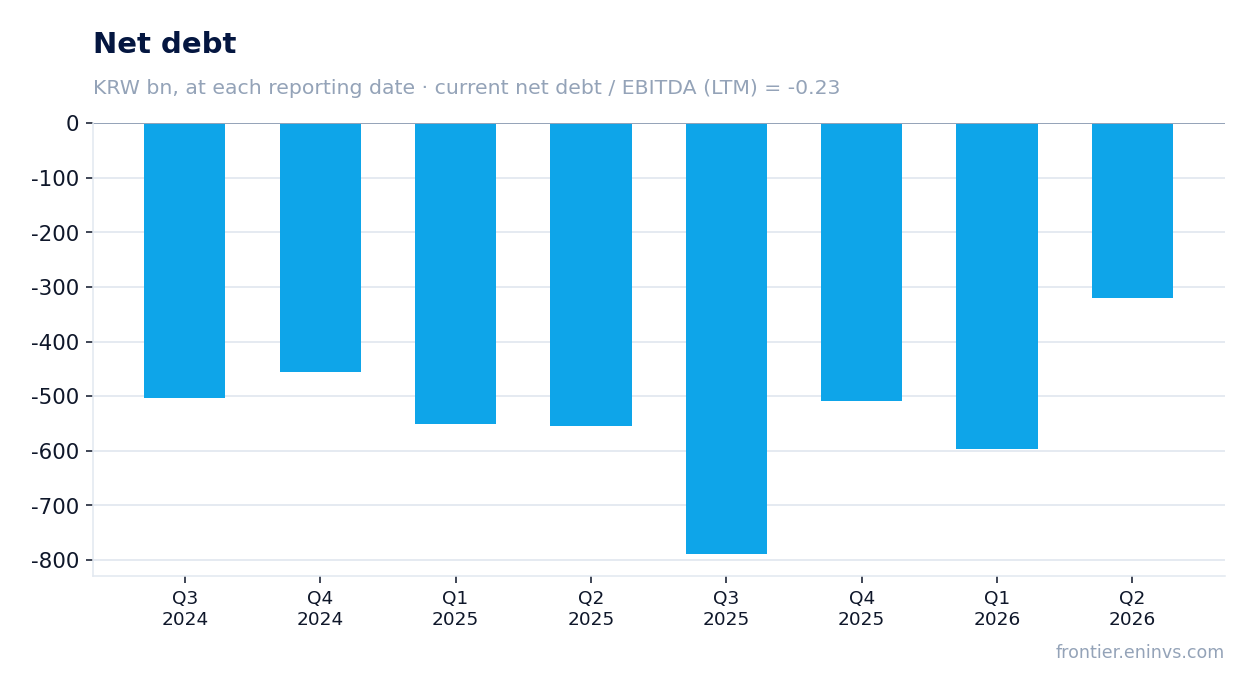
— Net debt is negative at minus 509.4 billion won, but it rose by 277.3 billion won over the quarter due to heavy investment
Attractiveness
Key figures, KRW bn
| Metric | Q2 2025 | Q2 2026 | Change |
|---|---|---|---|
| Revenue | 2 785 | 3 457 | +24.2% |
| EBITDA | 423 | 696 | +64.5% |
| Operating profit | 213 | 440 | +106.7% |
| Net profit | 130 | 316 | +143.3% |
| Operating cash flow | 359 | 581 | +61.7% |
| Capex | 276 | 603 | +118.8% |
| EBITDA margin | 15.2% | 20.1% | +4.9 pp |
| Net margin | 4.7% | 9.1% | +4.4 pp |
Q2 2026 revenue grew 24.2% year on year – the fastest in the last four quarters
In Q2 2026, Samsung Electro-Mechanics revenue reached 3,457.2 billion won, up 24.2% year on year. This acceleration continues a streak: Q1 2026 growth was 17.2%, Q4 2025 16.4%, Q3 2025 10.5%. The company has been gaining momentum for four consecutive quarters.
The main driver, judging by the trend, remains demand for smartphone and server components, although the company does not disclose revenue by segment in the report. Revenue growth is accompanied by faster EBITDA growth, indicating operating leverage.
Q2 2026 EBITDA margin reached 20.1% versus 15.2% a year earlier – operating leverage worked on rising demand
Quarterly EBITDA grew 64.5% year on year to 695.6 billion won, with EBITDA margin expanding from 15.2% to 20.1%. This is the highest in the last four quarters: Q1 2026 margin was 16.3%, Q4 2025 16.5%.
The 4.9 percentage point margin expansion stems from revenue growing faster than operating expenses. The company does not disclose cost details, but with such volume growth, fixed costs are spread over a larger base.
Quarterly net profit rose 143.3% year on year, but the 9.1% net margin is still below pre-crisis levels
Q2 2026 net profit reached 315.6 billion won, up 143.3% year on year. Net margin rose from 4.7% to 9.1% – a notable jump, but still below the 7.6% seen in Q3 2025 (quarterly net profit then was 219.9 billion won).
Profit growth outpaced EBITDA growth, suggesting a lower effective tax rate or positive non-operating items. The company does not disclose details, so the exact reason cannot be identified.
Free cash flow stayed negative in Q2 2026: capex of 603.0 billion won exceeded operating cash flow of 581.2 billion
Q2 2026 operating cash flow was 581.2 billion won, while capex reached 603.0 billion won. Thus, free cash flow was negative at minus 21.8 billion won. This is the second consecutive quarter where investments exceeded operating cash flow: in Q4 2025 the gap was even larger – 569.8 billion won capex versus 294.4 billion won operating cash flow.
The company is aggressively expanding capacity, as seen in rising capex: from 159.5 billion won in Q3 2024 to 603.0 billion won in Q2 2026. This explains the 277.3 billion won increase in net debt over the quarter, although the absolute debt level remains negative.
Trailing twelve-month dividend yield is just 0.17% – payouts lag the surge in market cap
Over the last twelve months, Samsung Electro-Mechanics paid dividends equivalent to 0.17% of current market cap. This is extremely low, especially compared to historical yield levels, which were higher in the past. The reason is the rapid rise in market capitalization to 102.1 trillion won, outpacing dividend growth.
The company does not disclose its payout policy, but at such a yield, dividends are unlikely to be a significant factor for investors. The question is how sustainable profit growth is to allow higher payouts in the future.
The 46.4 EV/EBITDA multiple is nearly six times its own three-year average of 7.8 – the market prices in continued hypergrowth
The current EV/EBITDA multiple is 46.4 versus the three-year average of 7.8. This means the market values the company at a premium of nearly six times its own history. Even with accelerating revenue and margin growth, such a valuation looks extreme.
The trailing twelve-month P/E of 101.2 also indicates that investors are paying for future growth rather than current results. According to the portal's model, the upside to fair value is +15%, which is far below the current premium to history.
Net debt is negative at minus 509.4 billion won, but it rose by 277.3 billion won over the quarter due to heavy investment
At the end of Q2 2026, net debt stood at minus 509.4 billion won, meaning cash exceeded debt. However, over the quarter net debt rose by 277.3 billion won – the company is spending more than it generates amid an investment cycle.
The net debt to EBITDA ratio for the trailing twelve months is minus 0.23 – the company remains a net creditor. But if capex continues to grow at this pace, the safety margin will shrink.
Valuation on the latest reported figures
| Metric | Value |
|---|---|
| Market cap | 102 062 bn KRW |
| P/E (LTM) | 101.2 |
| EV/EBITDA (LTM) | 46.4 |
| P/B | 10.42 |
| Net debt / EBITDA (LTM) | -0.23 |
| Operating cash flow (LTM) | 1 490 bn |
| ROE | 12.2% |
| Dividend yield (12m) | 0.2% |
| EV/EBITDA, 3-year average | 7.8 |
Bottom line
The Q2 2026 report is strong: revenue accelerated to +24.2%, EBITDA margin reached 20.1%, and net profit grew 143.3%. However, free cash flow is negative due to heavy investment, and dividend yield is minimal. The key question for a holder is whether the current valuation of 46.4 EV/EBITDA justifies expectations of future growth, given that its own three-year average is only 7.8.
Open the company's financial profile 009150 →
See also: market overview · valuation map · stock screeners