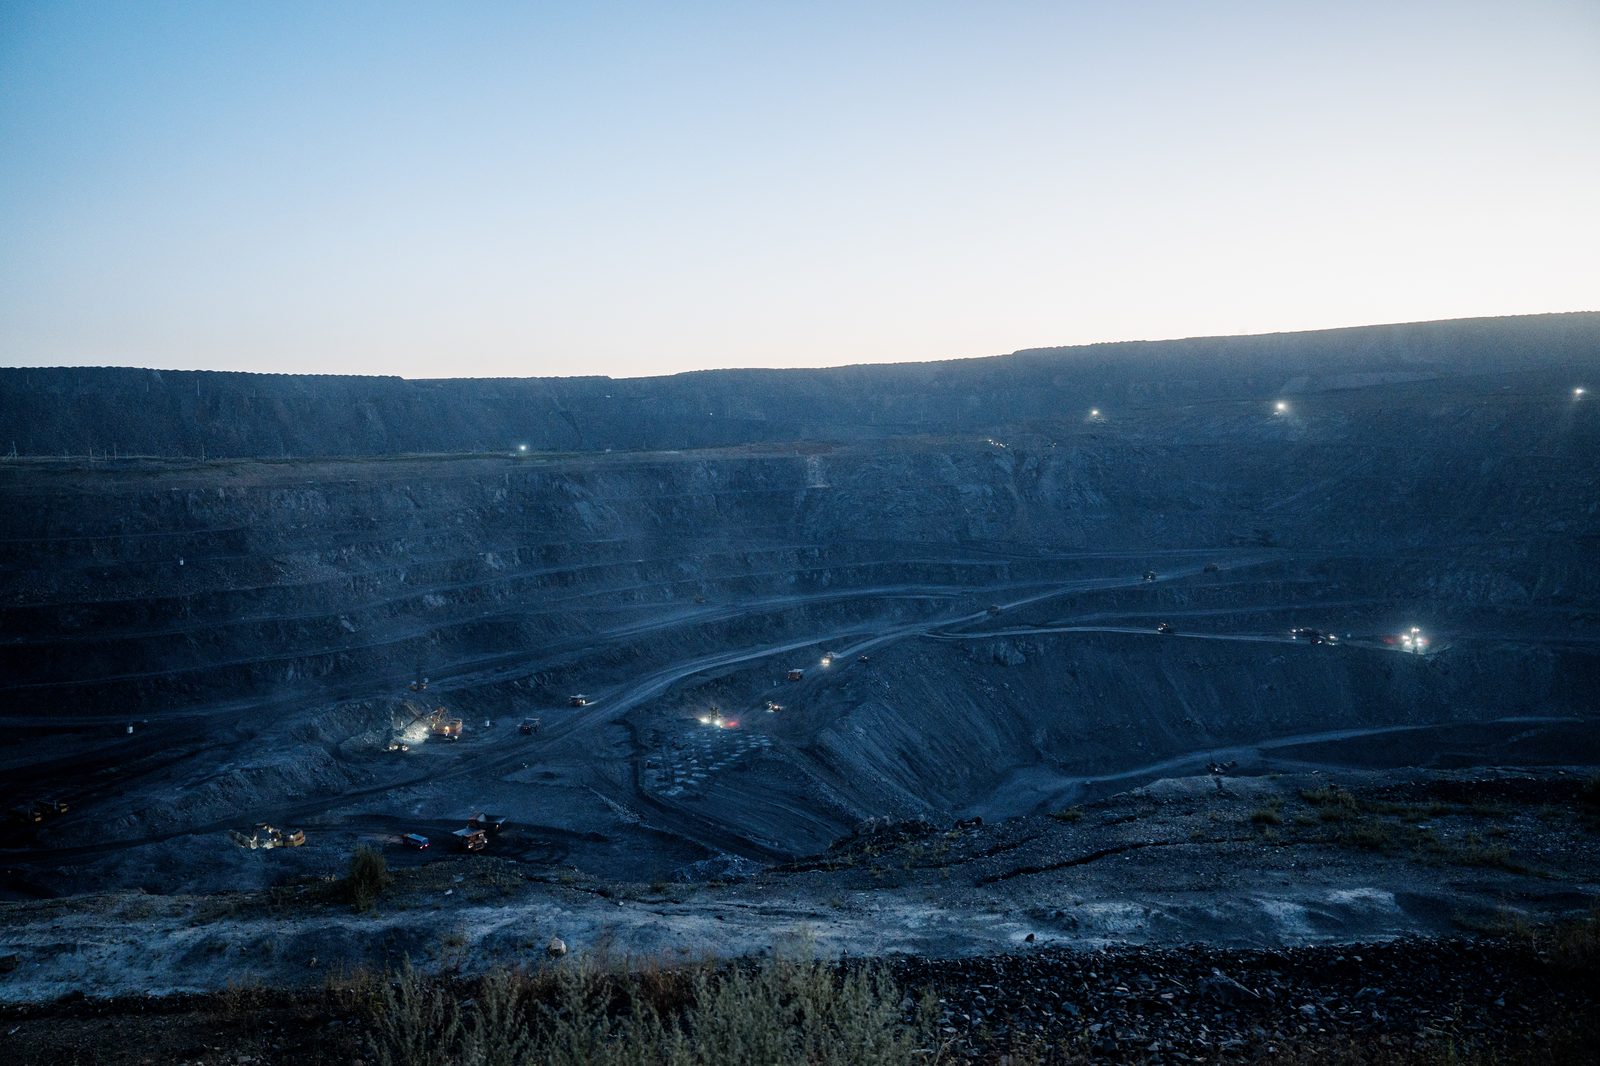
Solidcore Resources plc is a gold mining company that operates in Kazakhstan, focusing on the extraction and processing of gold ore at its own mines and processing facilities.
Sector: Gold mining
SOLIDCORE
Net debt (table and EV/EBITDA): |short-term borrowings| + |long-term borrowings| + |other financial liabilities| when extracted + |non-controlling interest| when extracted − |cash and equivalents|; amounts in millions of the reporting currency.
Shares: connector/market_inputs
Monetary columns are in M USD, one decimal; scale (K/M/B/T) keeps values readable. For the period (default) shows P&L and cash flow for that row’s reporting window: quarterly amounts when the feed uses quarter-duration facts (typical US 10-Q revenue and income), quarterly cash flows after stripping YTD where only cumulative tags exist, and an implied Q4 on 31 Dec FY rows (P&L: FY minus Q1–Q3; operating / investing cash flow: FY 12m minus 9M YTD to 30 Sep when sourced from SEC builder evidence) so they match 10-Q scale. Some issuers still use cumulative YTD minus the prior row in the same calendar year. As reported shows values stored on each row (e.g. full-year on FY). Balance sheet is always as reported. Source JSON may use millions etc.; conversion uses amounts_unit per row.
| Date | Period | Status | RevenueM USD | Operating profitM USD | D&AM USD | EBITDAM USD | Net profitM USD | Operating CFM USD | Capex + M&AM USD | AssetsM USD | EquityM USD | ROE (annualized) | Net debtM USD | Source |
|---|---|---|---|---|---|---|---|---|---|---|---|---|---|---|
| 2026-06-30 | H1 2026 (6M) | OK | 972.0 y/y 199.1% | 596.0 y/y 369.3% | 45.0 y/y 80.0% | 641.0 y/y 321.7% | 453.0 y/y 432.9% | 436.0 | -193.0 | 3256.0 y/y 59.6% | 2733.0 y/y 70.0% | 36.7% | -653.0 | Link |
| 2025-12-31 | H2 2025 (6M) | OK | 1175.0 y/y 88.3% | 762.0 y/y 140.4% | 58.0 y/y -41.4% | 820.0 y/y 97.1% | 577.0 y/y 133.0% | 689.0 | -127.0 | 2699.0 y/y 30.4% | 2202.0 y/y 45.3% | 34.8% | -464.0 | Link |
| 2025-06-30 | H1 2025 (6M) | OK | 325.0 y/y -53.8% | 127.0 y/y -56.5% | 25.0 y/y — | 152.0 y/y -48.0% | 85.0 y/y -64.3% | -86.0 | -128.0 | 2040.0 y/y — | 1608.0 y/y — | 10.9% | -143.0 | Link |
| 2024-12-31 | H2 2024 (6M) | OK | 624.0 y/y — | 317.0 y/y — | 99.0 y/y — | 416.0 y/y — | -1750.0 y/y — | -518.0 | 191.0 | 2069.0 y/y -67.1% | 1515.0 y/y -32.8% | — | -374.0 | Report (PDF) |
| 2024-06-30 | H1 2024 (6M) | PARTIAL | 704.0 y/y — | 292.0 y/y — | 0.1 y/y — | 292.1 y/y — | 238.0 y/y — | 517.0 | -470.0 | — y/y — | — y/y — | — | ≈ -772.0 | Report (PDF) |
| 2023-12-31 | FY 2023 (12M) | PARTIAL | 893.0 y/y — | 347.0 y/y — | 93.0 y/y — | 440.0 y/y — | 272.0 y/y — | — | — | 6280.0 y/y — | 2253.0 y/y — | — | -772.0 | Report (PDF) |
| Short-term debt (incl. ST leases) | 75 |
| Long-term debt (incl. LT leases) | 150 |
| − Cash & equivalents | 878 |
| Net debt | -653 |
|---|
Net debt / LTM EBITDA: -0.4x
Quarterly values ($ mln)
Year-over-year change
Operating and investing cash flow (OCF + ICF) ($ mln)
Net debt / cash ($ mln)
| year | 2024 | 2025 |
|---|---|---|
| cash flow / profit | — | 0.91x |
| accruals, % of assets | -112.9% | 2.2% |
Our earnings breakdowns and investment notes on this issuer.
Physical operating metrics — supplementary, not part of the financial statements
Gold
| Year | Reserves, Moz GEO |
|---|---|
| 2025 | 12.15 |
| Year | Production, koz GEO |
|---|---|
| 2025 | 395 −19.4% |
| 2024 | 490 +1.2% |
| 2023 | 484 |
Solidcore Resources plc (ex-Polymetal Kazakhstan) FY2024: 490 koz GE produced (484 koz 2023); JORC proved+probable reserves 12.147 Moz GE at 1 Jan 2025 (Kyzyl + Varvara). FY2025: 395 koz GE produced (-19%, Kyzyl concentrate delayed at third-party POX); 2026 guidance ~540 koz GE (Q4/FY2025 production release 30.01.2026).
Current 3 984spot vs LTM -8%
Target market cap from conservative EBITDA and the historical EV/EBITDA
Upside: -18.3%
Main driver: Gold -6% vs LTM; revenue ×0.92 vs costs ×1.14; EBITDA 1 461→1 064; at 3.9× EV/EBITDA → -18%.
Product prices — moves vs the LTM average
| Commodity | Share | Spot | LTM | 3-yr | vs LTM, $ | 3y vs LTM |
|---|---|---|---|---|---|---|
| Gold (rev) | +82% | 3 983.52 | 4 242.24 | 3 408.64 | -6% | -20% |
| Silver (rev) | +15% | 50.58 | 62.30 | 45.21 | -19% | -27% |
How it is calculated — revenue → costs → EBITDA → target market cap
| 1 · Reported baseline (LTM) | |
| LTM revenue | 2 147 |
| LTM EBITDA | 1 461 |
| LTM cash costs (revenue − EBITDA) | 686 |
| 2 · Revenue projection | |
| Revenue multiplier — spot | ×0.922 (-8%) |
| = Spot revenue | 1 979 |
| Revenue multiplier — 3y price | ×0.798 (-20%) |
| = 3-year-price revenue | 1 713 |
| 3 · Costs projection | |
| Cost multiplier — spot | ×1.140 (+14%) |
| = Spot cash costs | 782 |
| Cost multiplier — 3y price | ×1.140 (+14%) |
| = 3-year-price cash costs | 782 |
| 4 · EBITDA projection (revenue − costs) | |
| = Spot EBITDA | 1 197 |
| = 3-year-price EBITDA | 931 |
| Conservative EBITDA = min(spot, avg) | 1 064 |
| 5 · Valuation → target market cap | |
| Historical EV/projected-EBITDA (75th pct) | 3.9x |
| Target EV = EV/EBITDA × conservative EBITDA | 4 150 |
| Net debt | -653 |
| Target market cap = EV − net debt | 4 803 |
| Current market cap | 5 876 |
Upside = target market cap ÷ current − 1 = -18.3%
Projected EV/EBITDA 4.0x · target 75th pct (3y) 3.9x · LTM avg 3.4x
Group: Gold mining. Each peer is shown as it trades and re-priced onto this company's market (Kazakhstan) by the ratio of our coverage medians.
| Company | Market | Cap, $bn | EV/EBITDA | EV/EBITDA, adjusted |
|---|---|---|---|---|
| IAMGOLD | global | 9.6 | 4.3x | 3.4x |
| Kinross Gold | global | 25.9 | 4.4x | 3.5x |
| Harmony Gold | South Africa | 9.9 | 3.5x | 3.9x |
| Barrick Mining Corporation | global | 64.8 | 5.0x | 3.9x |
| Coeur Mining | global | 9.0 | 5.5x | 4.4x |
| Newmont Corporation | global | 121.8 | 7.1x | 5.6x |
| Evolution Mining | Australia | 16.9 | 7.7x | 6.0x |
| AngloGold Ashanti | South Africa | 43.0 | 5.6x | 6.3x |
| Alamos Gold | global | 12.2 | 8.0x | 6.4x |
| Agnico Eagle Mines | global | 88.3 | 8.4x | 6.6x |
| Northern Star Resources | Australia | 25.5 | 8.6x | 6.8x |
| Hecla Mining Company | global | 9.7 | 10.0x | 8.0x |
| Group median | 6.3x | 5.8x | ||
| Group average | 6.5x | 5.4x | ||
| This company | Kazakhstan | 5.9 | 3.6x | 3.6x |
Group median 6.3x as traded, 5.8x adjusted; this company 3.6x — a 39% discount.
Group average 6.5x as traded, 5.4x adjusted; against the average this company is at a 34% discount.
At the adjusted group median the market cap would be +58% versus today.
The gap and the implied upside are measured against the median: one richly priced peer moves an average, not a median. The market adjustment uses our coverage medians (US 20.1x, Russia 3.8x, South Africa 5.5x, Kazakhstan 6.2x, India 17.7x, Indonesia 4.6x); it is about where a name is listed, not what it does. Peer multiples come from the nightly rebuild of 2026-10-30; the company's own is live.
No dividend rows found for this issuer (checked: KASE news).
Investor reporting (IR): https://www.solidcore-resources.com/en/investors-and-media/reports-and-results/result-centre/
Reporting forms detected in loaded periods: ✓ ✓ ✓ (Balance sheet / Profit or loss (P&L) / Cash flows)
Financial results, valuation multiples (P/E, P/B, EV/EBITDA), profitability and dividend yield of Solidcore Resources plc — from primary filings.
See also: Gold Mining Stocks: The Cheapest Gold Miners by Valuation (2026) · The Cheapest Stocks in the World (2026): What Value Investing Says About Buying Cheap · global valuation map