Discovery: profit up 38%, but operating cash flow is not the story
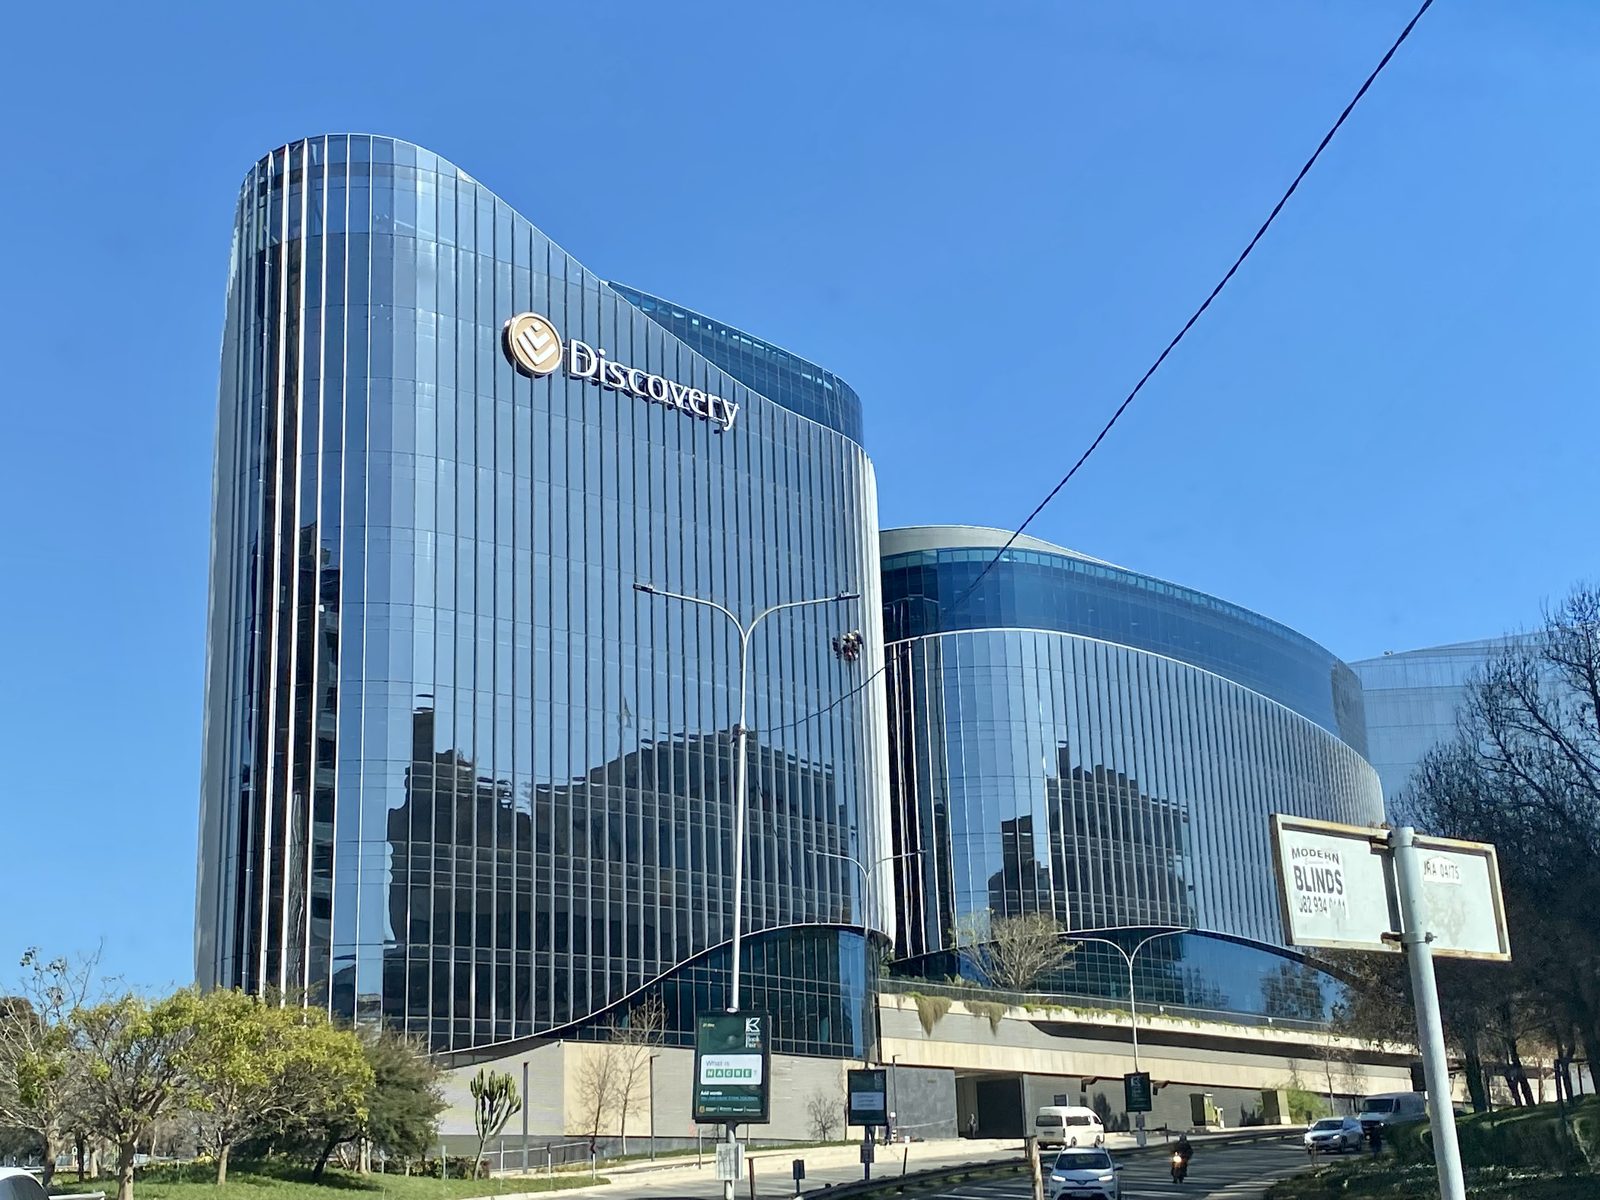
On August 28, Discovery reported results for the fiscal year ended June 30, 2026. Revenue rose 4.6%, EBITDA 36.3%, and net profit 38.2%. At the current price, the share looks attractive: margin expansion and profit growth are supported by a moderate valuation, with the portal's model showing +7% upside.
Key takeaways
— EBITDA margin expanded from 20.3% to 26.5% – the key driver of the report
— Net profit grows faster than revenue thanks to operating leverage
— Operating cash flow does not reflect performance – at a bank it depends on client balances
— P/E of 13.2 – below its three-year average, with the portal's model showing +7% upside
— Dividend yield of 1.2% – modest but backed by profit growth
Attractiveness
Key figures, ZAR bn
| Metric | FY 2025 | FY 2026 | Change |
|---|---|---|---|
| Revenue | 81.9 | 85.8 | +4.6% |
| EBITDA | 16.6 | 22.7 | +36.3% |
| Operating profit | 17.0 | 20.4 | +20.1% |
| Net profit | 9.56 | 13.2 | +38.2% |
| Capex | 1.98 | 6.04 | +205.8% |
| EBITDA margin | 20.3% | 26.5% | +6.2 pp |
| Net margin | 11.7% | 15.4% | +3.7 pp |
EBITDA margin expanded from 20.3% to 26.5% – the key driver of the report
For the fiscal year ended June 30, 2026, EBITDA grew 36.3% while revenue rose only 4.6%. The gap in growth rates produced a jump in margin: 26.5% versus 20.3% a year earlier. This means profit growth is driven not so much by business expansion as by efficiency – the company earns more from each rand of revenue.
The source of the leverage is not disclosed in the report, but for an insurer and bank this is typical: operating expenses grow slower than premiums and fees. If this pace continues, the margin may stay elevated, but that requires sustained revenue growth.
Net profit grows faster than revenue thanks to operating leverage
Net profit for the reporting period grew 38.2% – nearly ten times faster than revenue. Net profit as a share of net interest income rose from 11.7% to 15.4%. This is not a margin or profitability ratio, but it shows how much the bank retains from its core income after all expenses.
Profit growth with modest revenue dynamics is a direct consequence of operating leverage: fixed costs are spread over a larger volume of business. The question is how sustainable this effect is – if revenue slows, the margin could compress.
Operating cash flow does not reflect performance – at a bank it depends on client balances
For the trailing twelve months, operating cash flow was 7,000 million – but for a bank and insurer this figure has no relation to earned profit. It reflects movements in client funds and central counterparty positions, so it can be anything – and it is not a signal to buy or sell.
We deliberately do not use this metric in our assessment. To understand business quality, profit growth and margins matter more than volatile cash flow, which for financial companies depends on external factors.
P/E of 13.2 – below its three-year average, with the portal's model showing +7% upside
The current P/E LTM is 13.2 – below its three-year average, indicating the stock is relatively cheap. Market capitalization is 174,827.9 million.
According to the portal's model, which compares annualized earnings to market cap, the fair value of the share is +7% above the current price. This is our own calculation, not market consensus, and it confirms the stock is not overvalued.
Dividend yield of 1.2% – modest but backed by profit growth
The trailing dividend yield is 1.2% – modest for an income-seeking investor. However, payouts grow along with profit: with ROE of 18.0%, the company earns enough to support both dividends and reinvestment.
For a growth stock this is an acceptable level – the investor derives the main return from price appreciation, not from the coupon. If profit continues to grow, the dividend base will expand, and the yield on invested capital will increase over time.
Valuation on the latest reported figures
| Metric | Value |
|---|---|
| Market cap | 175 bn ZAR |
| P/E (LTM) | 13.2 |
| P/B | 2.11 |
| ROE | 18.0% |
| Dividend yield (12m) | 1.2% |
Bottom line
Discovery's fiscal year results are strong: EBITDA margin rose from 20.3% to 26.5%, net profit grew 38.2%, and the share of profit in net interest income reached 15.4%. The growth is driven by operating leverage, not one-off factors, making the results sustainable. With a P/E of 13.2 and +7% upside on the portal's model, the share looks attractive. The main question for a holder is whether the company can maintain its margin if revenue slows. As long as the answer is positive, the share remains among our preferences.
Open the company's financial profile DSY →
See also: market overview · valuation map · stock screeners