Netcare: double-digit profit growth, but debt and dividends demand attention
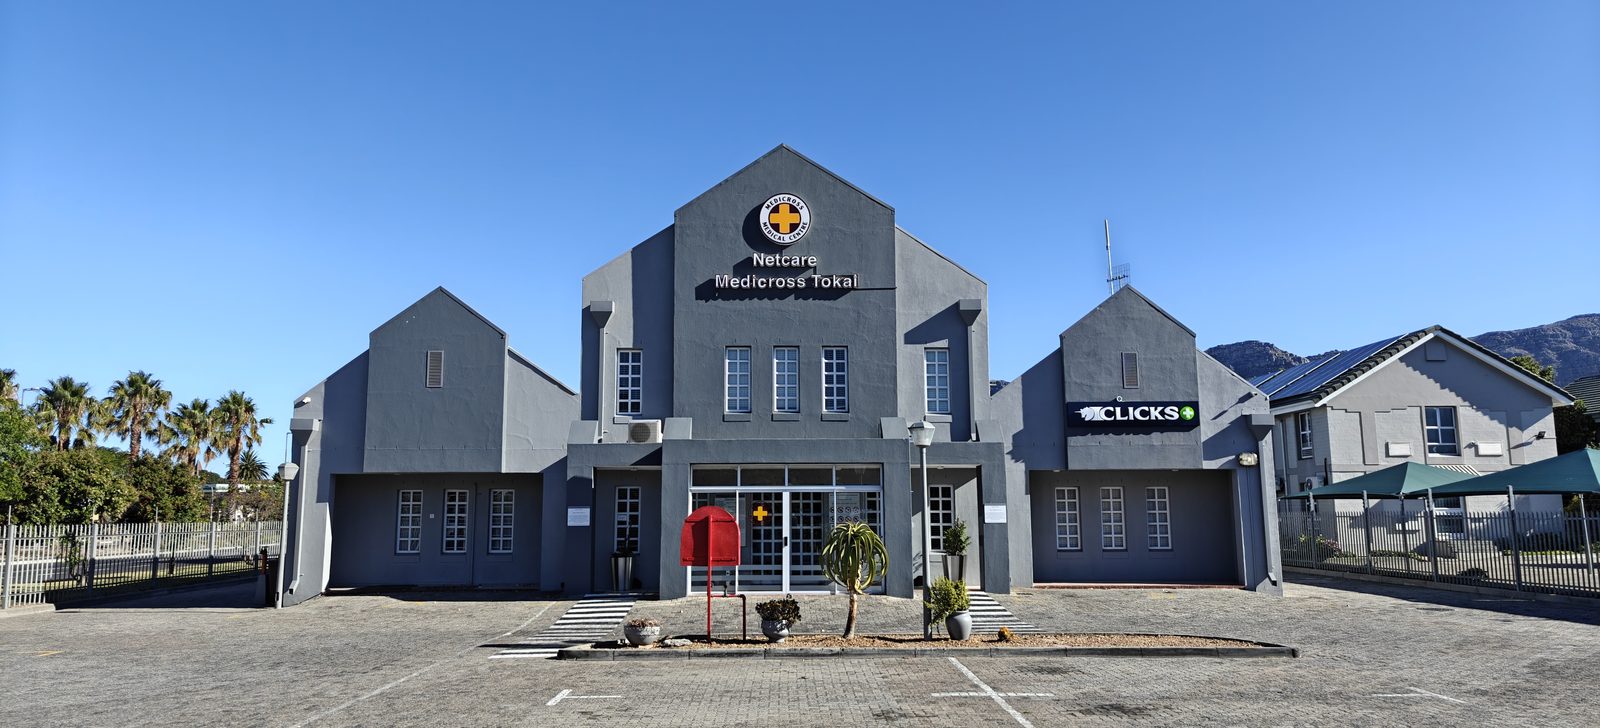
On August 25, Netcare released its results for the first half of 2026. Revenue grew by 4.8% year-on-year, EBITDA by 7.5%, and net profit by 12.8%. The EBITDA margin rose to 16.9%, and the net margin to 6.7%. Leverage remains moderate: the net debt to EBITDA ratio for the last twelve months is 1.06. The dividend yield over the last twelve months is 5.1%. According to our model, the fair value of the share is 8% above the current price. Given steady profit growth and dividend payouts, the share looks attractive for income-oriented investors.
Key takeaways
— Revenue grew by 4.8% year-on-year to ZAR 26.9 billion over the last twelve months, driven by steady demand for services
— EBITDA increased by 7.5% year-on-year, with the margin rising to 16.9% in the first half of 2026
— Net profit added 12.8% year-on-year, with the net margin reaching 6.7% in the first half of 2026
— Leverage remains moderate: the net debt to EBITDA ratio for the last twelve months is 1.06
— The dividend yield over the last twelve months is 5.1%, above the key rate
— According to the portal's model, the fair value of the share is 8% above the current market price
— The P/E ratio for the last twelve months is 11.3, below the historical average
Attractiveness
Key figures, ZAR bn
| Metric | H1 2025 | H1 2026 | Change |
|---|---|---|---|
| Revenue | 12.7 | 13.3 | +4.8% |
| EBITDA | 2.08 | 2.24 | +7.5% |
| Operating profit | 1.63 | 1.76 | +7.8% |
| Net profit | 0.79 | 0.89 | +12.8% |
| Operating cash flow | 1.16 | 0.74 | -36.4% |
| Capex | 0.41 | 0.41 | +1.7% |
| EBITDA margin | 16.4% | 16.9% | +0.5 pp |
| Net margin | 6.2% | 6.7% | +0.5 pp |
Revenue grew by 4.8% year-on-year to ZAR 26.9 billion over the last twelve months, driven by steady demand for services
In the first half of 2026, Netcare's revenue increased by 4.8% year-on-year. Over the last twelve months, it amounted to ZAR 26.9 billion. The growth was driven by both higher volumes of services rendered and tariff increases.
The company does not disclose segment details, but steady demand for medical services in South Africa supports the dynamics. Revenue is growing slower than profit, indicating improved operational efficiency.
EBITDA increased by 7.5% year-on-year, with the margin rising to 16.9% in the first half of 2026
EBITDA for the first half of 2026 grew by 7.5% year-on-year. The EBITDA margin was 16.9% versus 16.4% a year earlier. The margin expansion was driven by revenue growing faster than costs.
Over the last twelve months, EBITDA amounted to ZAR 5.16 billion. The company demonstrates the ability to improve profitability even with moderate revenue growth, which positively affects cash flow.
Net profit added 12.8% year-on-year, with the net margin reaching 6.7% in the first half of 2026
Net profit for the first half of 2026 increased by 12.8% year-on-year. The net margin rose to 6.7% from 6.2% a year earlier. The faster growth of profit relative to revenue is due to improved operational efficiency and possibly lower financial expenses.
Over the last twelve months, net profit amounted to ZAR 1.84 billion. Profit growth supports dividend payouts and strengthens equity. Return on equity (ROE) over the last twelve months was 16.3%.
Leverage remains moderate: the net debt to EBITDA ratio for the last twelve months is 1.06
Net debt at the latest reporting date was ZAR 5.48 billion. The net debt to EBITDA ratio for the last twelve months is 1.06. This is a comfortable level for the company, allowing it to service debt without excessive pressure on cash flow.
Over the last twelve months, net debt increased by ZAR 0.5 billion. Operating cash flow over the last twelve months was ZAR 2.4 billion, covering interest payments and supporting financial stability.
The dividend yield over the last twelve months is 5.1%, above the key rate
The dividend yield over the last twelve months is 5.1%. This is above the current key rate, making the share attractive for income-oriented investors. The company pays dividends from net profit, which over the last twelve months amounted to ZAR 1.84 billion.
Our forecast for the current year's dividend assumes the payout ratio remains at last year's level and profit grows. The expected dividend could be around ZAR 1.1 billion, which at the current price gives a yield of about 5.3%. The forecast depends on profit and possible one-off factors.
According to the portal's model, the fair value of the share is 8% above the current market price
Our valuation model, based on EBITDA growth and a target multiple, shows that the fair value of Netcare's share is 8% above the current market price. This indicates upside potential for investors.
The current EV/EBITDA multiple for the last twelve months is 5.11, below the historical average. The P/E for the last twelve months is 11.3. Relatively low multiples combined with profit growth and dividend yield make the share attractive.
The P/E ratio for the last twelve months is 11.3, below the historical average
The P/E ratio for the last twelve months is 11.3. This is below the average historical value over the last three years, which may indicate the share is undervalued relative to its own history.
Given profit growth and a stable dividend, the current valuation looks attractive. However, risks related to regulation and competition in the healthcare sector should be considered.
Valuation on the latest reported figures
| Metric | Value |
|---|---|
| Market cap | 20.9 bn ZAR |
| P/E (LTM) | 11.3 |
| EV/EBITDA (LTM) | 5.1 |
| P/B | 1.92 |
| Net debt / EBITDA (LTM) | 1.06 |
| Operating cash flow (LTM) | 2.40 bn |
| ROE | 16.3% |
| Dividend yield (12m) | 5.1% |
Bottom line
Netcare delivered strong results for the first half of 2026: revenue and profit are growing, margins are improving, and leverage is moderate. The dividend yield is above the key rate, and multiples are below historical averages. According to our model, the share is undervalued by 8%. The key question for a holder is the sustainability of profit growth and the company's ability to maintain dividends at the current level.
Open the company's financial profile NTC →
See also: market overview · valuation map · stock screeners