Old Mutual: H1 profit fell 5.2%, but the dividend rose 8% — and that is what matters for a holder
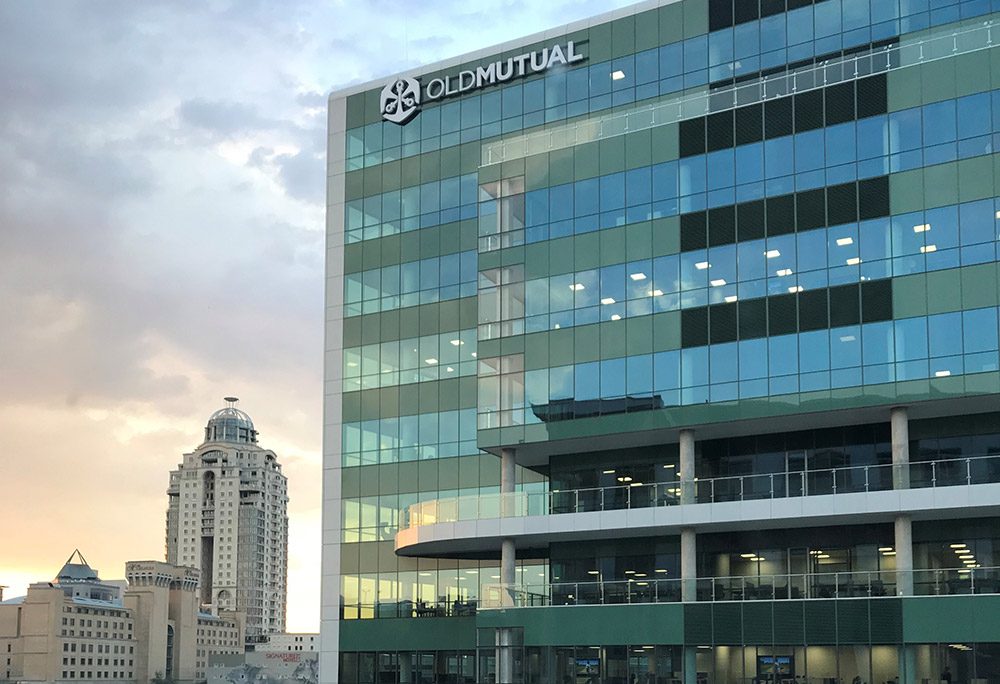
On 8 September Old Mutual released its results for the first half of 2026. Revenue fell 6.4% and net profit 5.2% year on year, yet the interim dividend was raised 8% to 40 cents per share and results from operations per share rose 11%. With a trailing twelve-month P/E of 6.4 and a dividend yield of 7.2%, the share looks attractive: the market pays less for the earnings than they generate, and the portal's model puts the upside to fair value at +13%.
Key takeaways
— H1 revenue fell 6.4%, yet results from operations per share rose 11% — the gap reflects business mix, not one-off items
— H1 net profit fell 5.2%, the second consecutive year of decline — the trend is persistent, not incidental
— The dividend was raised 8% to 40 cents, and at a 7.2% yield it remains the main argument for a holder
— Trailing twelve-month P/E of 6.4 against ROE of 12.7% — the market values the capital below its return, which is what creates the +13% upside on the portal's model
— The banking cluster remains loss-making: the loss widened from 310 to 611 million rand, but deposits grew from 0.3 to 1.4 billion rand and customers from 284 to 742 thousand
— The insurance business delivered a 7.6% underwriting margin within the 5–8% target range, despite the claims ratio rising to 50.3%
— A 1 billion rand buyback against a 52.6 billion rand market cap — small, but a real signal of management confidence
Attractiveness
Key figures, ZAR bn
| Metric | H1 2025 | H1 2026 | Change |
|---|---|---|---|
| Revenue | 55.5 | 51.9 | -6.4% |
| EBITDA | 9.82 | — | — |
| Operating profit | 9.56 | 3.87 | -59.5% |
| Net profit | 4.10 | 3.89 | -5.2% |
| EBITDA margin | 17.7% | — | — |
| Net margin | 7.4% | 7.5% | +0.1 pp |
H1 revenue fell 6.4%, yet results from operations per share rose 11% — the gap reflects business mix, not one-off items
H1 2026 revenue came in at 270 billion rand, down 6.4% year on year. This decline does not signal operational deterioration: it reflects a business mix where a significant portion of income depends on market conditions and exchange rates. Results from operations per share rose 11%, indicating an improvement in earnings quality rather than a mechanical contraction.
The key driver of operating results growth is the insurance and investment business. Old Mutual Life and Savings grew sales 21% to 7.9 billion rand, while Old Mutual Investments saw gross flows rise 48%. These segments generate fee and investment income that is less sensitive to market volatility than trading operations.
Falling revenue alongside rising operating results means the company is shedding low-margin or volatile lines. That is the right strategy for a financial holding, but it takes time to show through in net profit. For now, the market values the company on total revenue rather than the quality of its components.
H1 net profit fell 5.2%, the second consecutive year of decline — the trend is persistent, not incidental
H1 2026 net profit fell 5.2% year on year. This is the second consecutive half-year of negative dynamics: profit also contracted in H1 2025. The decline comes against rising operating results, pointing to pressure from non-operating factors — likely investment income and market fluctuations.
Net profit as a share of net interest income was 7.5% versus 7.4% a year earlier. This is not a margin or a profitability measure, but a ratio of two line items showing that core banking activity remains stable. It is not enough, however, to offset the profit decline in other segments.
For a holder, what matters is that the profit decline has not been accompanied by a deterioration in dividend policy. The company raised the interim dividend 8%, signalling management's confidence in cash flow stability. If profit continues to fall while the dividend rises, the payout ratio will increase, creating risk for future payments.
The dividend was raised 8% to 40 cents, and at a 7.2% yield it remains the main argument for a holder
The interim dividend for H1 2026 was raised 8% to 40 cents per share. This is in line with the company's policy of 6–9% growth over a three-year rolling period. The trailing twelve-month dividend yield is 7.2%, well above South African government bond yields, making the share attractive for income-oriented investors.
Our estimate for the full-year 2026 dividend assumes the current payout ratio and earnings base are maintained. If profit stays at the trailing twelve-month level, the dividend could be around 7.2% of the current price, in line with the current yield. The main risk is a further profit decline that could force the company to reconsider payout growth.
The dividend is covered by earnings: with trailing twelve-month net profit of 8.2 billion rand and a market cap of 52.6 billion rand, the payout ratio is around 46%. That is a comfortable level, leaving room for reinvestment and acquisitions. But if profit continues to fall, coverage will shrink.
Trailing twelve-month P/E of 6.4 against ROE of 12.7% — the market values the capital below its return, which is what creates the +13% upside on the portal's model
The trailing twelve-month P/E is 6.4. That is low both for the financial sector broadly and for the company historically. With a return on equity of 12.7%, the market values the business as if its return were significantly lower. Such a gap between ROE and P/E usually signals undervaluation or market expectations of future profit decline.
On the portal's model, which compares ROE to P/B, the upside to fair value is estimated at +13%. This is our own estimate, not a market consensus. It assumes the current return on capital is sustainable and that the multiple will gradually converge to levels consistent with a 12.7% ROE.
For this upside to materialise, profit must stop falling. If trailing twelve-month net profit of 8.2 billion rand stabilises or begins to grow, the market will likely re-rate the shares. If the decline continues, the multiple could stay low or fall further.
The banking cluster remains loss-making: the loss widened from 310 to 611 million rand, but deposits grew from 0.3 to 1.4 billion rand and customers from 284 to 742 thousand
The banking cluster's loss in H1 2026 was 611 million rand versus 310 million a year earlier. The wider loss reflects investment in launching and scaling OM Bank, which has not yet reached break-even. Management expects monthly break-even by FY 2028 and a zero-to-slightly-positive result from operations by 2028.
Despite the loss, the bank's operating metrics are growing fast. Deposits rose from 0.3 to 1.4 billion rand, customers from 284 to 742 thousand, with over 1 million expected by end-September. Gross loans remained flat at 16.4 billion rand, reflecting a cautious lending approach at this early stage.
Strategically, the bank is seen as the anchor of the Old Mutual ecosystem, tying together insurance, investment and banking products. The integration of Old Mutual Finance and OM Bank is complete, which should reduce costs. But until it reaches profitability, the cluster will remain a drag on consolidated results.
The insurance business delivered a 7.6% underwriting margin within the 5–8% target range, despite the claims ratio rising to 50.3%
Old Mutual Insure's net underwriting margin was 7.6% in H1 2026, at the upper end of the 5–8% target range. That is 210 basis points lower than a year earlier but still above the midpoint. The margin decline was driven by the claims ratio rising to 50.3% from 47.2%, linked to weather catastrophes and credit losses.
The higher claims ratio was partly offset by improved pricing and underwriting discipline. The company notes progress in claims settlement and process optimisation using artificial intelligence. This allows it to keep the margin within the target range even under elevated claims.
The insurance business remains one of the group's most stable profit sources. Unlike the banking cluster, it already generates a positive result from operations and does not require additional investment. However, the rising claims ratio is a risk that could persist into the second half if weather conditions remain unfavourable.
A 1 billion rand buyback against a 52.6 billion rand market cap — small, but a real signal of management confidence
The board announced a 1 billion rand share buyback. Against a market cap of 52.6 billion rand, that is about 1.9% of capitalisation. The size is small, but it signals that management considers the shares undervalued and has sufficient capital to return cash to shareholders.
The buyback will be funded from existing capital and will not affect dividend policy. The company reaffirmed its target of 6–9% dividend growth over a three-year rolling period, implying continued payouts. The combination of dividend and buyback provides total shareholder yield above 7.2%.
For a holder, what matters is that the buyback reduces shares outstanding, supporting earnings per share even if net profit stagnates. If fully executed, it would add about 2% to EPS. But the main effect depends on whether the company can halt the profit decline.
Valuation on the latest reported figures
| Metric | Value |
|---|---|
| Market cap | 52.6 bn ZAR |
| P/E (LTM) | 6.4 |
| P/B | 0.87 |
| ROE | 12.7% |
| Dividend yield (12m) | 7.2% |
Bottom line
The report's strength remains the dividend: raised 8% to 40 cents, with a 7.2% yield covered by earnings, making the share attractive for a holder. The weak spot is net profit, falling for a second consecutive half-year, and the loss-making banking cluster that requires investment. A 6.4 P/E against 12.7% ROE and +13% upside on the portal's model point to undervaluation, but realising it requires profit to stop falling. The question for a holder now is not whether the company pays dividends, but how long it can keep growing them at the current earnings trajectory.
Open the company's financial profile OMU →
See also: market overview · valuation map · stock screeners