Pick n Pay: revenue up 1% but EBITDA margin stuck at 2.3% – no profit
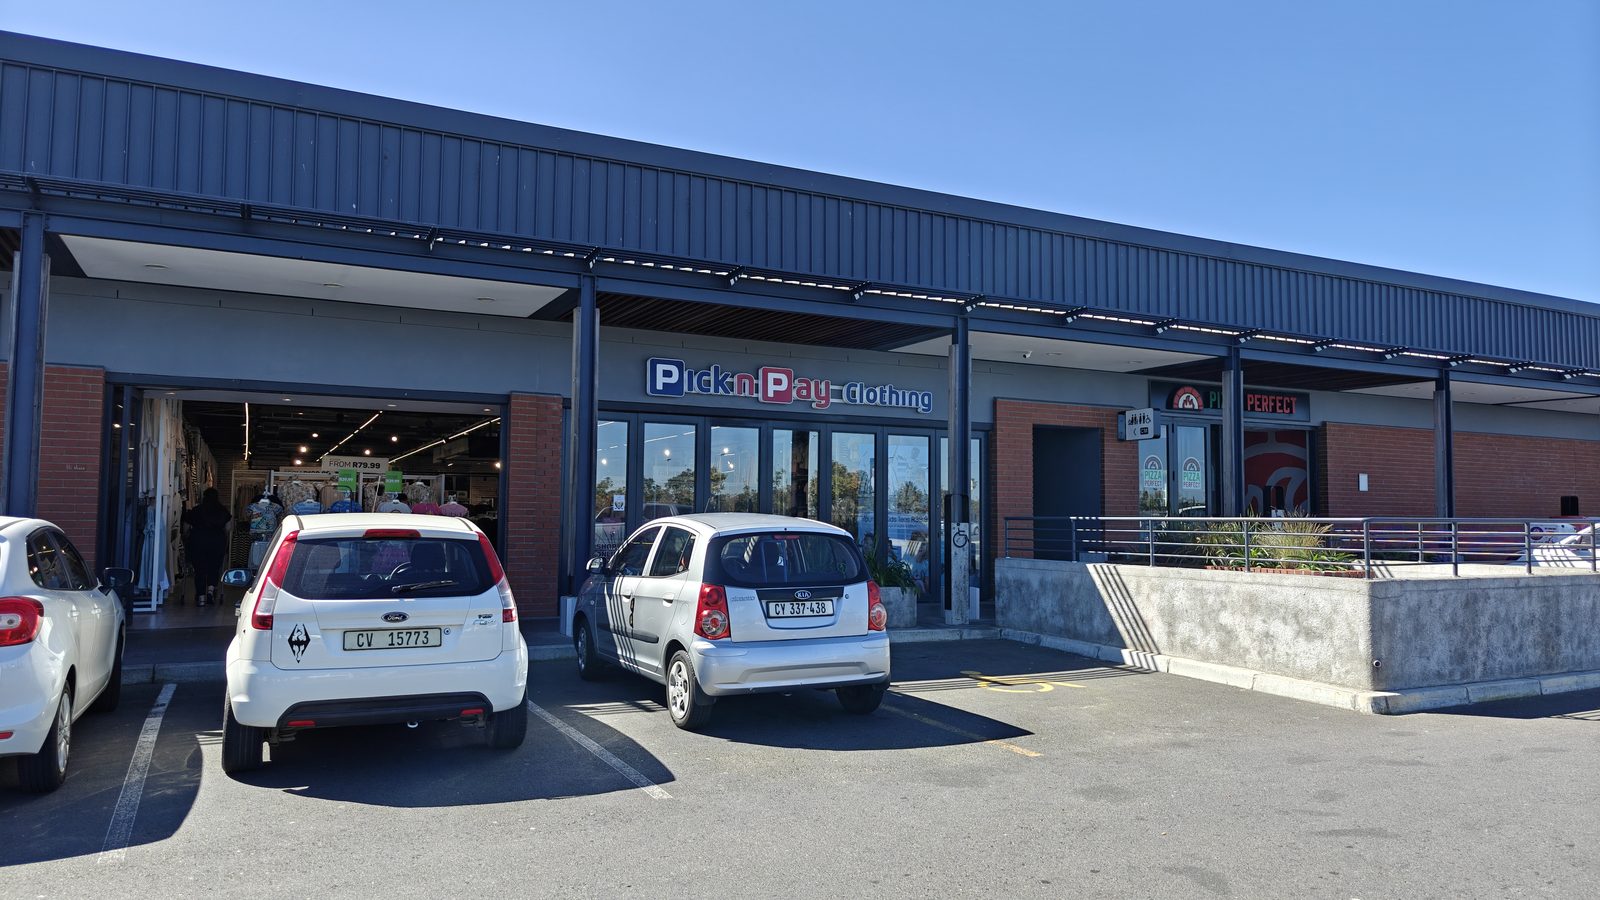
On 25 August, Pick n Pay released its results for the 2026 financial year. Revenue grew 1.0% year-on-year, EBITDA declined 0.7%, and the EBITDA margin remained at 2.3%. The net loss persisted, with a net margin of -0.6%. At the current price, the share looks unattractive: EV/EBITDA of 3.87 with negative earnings and no growth, while the portal's model indicates a 79% downside to fair value.
Key takeaways
— Revenue grew only 1.0% to ZAR 120.3 bn – not enough to turn around losses
— EBITDA fell 0.7% while the margin stayed at 2.3% – costs are rising faster than revenue
— Net loss persisted: net margin at -0.6%
— Leverage is negative: net debt of -ZAR 3.1 bn, net debt/EBITDA LTM at -1.13
— Operating cash flow over the last twelve months was ZAR 3.2 bn, insufficient to cover investments and debt service
— The portal's model estimates a 79% downside to fair value – the share is overvalued relative to fundamentals
— ROE is negative at -4.85%, confirming business inefficiency
Attractiveness
Key figures, ZAR bn
| Metric | FY 2025 | FY 2026 | Change |
|---|---|---|---|
| Revenue | 119 | 120 | +1.0% |
| EBITDA | 2.73 | 2.71 | -0.7% |
| Operating profit | -1.08 | -1.18 | — |
| Net profit | -0.74 | -0.73 | — |
| Operating cash flow | 2.14 | 3.16 | +47.4% |
| Capex | 1.68 | 1.99 | +18.9% |
| EBITDA margin | 2.3% | 2.3% | +0.0 pp |
| Net margin | -0.6% | -0.6% | +0.0 pp |
Revenue grew only 1.0% to ZAR 120.3 bn – not enough to turn around losses
For the 2026 financial year, Pick n Pay's revenue reached ZAR 120.3 bn, up 1.0% year-on-year. This growth is well below inflation, implying a decline in real sales. The company does not disclose segment details, but the overall trend points to weak consumer demand and intensifying competition.
For a low-margin retailer, even a slight shortfall in revenue growth versus inflation puts pressure on profits. In the reporting period, EBITDA fell 0.7%, confirming that revenue growth does not cover rising costs.
EBITDA fell 0.7% while the margin stayed at 2.3% – costs are rising faster than revenue
EBITDA for the 2026 financial year was ZAR 2.713 bn, down 0.7% from a year earlier. The EBITDA margin remained at 2.3%, unchanged year-on-year. This is a very low level even for food retail, where a normal margin is typically above 5%.
Stable margin with falling absolute EBITDA means revenue and costs grew almost equally, but costs had a slight edge. The company did not provide a breakdown of cost items, so it is impossible to pinpoint which line caused the decline. However, it is clear that without a significant improvement in operational efficiency, the margin will remain under pressure.
Net loss persisted: net margin at -0.6%
The net margin for the 2026 financial year was -0.6%, unchanged from the previous year. This means the company remains loss-making. With revenue of ZAR 120.3 bn, the net loss is approximately ZAR 0.7 bn.
A negative net margin alongside positive EBITDA points to significant expenses below operating profit – likely high interest payments and depreciation. The company does not disclose details, but a persistent loss undermines its ability to generate internal resources for development.
Leverage is negative: net debt of -ZAR 3.1 bn, net debt/EBITDA LTM at -1.13
Net debt at the latest reporting date was -ZAR 3.077 bn, meaning cash exceeds debt obligations. The net debt/EBITDA ratio for the last twelve months is -1.13. A negative value indicates no debt burden but a net cash position.
However, the change in net debt versus the previous reporting date was +ZAR 2.0 bn, and over the last twelve months +ZAR 1.1 bn. This means the cash buffer is shrinking. If losses and weak operating cash flow persist, liquidity could quickly dry up.
Operating cash flow over the last twelve months was ZAR 3.2 bn, insufficient to cover investments and debt service
Operating cash flow over the last twelve months was ZAR 3.2 bn. This is a positive figure, but it does not cover capital expenditures and debt repayments, if any. The company does not disclose capex, but for a retail chain they are typically significant.
With a net loss and a shrinking cash position, the ability to generate sufficient operating cash flow becomes critical. If the flow does not improve, the company will have to either cut investments or seek external financing.
The portal's model estimates a 79% downside to fair value – the share is overvalued relative to fundamentals
According to the portal's model, the fundamental value of the share implies a 79% downside from the current price. The model takes into account EBITDA growth, a target multiple, and the current market capitalisation. This is not a consensus forecast but our own estimate.
The current EV/EBITDA LTM multiple is 3.87. For a company with negative net profit and stagnating revenue, this level appears inflated. The market may be pricing in recovery expectations, but so far financial results do not support them.
ROE is negative at -4.85%, confirming business inefficiency
Return on equity (ROE) is -4.85%. This means the company is not only failing to create value for shareholders but is destroying it. A negative ROE alongside positive EBITDA indicates that debt burden and other expenses consume all operating profit.
For a potential investor, this signals that the business model requires serious restructuring. Without improving profitability and returning to profit, the shares are unlikely to be attractive at current levels.
Valuation on the latest reported figures
| Metric | Value |
|---|---|
| Market cap | 13.6 bn ZAR |
| EV/EBITDA (LTM) | 3.9 |
| P/B | 1.42 |
| Net debt / EBITDA (LTM) | -1.13 |
| Operating cash flow (LTM) | 3.20 bn |
| ROE | -4.9% |
Bottom line
Pick n Pay remains a loss-making company with a minimal EBITDA margin (2.3%) and no revenue growth (1.0%). The only positive is negative net debt, but the cash buffer is shrinking rapidly. The portal's model indicates a 79% downside, making the share unattractive for investment at current levels. A turnaround would require decisive cost-cutting and efficiency measures.
Open the company's financial profile PIK →
See also: market overview · valuation map · stock screeners