Sappi: Q3 2026 loss narrowed to $181m, but EBITDA remains negative
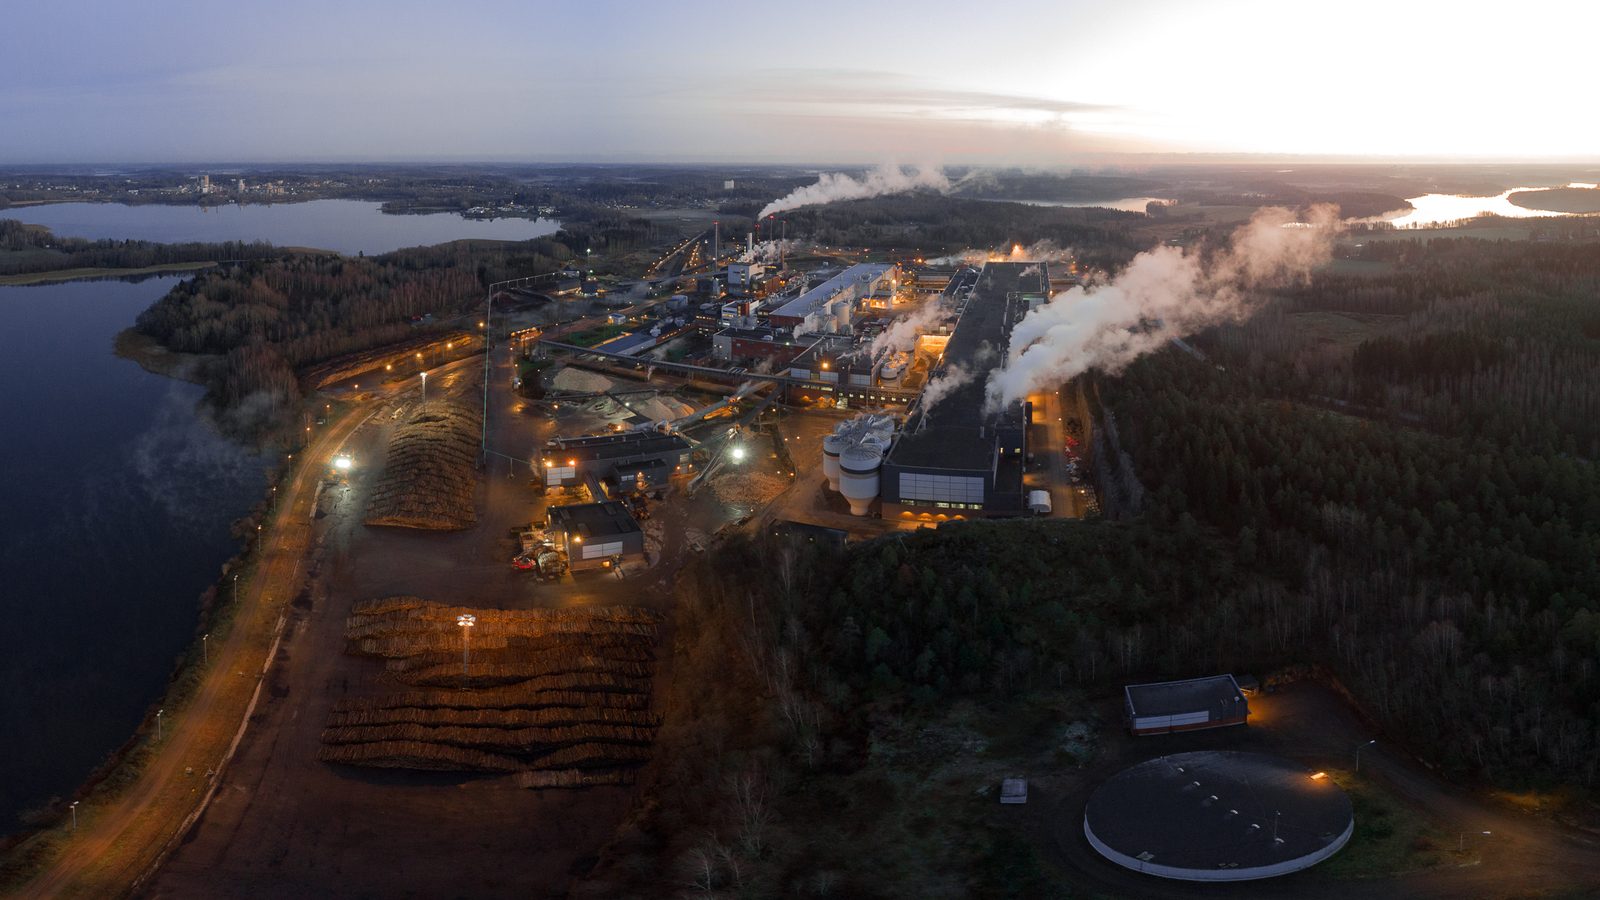
Sappi released its third-quarter 2026 results. Revenue came in at $1,334m, up 1.0% year on year, but EBITDA remained negative at -$108m versus +$88m a year earlier. The net loss narrowed to $181m from $413m in Q2 2026, yet widened from $33m a year ago. At the current price the stock looks unattractive: negative EBITDA, net debt at 3.75x EBITDA and no dividend payments leave no case for buying.
Key takeaways
— Q3 2026 revenue rose 1.0% year on year to $1,334m, but that was not enough to keep EBITDA positive
— EBITDA turned negative at -$108m versus +$88m a year earlier – a 211.0% decline
— Q3 2026 net loss was $181m, narrowing from $413m in Q2 2026 but widening from $33m a year ago
— Operating cash flow in Q3 2026 remained positive at $26m, but capital expenditure of $62m exceeded it
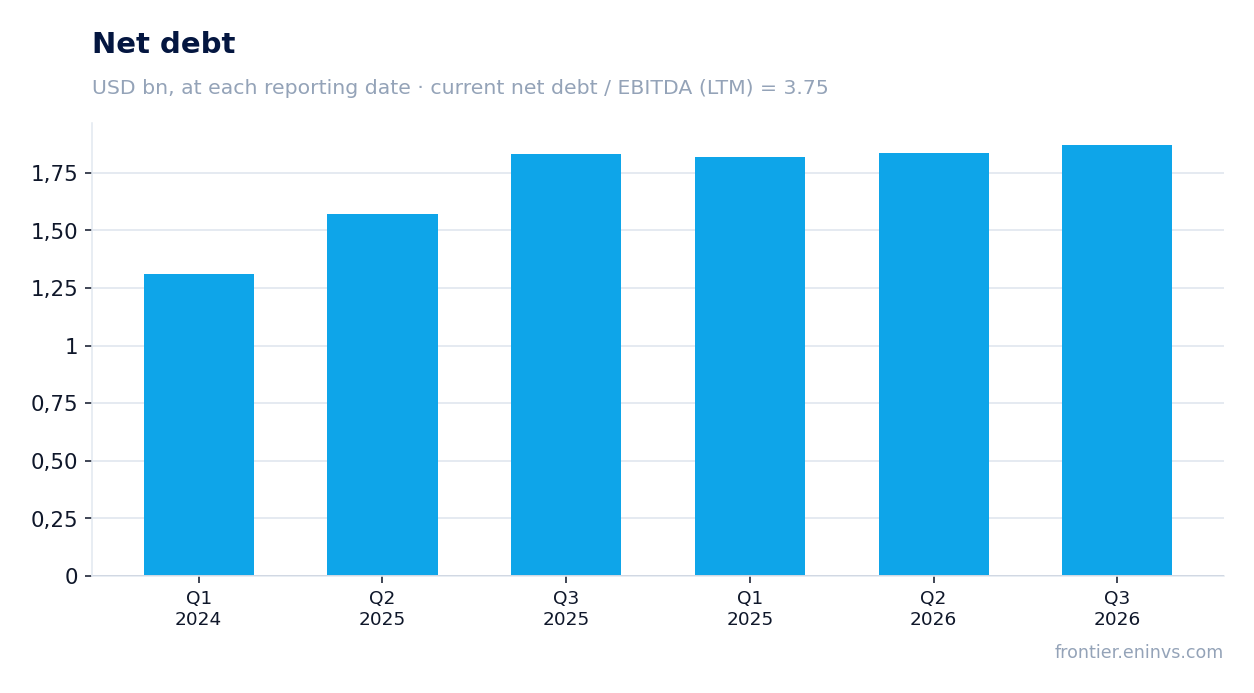
— Net debt at the end of Q3 2026 stood at $1,872m, with net debt/EBITDA LTM at 3.75, limiting financial flexibility
— On the portal's model, upside to fair value is estimated at -100%, reflecting an extremely low valuation of the business at current EBITDA
— No dividends are paid, and with negative EBITDA and high debt, a resumption of payouts is unlikely in the near term
Attractiveness
Key figures, USD bn
| Metric | Q3 2025 | Q3 2026 | Change |
|---|---|---|---|
| Revenue | 1.32 | 1.33 | +1.0% |
| EBITDA | 0.09 | -0.10 | -211.0% |
| Operating profit | -0.01 | -0.20 | — |
| Net profit | -0.03 | -0.18 | — |
| Operating cash flow | -0.00 | 0.03 | to profit |
| Capex | 0.13 | 0.06 | -51.9% |
| EBITDA margin | 6.9% | -7.6% | -14.5 pp |
| Net margin | -2.5% | -13.6% | -11.1 pp |
Q3 2026 revenue rose 1.0% year on year to $1,334m, but that was not enough to keep EBITDA positive
Sappi's Q3 2026 revenue came in at $1,334m, up 1.0% from the same quarter last year. This is the first quarter with positive annual revenue dynamics after a 5.6% decline in Q1 2025 and a 1.0% decline in Q2 2026. However, the growth is symbolic – it did not offset the drop in operating profit.
The main reason for negative EBITDA remains faster cost growth. While EBITDA was positive at $88m in Q3 2025, it turned negative at -$108m in the reporting quarter. The operating loss was $203m versus a loss of $6m a year earlier. The company does not disclose which cost factor had such an effect, but the scale of deterioration indicates that margin pressure persists.
The revenue decline in previous quarters has given way to stabilisation, but that is not enough to return to profitability. To bring EBITDA back into positive territory, the company needs either to significantly increase revenue or cut costs, which looks challenging in the current environment.
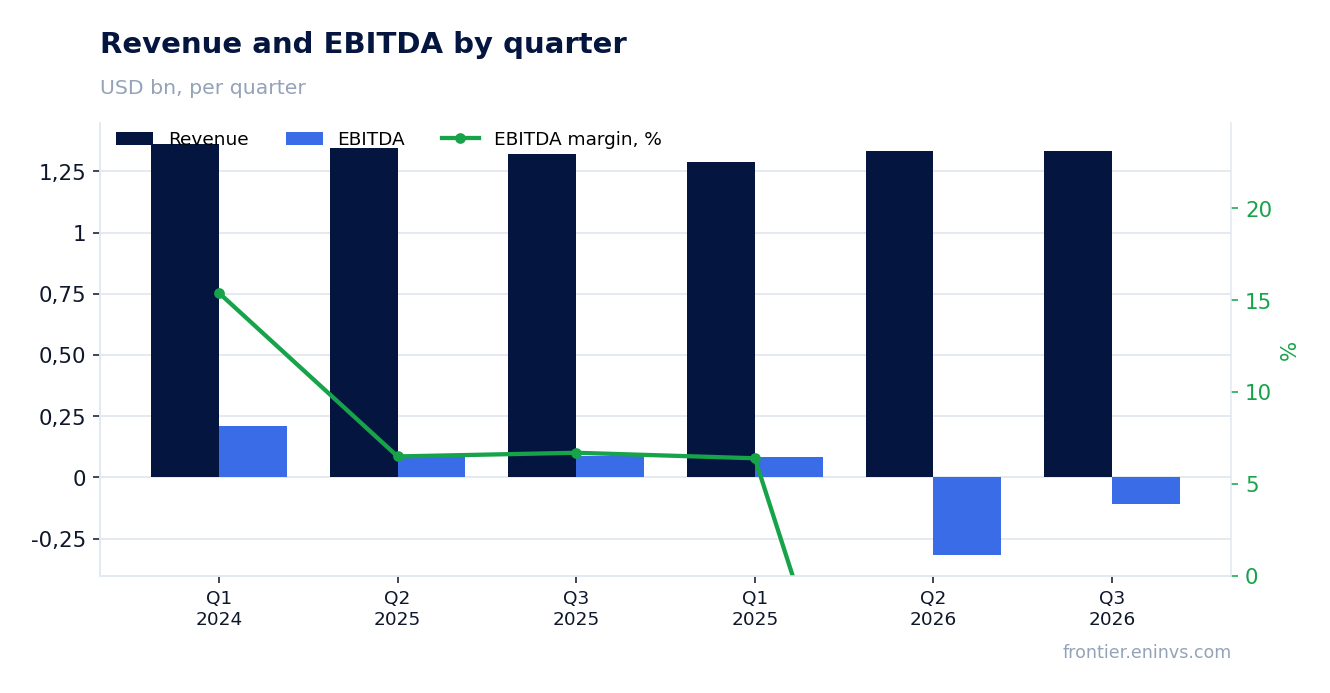
EBITDA turned negative at -$108m versus +$88m a year earlier – a 211.0% decline
Sappi's Q3 2026 EBITDA was -$108m, whereas a year earlier it was positive at $88m. The year-on-year decline was 211.0%. This is the second consecutive quarter with negative EBITDA: in Q2 2026 the figure was -$318m.
The EBITDA margin in the reporting quarter was -7.6% versus +6.9% a year earlier. A negative margin means the company does not even cover variable costs at the EBITDA level. The operating loss of $203m includes depreciation and other non-cash items, but even without them the business is loss-making.
Such a sharp deterioration compared to last year could be related to one-off write-offs or asset impairments, but the provided facts do not confirm this cause. We state the fact: EBITDA is negative, and this is the key problem in the report.
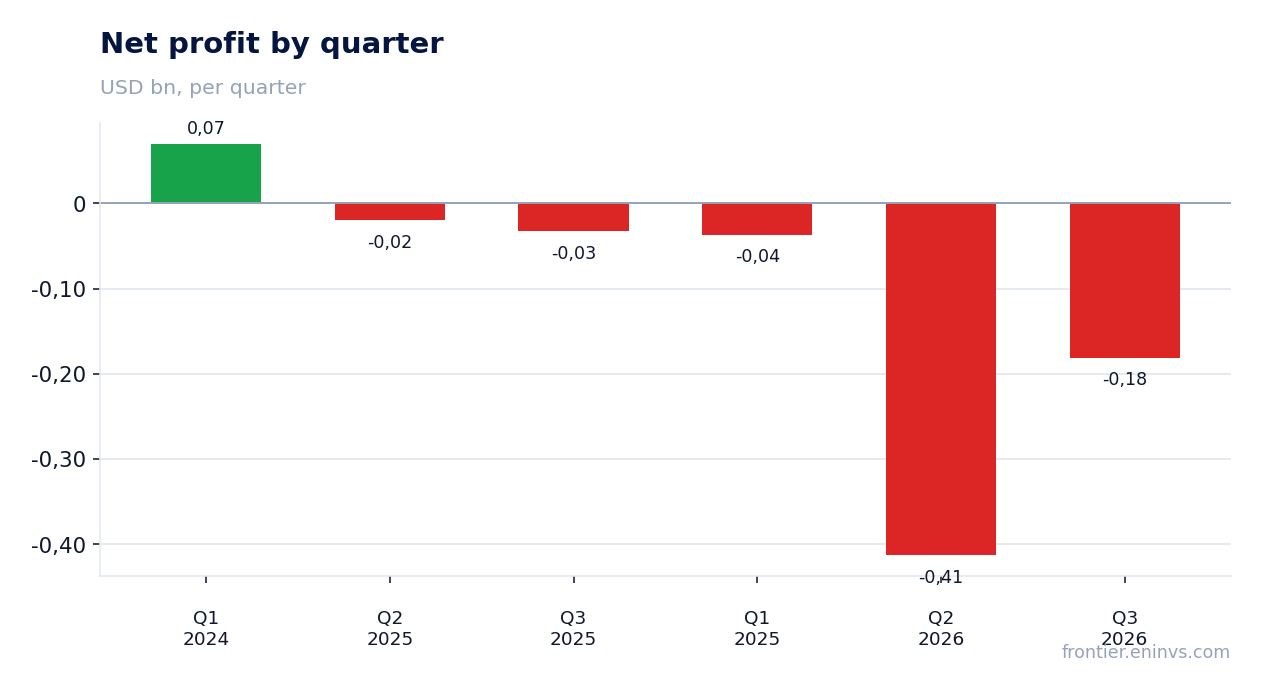
Q3 2026 net loss was $181m, narrowing from $413m in Q2 2026 but widening from $33m a year ago
Sappi's Q3 2026 net loss was $181m versus a loss of $413m in Q2 2026 and a loss of $33m in Q3 2025. Thus, compared to the previous quarter, the loss more than halved, but year on year it increased 5.5 times.
The net margin in the reporting quarter was -13.6% versus -2.5% a year earlier. The loss is mainly driven by negative operating profit, which is not offset by other income. Tax effects and financial expenses could also have influenced, but their details are not disclosed.
The narrowing of the loss compared to the previous quarter is due to the fact that in Q2 2026 EBITDA was significantly worse at -$318m. In Q3, negative EBITDA narrowed to -$108m, which led to a reduction in the net loss. However, in the annual comparison, the dynamics remain negative.
Operating cash flow in Q3 2026 remained positive at $26m, but capital expenditure of $62m exceeded it
Sappi's Q3 2026 operating cash flow was $26m, better than the outflow of $9m in Q2 2026 and the outflow of $3m in Q3 2025. This is the only positive signal in the report: the business generates cash flow from operations, albeit small.
However, capital expenditure in the reporting quarter was $62m, exceeding operating cash flow. Free cash flow is therefore negative at approximately -$36m. The company continues to invest despite losses, which may be related to the need to maintain production capacities.
Over the last 12 months, operating cash flow amounted to $124m, significantly below the level needed to cover capital expenditure and debt servicing. This creates a risk of further growth in debt burden.
Net debt at the end of Q3 2026 stood at $1,872m, with net debt/EBITDA LTM at 3.75, limiting financial flexibility
Sappi's net debt at the end of Q3 2026 was $1,872m, up from $1,836m at the end of Q2 2026 and from $1,830m at the end of Q3 2025. Debt continues to grow despite losses and negative EBITDA.
The net debt/EBITDA LTM ratio is 3.75. This is a level that may concern creditors, especially given that LTM EBITDA is $354.3m, and this figure includes more profitable previous periods. If current negative EBITDA persists, the ratio could deteriorate.
We do not have data on the previous value of this ratio, so we cannot say whether leverage increased or decreased. However, absolute debt is growing while EBITDA is falling, which objectively worsens credit quality.
On the portal's model, upside to fair value is estimated at -100%, reflecting an extremely low valuation of the business at current EBITDA
According to the portal's model, the upside to fair value for Sappi shares is estimated at -100%. This means the model sees no value in the business at current metrics, and the estimate is at the lower bound. This result is not a market consensus or a target price, but the portal's own calculation.
The company's market capitalisation is $499.2m, which at EV/EBITDA LTM of 5.15 and P/E LTM of 15.13 looks inexpensive, but these multiples are based on LTM EBITDA, which includes profitable past periods. If current negative EBITDA is used, the multiples become meaningless.
The portal's model takes into account EBITDA growth and a target multiple, and with negative EBITDA, growth cannot be positive. Therefore, the upside estimate is at the lower bound. This signals that without a recovery in profitability, the stock has no fundamental support.
No dividends are paid, and with negative EBITDA and high debt, a resumption of payouts is unlikely in the near term
Sappi does not pay dividends. The provided facts do not contain data on the last payouts or dividend policy, but with a net loss of $181m in Q3 2026 and negative EBITDA, the company has no sources for payments.
Moreover, net debt of $1,872m and the need to service it require directing free funds to repay obligations. Operating cash flow of $26m per quarter is insufficient even to cover capital expenditure, let alone dividends.
Thus, there is currently no dividend history for Sappi, and a resumption of payments is not expected in the foreseeable future. For income-oriented investors, the stock is of no interest.
Valuation on the latest reported figures
| Metric | Value |
|---|---|
| Market cap | 0.50 bn USD |
| P/E (LTM) | 15.1 |
| EV/EBITDA (LTM) | 5.2 |
| P/B | 0.19 |
| Net debt / EBITDA (LTM) | 3.75 |
| Operating cash flow (LTM) | 0.12 bn |
| ROE | -13.2% |
Bottom line
Bottom line: Sappi's Q3 2026 revenue rose 1.0% year on year to $1,334m, but this did not change the main issue – EBITDA remains negative at -$108m. The net loss narrowed compared to the previous quarter, but year on year it widened from $33m to $181m. Debt burden remains high: net debt of $1,872m, net debt/EBITDA LTM at 3.75. No dividends are paid, and there are no prospects for resuming them. At the current price, the stock looks unattractive: fundamentals provide no basis for growth, and the portal's model estimates upside at -100%.
Open the company's financial profile SAP →
See also: market overview · valuation map · stock screeners