Truworths: revenue flat, EBITDA down a fifth as margin contracts 4.5 points
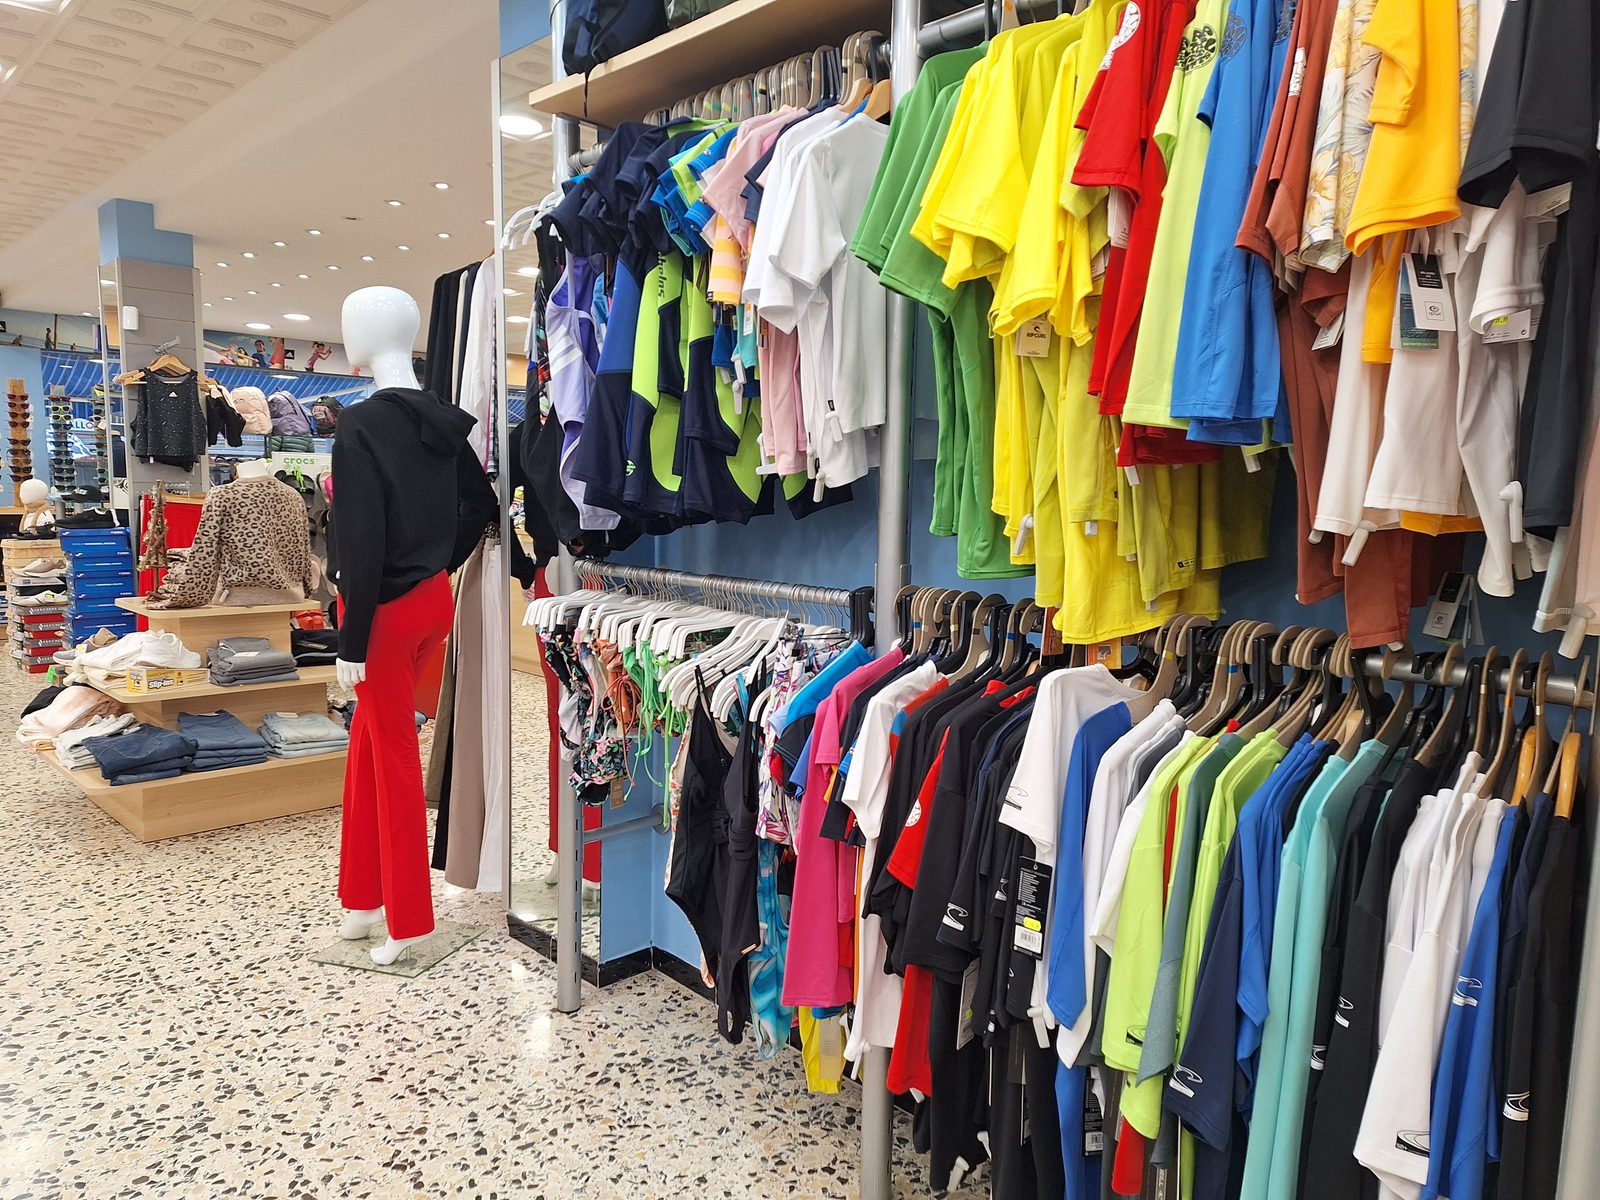
Truworths has reported FY 2026 results. Revenue added just 0.1% year on year, EBITDA fell 20.2%, and net profit declined 4.6%. The EBITDA margin contracted from 22.3% to 17.8%, the net margin from 13.1% to 12.5%. At the same time the stock trades at P/E LTM 6.25 and EV/EBITDA LTM 4.87, with a trailing twelve-month dividend yield of 10.7%. On the portal's model, upside to fair value is negative at -39%. Given the margin contraction and the negative model signal, the share looks rather unattractive at the current level.
Key takeaways
— FY 2026 revenue added 0.1% — growth has stalled
— EBITDA fell 20.2% as the margin contracted from 22.3% to 17.8%
— Net profit declined 4.6%, but the net margin held at 12.5%
— Leverage at 0.48 EBITDA LTM is moderate, though the direction is not disclosed
— The 10.7% dividend yield is the main argument for the stock
— P/E LTM 6.25 and EV/EBITDA LTM 4.87 look cheap, but the portal model gives -39%
Attractiveness
Key figures, ZAR bn
| Metric | FY 2025 | FY 2026 | Change |
|---|---|---|---|
| Revenue | 21.3 | 21.3 | +0.1% |
| EBITDA | 4.75 | 3.79 | -20.2% |
| Operating profit | 3.22 | 2.21 | -31.5% |
| Net profit | 2.79 | 2.66 | -4.6% |
| Operating cash flow | 2.77 | 2.37 | -14.4% |
| Capex | 0.67 | 0.64 | -4.5% |
| EBITDA margin | 22.3% | 17.8% | -4.5 pp |
| Net margin | 13.1% | 12.5% | -0.6 pp |
FY 2026 revenue added 0.1% — growth has stalled
Truworths' FY 2026 revenue came in at 21,300 million, up just 0.1% year on year. This is effectively zero growth: the company neither lost sales nor added any. For a retailer that would normally grow with inflation and new space, this suggests like-for-like sales likely failed to cover even price increases.
The report does not break out segments or channels, so the cause of the revenue stall cannot be named. We can only state that the top line has ceased to be a driver. With flat revenue, the entire burden of profit falls on costs and margin, and this year they disappointed.
EBITDA fell 20.2% as the margin contracted from 22.3% to 17.8%
FY 2026 EBITDA was 3,790 million, 20.2% below the prior year. The EBITDA margin fell from 22.3% to 17.8% — down 4.5 percentage points. With revenue flat, such a drop means costs grew faster than sales.
The report does not provide a cost breakdown, so we cannot pinpoint which line consumed the margin. But the scale of the contraction — nearly a quarter of EBITDA — suggests systemic cost pressure rather than a one-off. This is the key negative of the report: even if revenue returns to growth, the margin is no longer what it was.
Net profit declined 4.6%, but the net margin held at 12.5%
FY 2026 net profit declined 4.6% year on year. The net margin was 12.5% versus 13.1% a year earlier — a drop of just 0.6 points. This is noticeably milder than the 4.5-point contraction in the EBITDA margin.
The gap between EBITDA and net profit dynamics means factors below the operating line supported the bottom line: possibly lower interest expenses or a tax base effect. The report does not disclose these details, so we note only the fact: net profit suffered less than operating profit. But this does not change the main point — operating efficiency has fallen.
Leverage at 0.48 EBITDA LTM is moderate, though the direction is not disclosed
Net debt at the latest reporting date was 1,814 million, corresponding to 0.48 EBITDA LTM. This is a moderate level: debt is covered by operating profit in less than half a year. For a retailer, such leverage does not create immediate risks.
The change in net debt versus the previous reporting date is minus 2.9 billion, and over the last 12 months plus 0.3 billion. These are opposing movements that do not allow us to speak of a sustained trend. The direction of the net debt/EBITDA ratio is not disclosed, so we do not claim that leverage rose or fell — we only state the level.
The 10.7% dividend yield is the main argument for the stock
The trailing twelve-month dividend yield is 10.7%. This is a high level, noticeably above long-term government bond yields. For an income-oriented investor, the stock looks attractive.
However, the sustainability of the dividend depends on profit. With LTM net profit of 2,662 million and a market capitalisation of 16,645 million, a 10.7% payout means the company distributes a significant portion of earnings. If the margin continues to contract, the dividend could be revised. For now, it remains the key support for the valuation.
P/E LTM 6.25 and EV/EBITDA LTM 4.87 look cheap, but the portal model gives -39%
The stock trades at P/E LTM 6.25 and EV/EBITDA LTM 4.87. These are low multiples, typically associated with companies facing limited growth or elevated risk. The market is clearly not pricing in a margin recovery.
On the portal's model, which compares EBITDA growth against a target multiple and market capitalisation, upside to fair value is -39%. This means that even accounting for the dividend yield, the stock looks overvalued relative to the fundamental value calculated by our model. The low multiples in this case do not provide a margin of safety but reflect the weakness of operating metrics.
Valuation on the latest reported figures
| Metric | Value |
|---|---|
| Market cap | 16.6 bn ZAR |
| P/E (LTM) | 6.3 |
| EV/EBITDA (LTM) | 4.9 |
| P/B | 1.62 |
| Net debt / EBITDA (LTM) | 0.48 |
| Operating cash flow (LTM) | 2.40 bn |
| ROE | 16.1% |
| Dividend yield (12m) | 10.7% |
Bottom line
Bottom line: Truworths reported FY 2026 with stagnant revenue and a sharp drop in EBITDA. The margin contracted from 22.3% to 17.8%, and this is the main negative. Net profit suffered less due to factors below the operating line, but this does not change the weakness in operating efficiency. Leverage is moderate at 0.48 EBITDA LTM, and the 10.7% dividend yield remains the main argument for the stock. However, low multiples (P/E 6.25, EV/EBITDA 4.87) and the negative signal from the portal model (-39%) suggest the market is already pricing in risks. The share looks rather unattractive at the current level: the dividend supports the price, but this does not offset the fundamental overvaluation.
Open the company's financial profile TRU →
See also: market overview · valuation map · stock screeners