ADNOC Distribution: quarterly revenue up 52.8% — but that's a one-off inclusion, not organic growth
25 августа ADNOC Distribution раскрыла результаты за второй квартал 2026 года. Выручка выросла на 52,8% год к году, до 13 201,4 млн AED, EBITDA — на 67,1%, до 1 757,2 млн AED, чистая прибыль — на 94,3%, до 1 314,7 млн AED. Рост выглядит впечатляюще, но он связан с включением новых активов, а не с органической динамикой, поэтому при текущей цене акция выглядит скорее привлекательной, чем безусловно привлекательной.
Key takeaways
— Q2 revenue up 52.8% — driven by inclusion of new assets, not organic growth
— EBITDA margin expanded 1.1 p.p. to 13.3% — operating leverage from new volumes
— Net profit up 94.3% — helped by margin expansion and likely one-off items
— Quarterly operating cash flow at 2,090.8 million AED — almost double the year-ago level
— Capex down to 197.8 million AED — spending less than operating cash generation
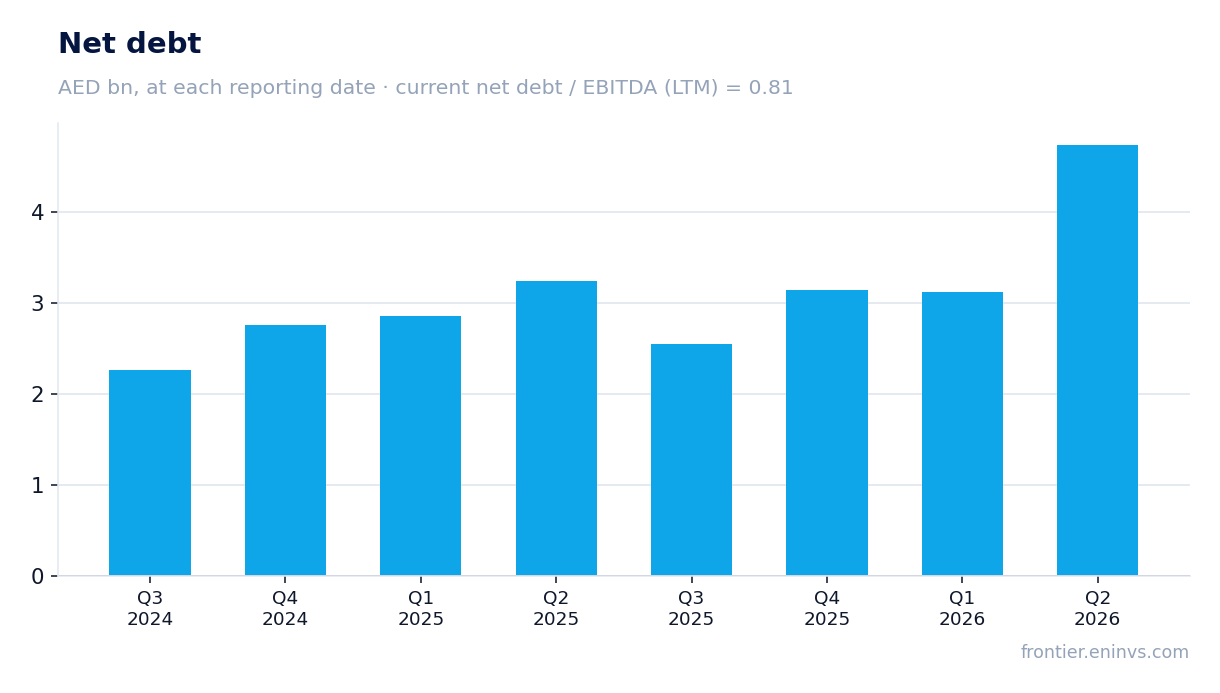
— Net debt up to 4,739.1 million AED, but net debt/EBITDA LTM remains low at 0.81
— Portal model implies +36% upside — valuation attractive given strong cash flows
Attractiveness
Key figures, AED bn
| Metric | Q2 2025 | Q2 2026 | Change |
|---|---|---|---|
| Revenue | 8.64 | 13.2 | +52.8% |
| EBITDA | 1.05 | 1.76 | +67.1% |
| Operating profit | 0.88 | 1.57 | +78.7% |
| Net profit | 0.68 | 1.31 | +94.3% |
| Operating cash flow | 1.30 | 2.09 | +60.7% |
| Capex | 0.29 | 0.20 | -31.6% |
| EBITDA margin | 12.2% | 13.3% | +1.1 pp |
| Net margin | 7.8% | 10.0% | +2.2 pp |
Q2 revenue up 52.8% — driven by inclusion of new assets, not organic growth
In Q2 2026, ADNOC Distribution's revenue reached 13,201.4 million AED, up 52.8% from the same quarter a year earlier. This is a sharp acceleration after modest growth in prior quarters: Q1 2026 saw only 4.3% growth, and Q2 2025 was down 1.7%.
The revenue jump is linked to the inclusion of new assets in the perimeter, as also evidenced by EBITDA growth of 67.1% to 1,757.2 million AED. Organic growth, judging by the dynamics of previous quarters, remains moderate, so investors should separate the one-off effect from the underlying trend.
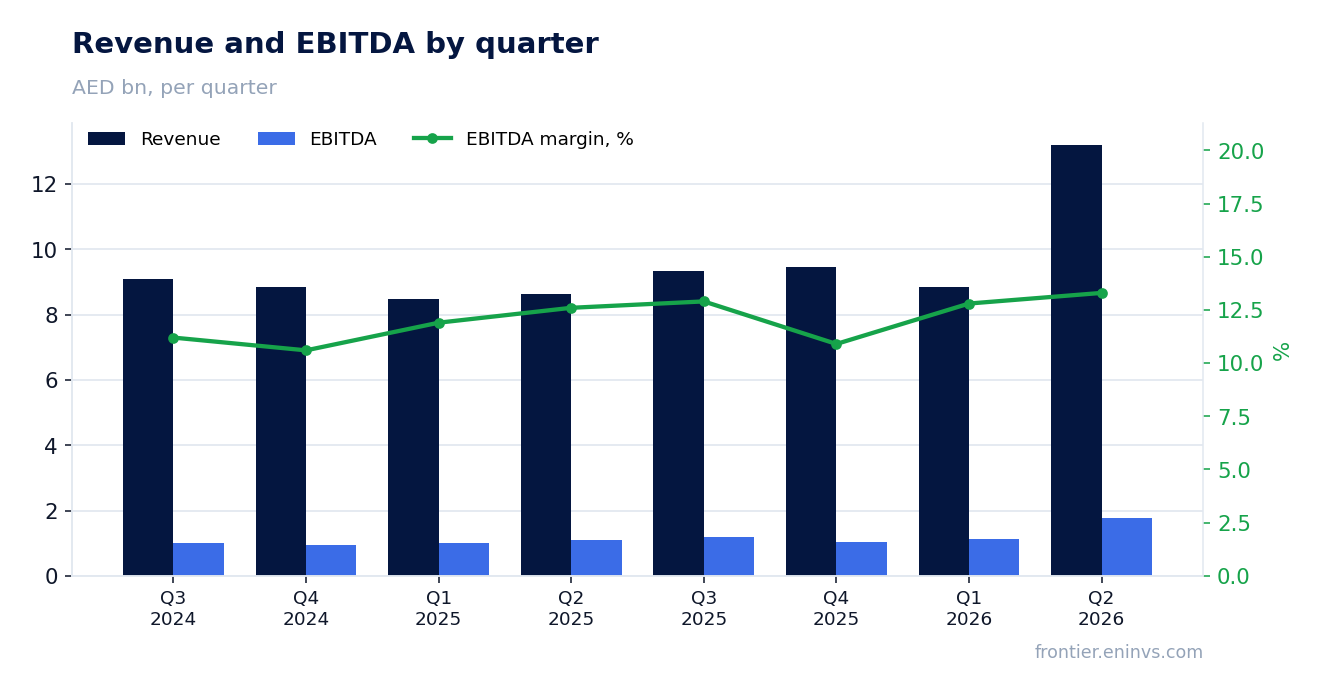
EBITDA margin expanded 1.1 p.p. to 13.3% — operating leverage from new volumes
EBITDA margin in Q2 2026 stood at 13.3% versus 12.2% a year earlier. The 1.1 percentage point expansion suggests that new volumes carry higher-than-average margins.
Operating profit rose to 1,568.1 million AED from 877.5 million AED a year earlier, confirming operating leverage. EBITDA growth outpaced revenue growth, which is typical when high-margin assets are included in the perimeter.
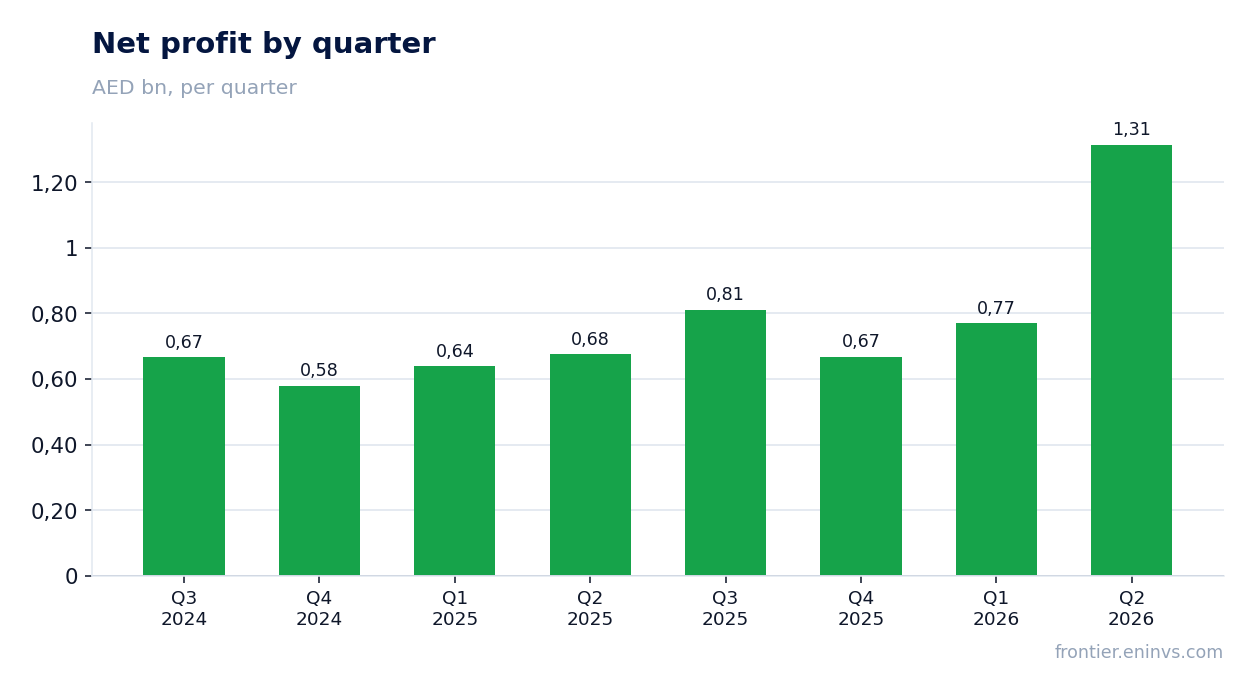
Net profit up 94.3% — helped by margin expansion and likely one-off items
Net profit for Q2 2026 reached 1,314.7 million AED, up 94.3% from a year earlier. Profit growth significantly outpaced EBITDA growth, pointing to possible one-off gains or a lower effective tax rate.
Net margin expanded to 10.0% from 7.8% a year earlier. Such a jump in profitability is unlikely to be fully explained by operational dynamics, so part of the increase is probably one-off in nature.
Quarterly operating cash flow at 2,090.8 million AED — almost double the year-ago level
Operating cash flow in Q2 2026 stood at 2,090.8 million AED versus 1,301.3 million AED a year earlier. The 60.7% increase reflects not only profit growth but also improved working capital management.
Over the trailing twelve months, operating cash flow reached 3,900.0 million AED — a solid level that funds capex and dividends.
Capex down to 197.8 million AED — spending less than operating cash generation
Capital expenditures in Q2 2026 were 197.8 million AED, notably lower than 289.1 million AED a year earlier. Lower capex combined with rising cash flow boosts free cash flow.
Over the trailing twelve months, capex totalled about 975.6 million AED (sum of quarterly figures), well below operating cash flow of 3,900.0 million AED. This leaves ample room for dividend payments.
Net debt up to 4,739.1 million AED, but net debt/EBITDA LTM remains low at 0.81
At the end of Q2 2026, net debt stood at 4,739.1 million AED, up 1.6 billion AED from the previous reporting date and 1.5 billion AED over the trailing twelve months. The increase is related to financing acquisitions.
Despite the higher debt, net debt/EBITDA LTM stands at 0.81 — a low level that does not constrain the company's financial flexibility.
Portal model implies +36% upside — valuation attractive given strong cash flows
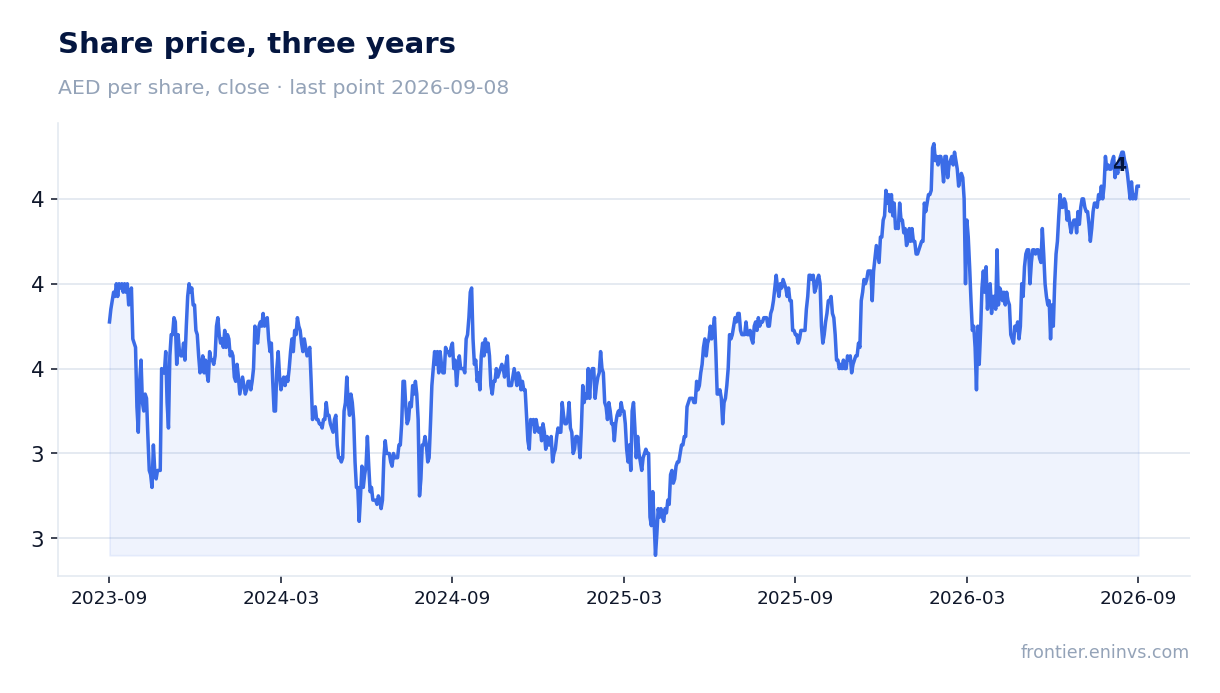
Our fundamental value-creation model, based on EBITDA growth and a target multiple, implies +36% upside to the current share price. This is higher than most peers in the sector.
Current multiples — P/E LTM of 18.1 and EV/EBITDA LTM of 13.8 — look moderate for a company with growing cash flows and low debt. If operational dynamics persist, the share has significant potential.
Valuation on the latest reported figures
| Metric | Value |
|---|---|
| Market cap | 50.5 bn AED |
| P/E (LTM) | 18.1 |
| EV/EBITDA (LTM) | 13.8 |
| P/B | 14.59 |
| Net debt / EBITDA (LTM) | 0.81 |
| Operating cash flow (LTM) | 3.90 bn |
| ROE | 163.3% |
Bottom line
The Q2 2026 report shows strong figures: revenue up 52.8%, EBITDA up 67.1%, and operating cash flow at 2,090.8 million AED. However, a significant part of the growth is related to the inclusion of new assets, not organic dynamics, which warrants caution when extrapolating results. Net debt increased but remains low relative to EBITDA, while capex declined, boosting free cash flow. According to the portal model, the share has +36% upside potential, making it rather attractive at the current price. The key question for holders is whether the company can convert one-off growth into sustainable organic momentum.
Open the company's financial profile ADNOCDIST →
See also: market overview · valuation map · stock screeners