Americana: profit up 40%, but all of the growth came from one-offs
Americana reported Q2 2026 results. Revenue rose 11.1% YoY to $714.8 million, EBITDA – 21.9% to $183.1 million, net profit – 40.3% to $83.9 million. EBITDA margin improved to 25.6% from 23.3%, net margin – to 11.7% from 9.3%. However, profit growth nearly doubles revenue growth, pointing to one-off factors behind the result. At the current price the stock is fairly valued: EV/EBITDA LTM 9.1, P/E LTM 20.1, and the portal's model implies no upside.
Key takeaways
— Revenue grew 11.1% YoY, but this is the slowest growth in the last five quarters
— EBITDA rose 21.9%, with margin up to 25.6% – the highest level on record
— Net profit grew 40.3%, but growth nearly doubles revenue – one-off factors are at play
— Operating cash flow for the quarter was $230.5 million with capex of $30.0 million – cash conversion remains high
— Net debt at quarter-end was $501.4 million, implying net debt/EBITDA LTM of -0.75
— Dividends not disclosed, but with a 50% payout ratio and LTM profit of $273.8 million, the payout could be around $137 million
— Valuation: EV/EBITDA LTM 9.1, P/E LTM 20.1 – the stock trades near fair value, with 0% upside on the portal's model
Attractiveness
Key figures, USD bn
| Metric | Q2 2025 | Q2 2026 | Change |
|---|---|---|---|
| Revenue | 0.64 | 0.71 | +11.1% |
| EBITDA | 0.15 | 0.18 | +21.9% |
| Operating profit | 0.08 | 0.10 | +36.0% |
| Net profit | 0.06 | 0.08 | +40.3% |
| Operating cash flow | 0.16 | 0.23 | +47.2% |
| Capex | 0.02 | 0.03 | +26.2% |
| EBITDA margin | 23.3% | 25.6% | +2.3 pp |
| Net margin | 9.3% | 11.7% | +2.4 pp |
Revenue grew 11.1% YoY, but this is the slowest growth in the last five quarters
Q2 2026 revenue was $714.8 million, up 11.1% year-on-year. This is a slowdown from 13.3% growth in Q1 2026 and 15.1% in Q2 2025. Over the last five quarters, revenue growth has consistently decelerated: from 16.2% in Q1 2025 to 11.1% now.
The main drivers were likely new store openings and higher average ticket, though the company does not disclose details. The slowdown may reflect a high base from last year, when revenue grew 15.1%, as well as possible market saturation. Nevertheless, the absolute revenue level remains a record for the company.
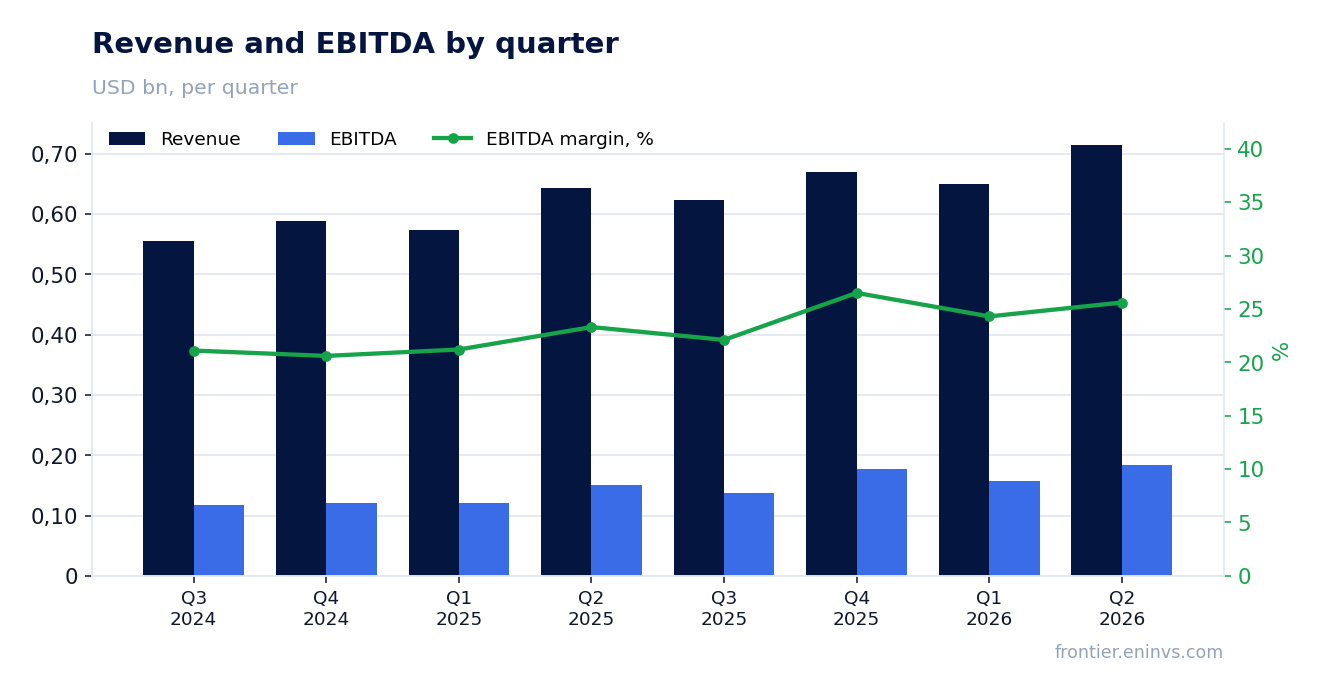
EBITDA rose 21.9%, with margin up to 25.6% – the highest level on record
Q2 2026 EBITDA reached $183.1 million, up 21.9% year-on-year. The EBITDA margin rose to 25.6% from 23.3% a year earlier. This is the highest margin level in the available quarterly history, dating back to Q3 2024.
EBITDA growing faster than revenue points to improved operating efficiency. The company does not disclose which cost lines drove the savings, but such a significant margin expansion amid slowing revenue growth could be due to scale effects and cost control. The sustainability of this improvement is questionable given the top-line deceleration.
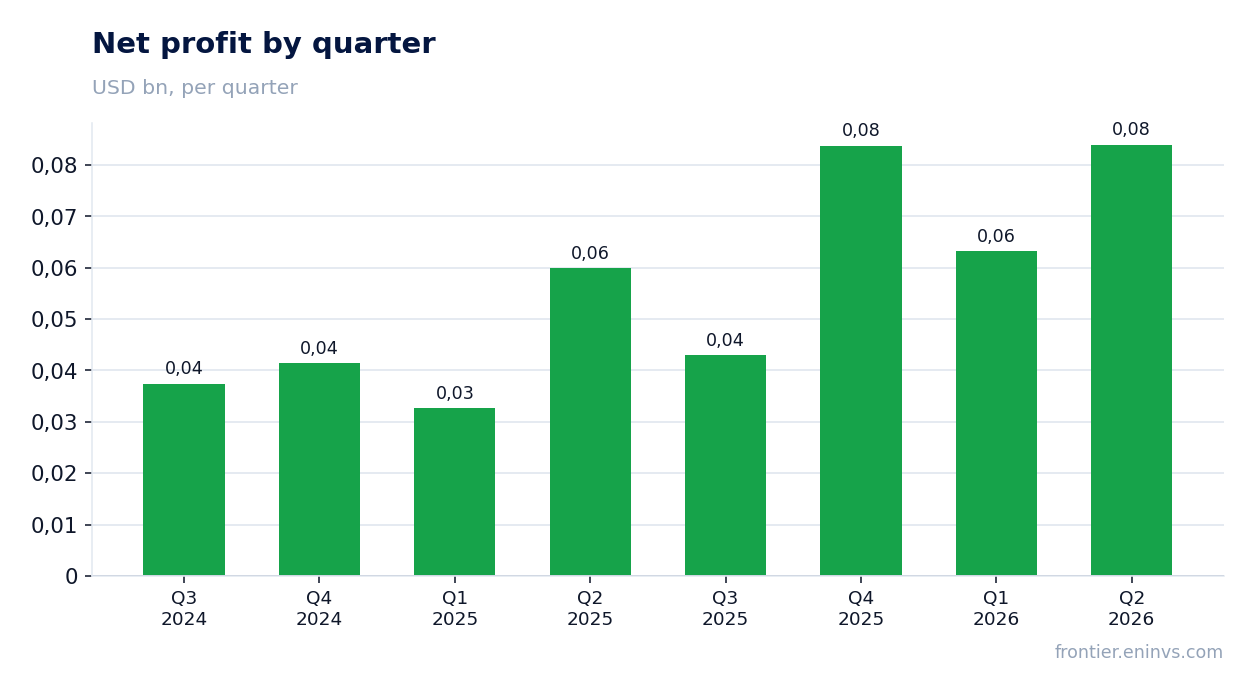
Net profit grew 40.3%, but growth nearly doubles revenue – one-off factors are at play
Q2 2026 net profit was $83.9 million, up 40.3% year-on-year. Profit growth significantly outpaces revenue growth (11.1%) and EBITDA growth (21.9%). Net margin rose to 11.7% from 9.3% a year earlier.
Such a strong divergence between revenue and profit dynamics points to one-off factors unrelated to core operations. The company does not disclose details, but it is likely that a significant portion of the increase came from non-operating income or a lower tax burden. Without these one-offs, profit growth would be closer to EBITDA growth.
Operating cash flow for the quarter was $230.5 million with capex of $30.0 million – cash conversion remains high
Q2 2026 operating cash flow was $230.5 million, significantly higher than $156.6 million a year earlier. Capital expenditures for the quarter were $30.0 million, slightly above last year's $23.8 million. Free cash flow thus reached approximately $200 million.
The high conversion of EBITDA into operating cash flow (OCF/EBITDA ratio of about 126%) indicates good earnings quality and efficient working capital management. The company generates enough funds to finance capex and potential dividends without increasing debt.
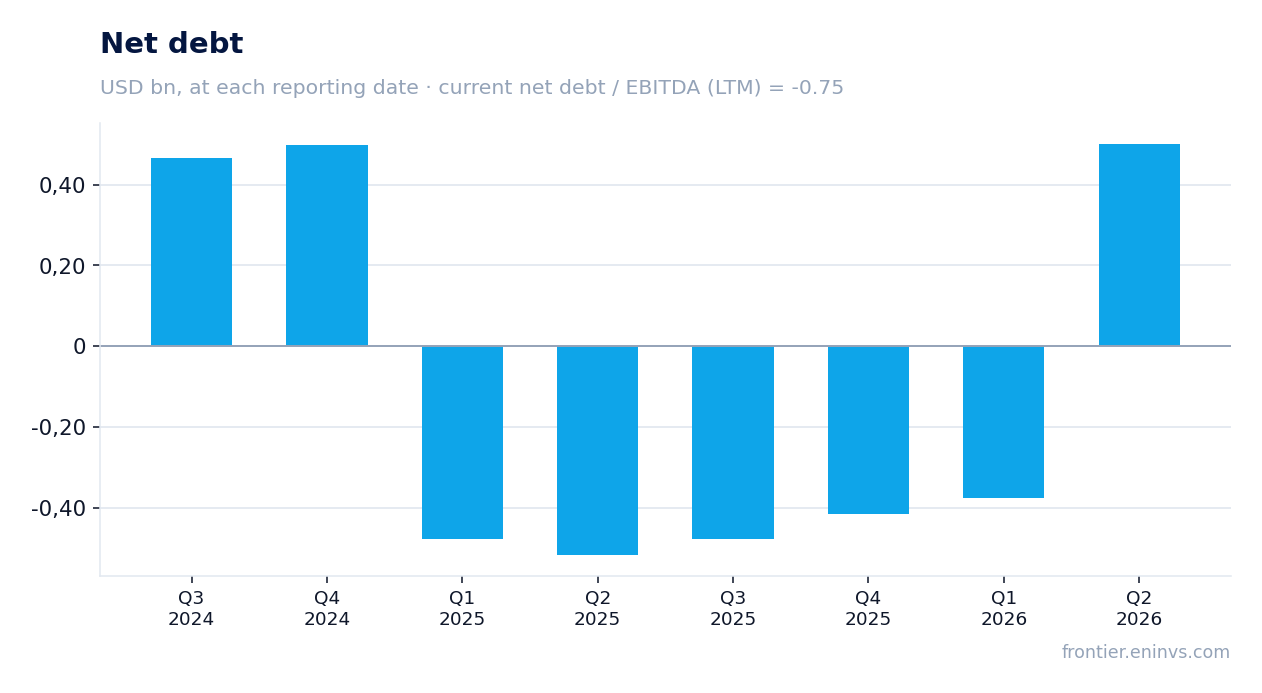
Net debt at quarter-end was $501.4 million, implying net debt/EBITDA LTM of -0.75
Net debt at the end of Q2 2026 was $501.4 million. This is a notable increase from the previous reporting date: debt rose by RUB 0.9 billion over the quarter and by RUB 1.0 billion over 12 months. However, in dollar terms net debt remains moderate.
The net debt/EBITDA ratio for the trailing twelve months is -0.75. A negative value means cash and equivalents exceed debt obligations, i.e., the company has a net cash position. This gives it financial flexibility but may also indicate insufficiently efficient use of capital.
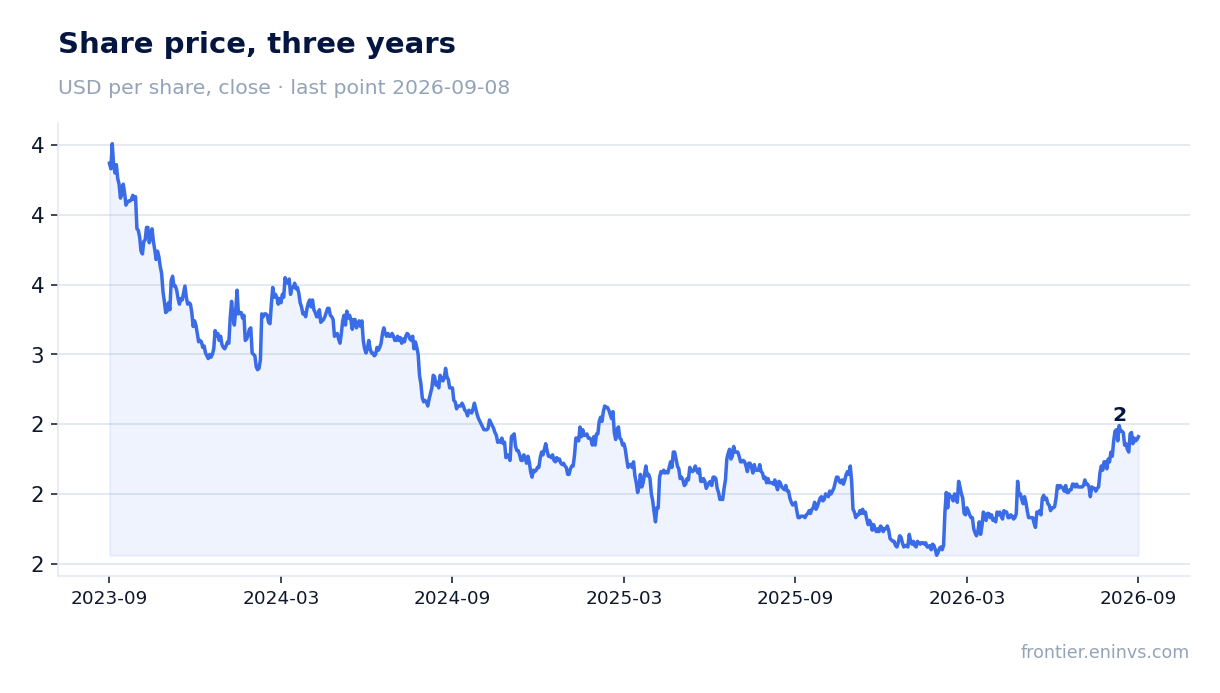
Dividends not disclosed, but with a 50% payout ratio and LTM profit of $273.8 million, the payout could be around $137 million
The company did not disclose dividend payments in its Q2 2026 reporting. Our estimate of future dividends assumes a 50% payout ratio of net profit. With LTM profit of $273.8 million, this implies about $137 million in dividends, or approximately $0.16 per share.
At the current market capitalization of $5,489.4 million, the potential dividend yield is about 2.5%. This is a moderate level that may appeal to income-oriented investors but is not a decisive factor. The final dividend amount will depend on the board's decision and may be adjusted for capital expenditures and debt levels.
Valuation: EV/EBITDA LTM 9.1, P/E LTM 20.1 – the stock trades near fair value, with 0% upside on the portal's model
The EV/EBITDA multiple for the trailing twelve months is 9.1, P/E – 20.1. We lack three-year historical data for the company, so we cannot say whether current levels are above or below their averages. However, the absolute values appear moderate for a company with growing revenue and high profitability.
Our fundamental valuation model, based on EBITDA growth and a target multiple, shows 0% upside to fair value. This means the current price fully reflects market expectations. At the same time, ROE is 68.1%, indicating high efficiency in using equity capital.
Valuation on the latest reported figures
| Metric | Value |
|---|---|
| Market cap | 5.49 bn USD |
| P/E (LTM) | 20.1 |
| EV/EBITDA (LTM) | 9.1 |
| P/B | 11.20 |
| Net debt / EBITDA (LTM) | -0.75 |
| Operating cash flow (LTM) | 0.59 bn |
| ROE | 68.1% |
Bottom line
Americana delivered strong Q2 2026 results: revenue up 11.1%, EBITDA up 21.9%, net profit up 40.3%. However, profit growth nearly doubles revenue growth, indicating one-off factors. The company generates high operating cash flow and has a net cash position. Valuation is near fair: EV/EBITDA 9.1, P/E 20.1, with 0% upside on the portal's model. The stock appears fairly valued, and sustainable drivers, not one-offs, are needed for further growth.
Open the company's financial profile AMR →
See also: market overview · valuation map · stock screeners