Salik: revenue falls for a second straight quarter, while dividend yield stays modest
25 августа Salik раскрыла результаты за второй квартал 2026 года: выручка снизилась на 12,0% год к году, до 683,0 млн AED, EBITDA – на 14,0%, до 468,2 млн AED, чистая прибыль – на 16,4%, до 334,8 млн AED. Наш вердикт – «нейтрально»: бумага торгуется с мультипликатором EV/EBITDA 21,7, что ниже собственного трёхлетнего среднего (24,2), но падение выручки и маржинальности, а также скромная дивидендная доходность не дают оснований для более позитивной оценки.
Key takeaways
— Revenue in Q2 fell 12.0% YoY – the second consecutive quarterly decline after a long growth streak
— EBITDA margin declined to 68.5% from 70.2% a year earlier, reflecting pressure on operating efficiency
— Net profit fell 16.4% YoY to AED 334.8 million, with net margin down to 49.0% from 51.6%
— Operating cash flow turned negative in Q2 – minus AED 85.4 million, a sharp contrast with positive readings in prior quarters
— Trailing twelve-month dividend yield is 2.2% – lower than one might expect from a company with such profitability
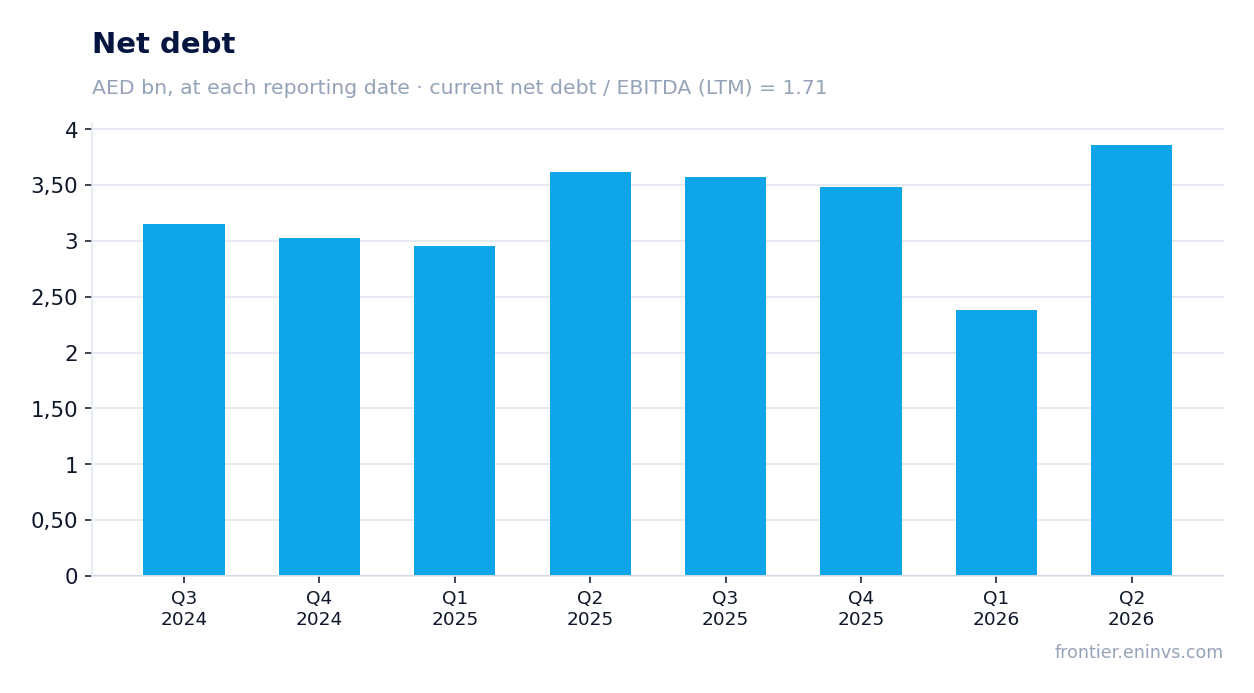
— Net debt at the end of Q2 stood at AED 3,862.2 million, up AED 1.5 billion from the previous reporting date
— On the portal's model, the share's upside is minus 14%, indicating overvaluation at current levels
Attractiveness
Key figures, AED bn
| Metric | Q2 2025 | Q2 2026 | Change |
|---|---|---|---|
| Revenue | 0.78 | 0.68 | -12.0% |
| EBITDA | 0.54 | 0.47 | -14.0% |
| Operating profit | 0.51 | 0.43 | -15.1% |
| Net profit | 0.40 | 0.33 | -16.4% |
| Operating cash flow | 0.48 | -0.09 | -117.6% |
| EBITDA margin | 70.2% | 68.5% | -1.7 pp |
| Net margin | 51.6% | 49.0% | -2.6 pp |
Revenue in Q2 fell 12.0% YoY – the second consecutive quarterly decline after a long growth streak
In Q2 2026, Salik's revenue stood at AED 683.0 million, 12.0% below the same quarter a year earlier. This is the second consecutive quarterly decline: in Q1 2026, revenue also fell 3.0% YoY. Prior to that, the company had shown robust growth, with quarterly rates ranging from +26.3% to +45.6% in 2025.
The revenue decline likely reflects a normalization of traffic after a period of high growth, possibly related to tariff changes or expansion of coverage area. The exact reason is not specified in the provided data, but the dynamics indicate the end of an extensive growth phase.
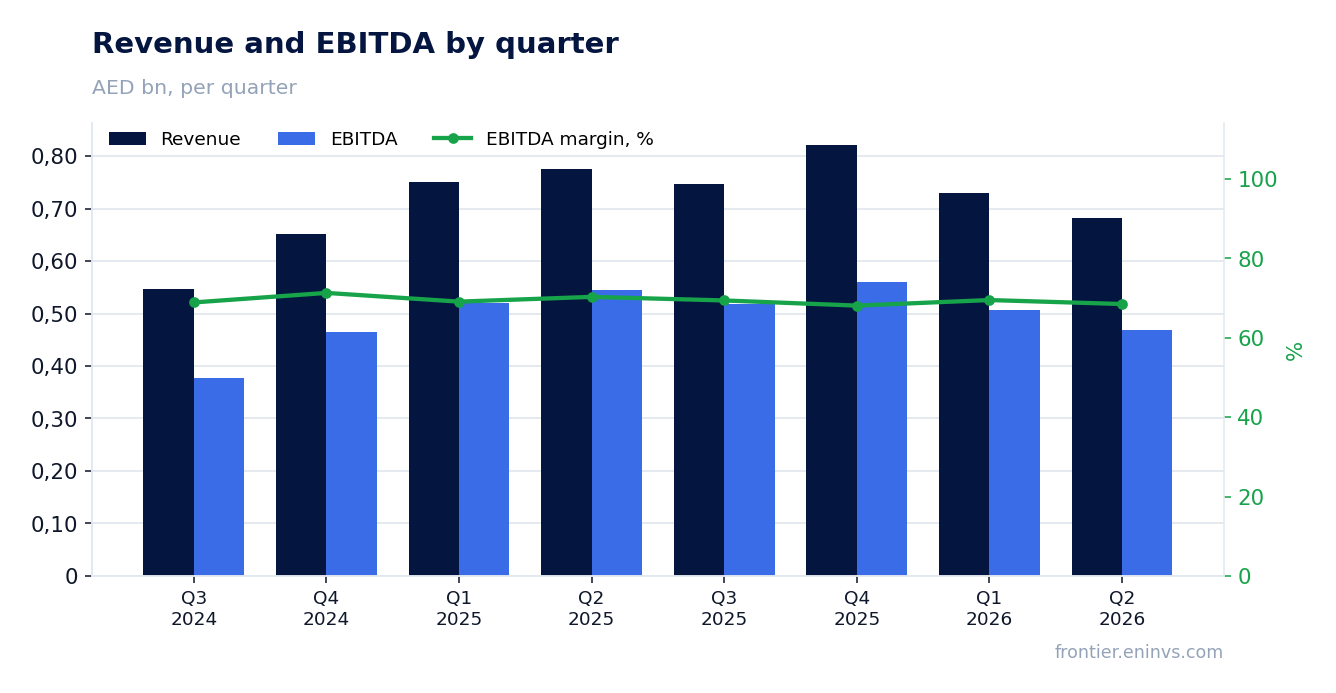
EBITDA margin declined to 68.5% from 70.2% a year earlier, reflecting pressure on operating efficiency
In Q2 2026, EBITDA amounted to AED 468.2 million, down 14.0% YoY. The EBITDA margin decreased to 68.5% from 70.2% in the same quarter last year. This indicates that operating expenses grew faster than revenue, or that the revenue mix changed.
The margin decline of 1.7 percentage points is moderate, but combined with the revenue drop, it intensifies pressure on profit. The company maintains a high level of profitability, but the trend warrants attention.
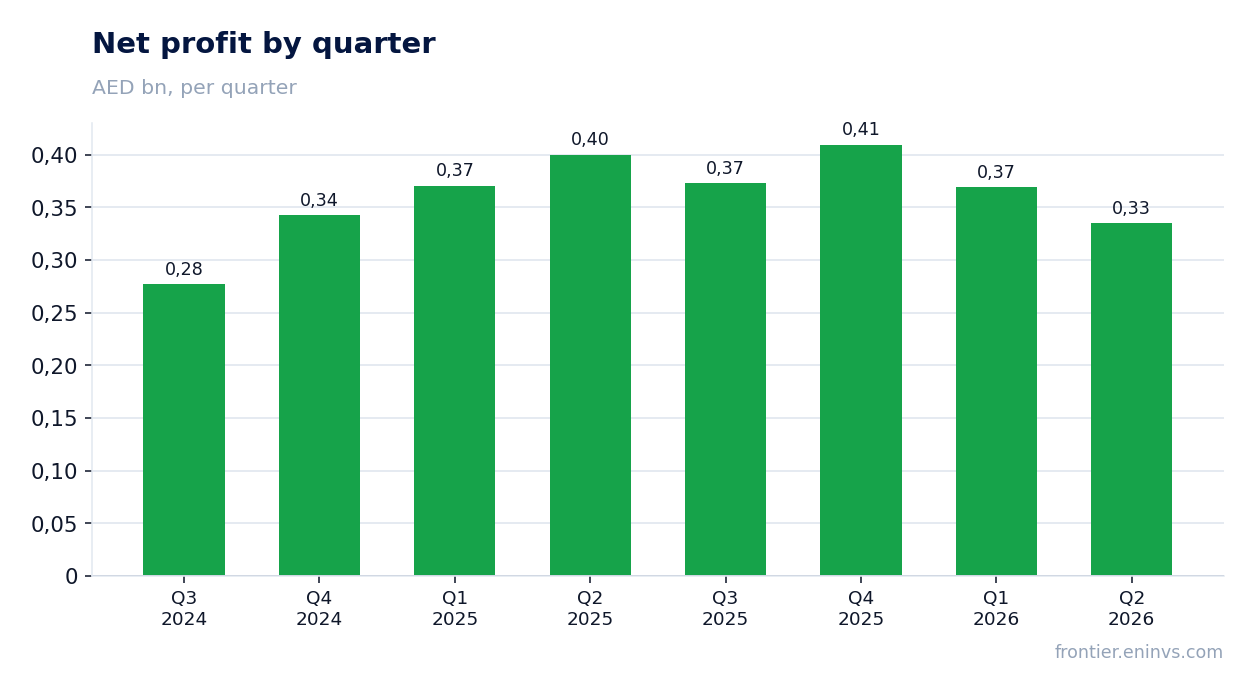
Net profit fell 16.4% YoY to AED 334.8 million, with net margin down to 49.0% from 51.6%
Net profit in Q2 2026 was AED 334.8 million, 16.4% below the same period last year. Net margin declined to 49.0% from 51.6%, reflecting not only operational pressure but also possible increases in financial expenses or tax burden.
The decline in net profit was deeper than the EBITDA drop, indicating additional factors below the operating line. Nevertheless, the absolute level of profit remains high, and profitability is among the best in the sector.
Operating cash flow turned negative in Q2 – minus AED 85.4 million, a sharp contrast with positive readings in prior quarters
In Q2 2026, Salik's operating cash flow was minus AED 85.4 million. For comparison, in Q1 2026 it was positive at AED 636.5 million, and in Q2 2025 it was AED 485.0 million. A negative OCF is a rare event for a company with such high margins.
The reasons for such a sharp decline in operating cash flow are not disclosed in the provided data. It could be related to changes in working capital, one-off payments, or accounting specifics. However, this is an important signal that requires monitoring in subsequent reports.
Trailing twelve-month dividend yield is 2.2% – lower than one might expect from a company with such profitability
Over the last twelve months, Salik paid dividends corresponding to a yield of 2.2% at the current price. This is a modest level, especially for a company with a net margin of around 49% and a stable cash flow history.
At such a yield, the dividend is unlikely to be a primary driver for investors. The question of how much the company will increase payouts remains open. If profit continues to decline, dividends could come under pressure.
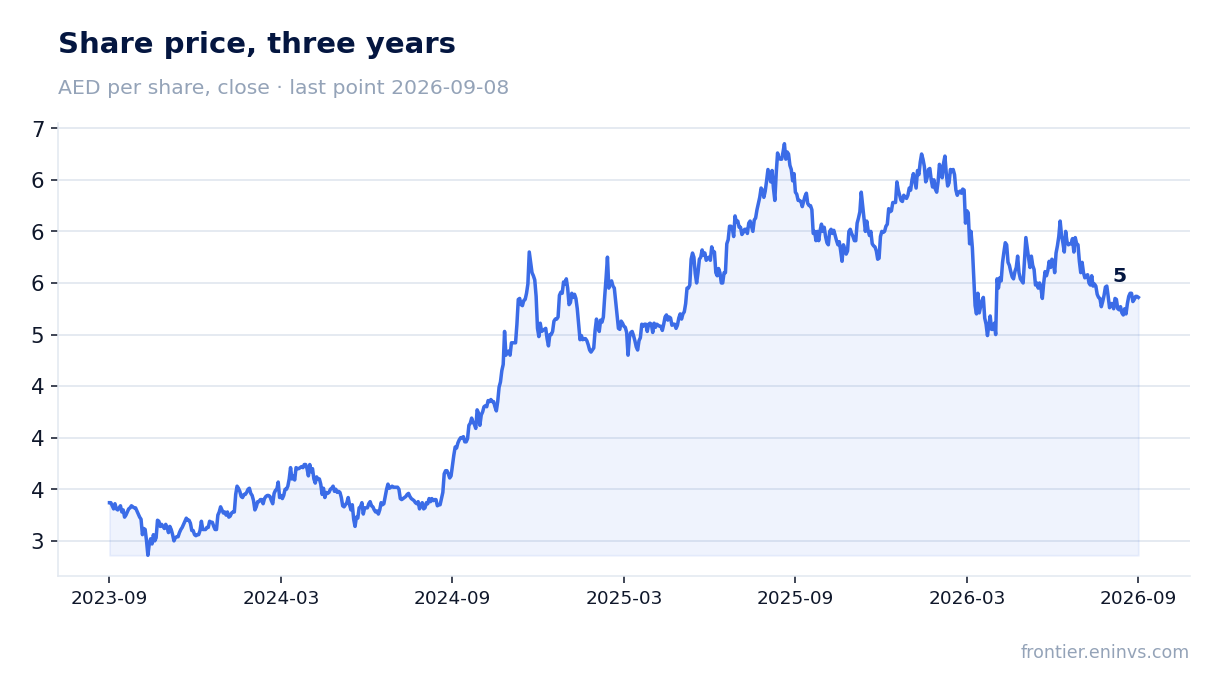
Net debt at the end of Q2 stood at AED 3,862.2 million, up AED 1.5 billion from the previous reporting date
At the end of Q2, Salik's net debt stood at AED 3,862.2 million, up AED 1.5 billion from the previous reporting date (end of Q1 2026: AED 2,384.5 million). Over the last twelve months, net debt increased by AED 0.2 billion.
The ratio of net debt to EBITDA for the last twelve months is 1.71 – a moderate level. The increase in debt in Q2 is likely related to the negative operating cash flow and possible investments. The company maintains financial stability, but the debt dynamics warrant attention.
On the portal's model, the share's upside is minus 14%, indicating overvaluation at current levels
According to the portal's model, based on EBITDA growth and a target multiple, the fair value of the share is 14% below the current market price. This implies that the market is valuing the company somewhat optimistically relative to our expectations.
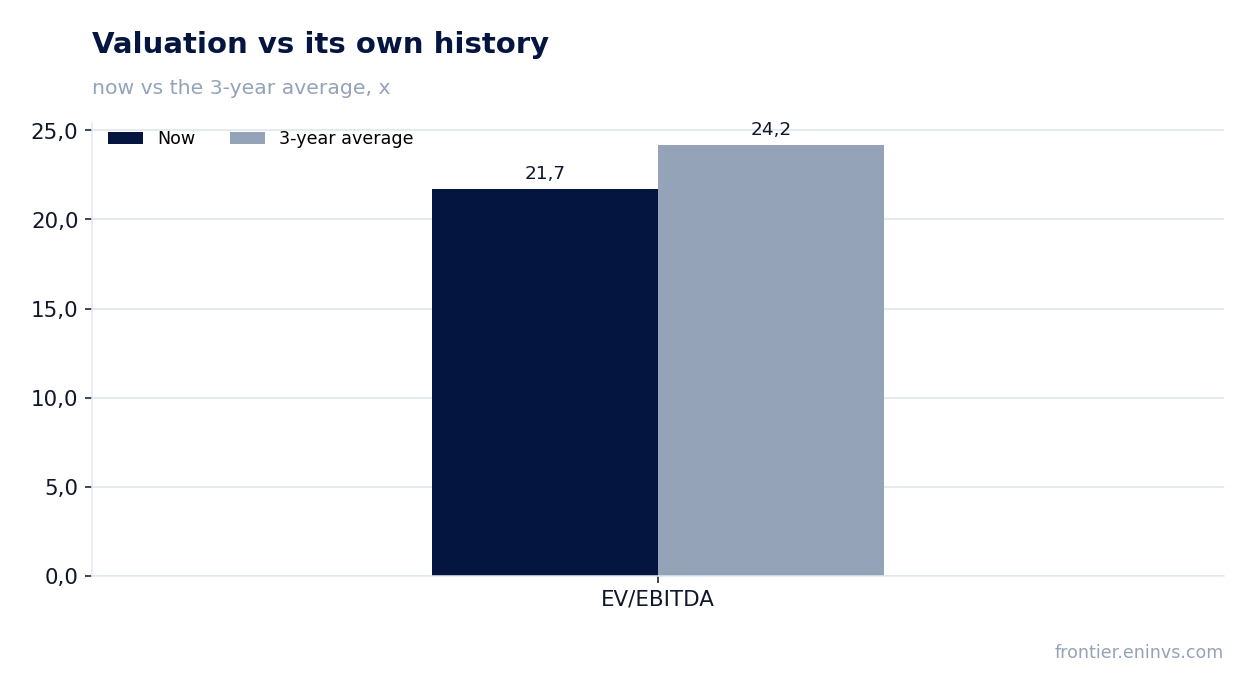
The current EV/EBITDA multiple is 21.7, below the three-year average of 24.2. However, given the decline in revenue and margins, as well as the modest dividend, the downside potential appears justified.
Valuation on the latest reported figures
| Metric | Value |
|---|---|
| Market cap | 40.7 bn AED |
| P/E (LTM) | 27.4 |
| EV/EBITDA (LTM) | 21.7 |
| P/B | 33.42 |
| Net debt / EBITDA (LTM) | 1.71 |
| Operating cash flow (LTM) | 2.10 bn |
| ROE | 84.3% |
| Dividend yield (12m) | 2.2% |
| EV/EBITDA, 3-year average | 24.2 |
Bottom line
The Q2 2026 report showed deterioration in key metrics: revenue fell 12.0%, EBITDA 14.0%, and net profit 16.4% YoY. Margins contracted, operating cash flow turned negative, and net debt increased. The company remains highly profitable, but the dynamics raise questions. Given the modest dividend yield and the downside potential on the portal's model, we rate the shares as 'neutral'.
Open the company's financial profile SALIK →
See also: market overview · valuation map · stock screeners