Genesis: FY 2026 profit up 2.7x, but the portal's model sees the shares 34% overvalued
Genesis's FY 2026 report showed revenue of AUD 1,700.0m (+89.4% YoY), EBITDA of AUD 945.1m (+104.0%) and net profit of AUD 601.8m (+172.1%). The EBITDA margin reached 54.2% versus 50.4% a year earlier, and the net margin was 34.5% versus 24.0%. At the same time, the LTM EV/EBITDA multiple of 9.6x is below its own three-year average of 12.1x, while the portal's model puts the shares 34% above fair value. At the current price the stock looks rather unattractive.
Key takeaways
— FY 2026 revenue rose 89.4% to AUD 1,700.0m – the growth came from production scale, not just prices
— EBITDA added 104.0% to AUD 945.1m, with the margin rising to 54.2% from 50.4% – growth outpaced revenue
— Net profit rose 172.1% to AUD 601.8m – the net margin climbed to 34.5% from 24.0%
— Leverage is negative: net cash of AUD 266.8m, with net debt/EBITDA LTM at minus 0.28
— LTM operating cash flow of AUD 935.2m comfortably covers dividend payments
— A dividend yield of 0.63% is small even with profit growth – the payout remains low
— LTM EV/EBITDA of 9.6x is below its own three-year average of 12.1x, but the portal's model implies 34% downside to fair value
Attractiveness
Key figures, AUD bn
| Metric | FY 2025 | FY 2026 | Change |
|---|---|---|---|
| Revenue | 0.92 | 1.74 | +89.4% |
| EBITDA | 0.46 | 0.95 | +104.0% |
| Operating profit | 0.32 | 0.78 | +145.2% |
| Net profit | 0.22 | 0.60 | +172.1% |
| Operating cash flow | 0.42 | 0.94 | +122.3% |
| Capex | 0.18 | 0.33 | +78.5% |
| EBITDA margin | 50.4% | 54.2% | +3.8 pp |
| Net margin | 24.0% | 34.5% | +10.5 pp |
FY 2026 revenue rose 89.4% to AUD 1,700.0m – the growth came from production scale, not just prices
Genesis's FY 2026 revenue came in at AUD 1,700.0m, up 89.4% from a year earlier. That growth rate is nearly double the previous year's pace and points to higher physical output rather than just a price tailwind.
For context, revenue a year earlier was significantly lower, and even allowing for favourable gold prices, a near-doubling of the top line signals new capacity or acquisitions. Without operating data it is hard to split the increase between price and volume, but the scale of the change confirms that expansion is in full swing.
The 89.4% revenue growth is not a one-off spike but the result of a consistent strategy to ramp up production. For an investor, the key question is whether the company can sustain this pace: the next report will show if the momentum holds at unchanged gold prices.
EBITDA added 104.0% to AUD 945.1m, with the margin rising to 54.2% from 50.4% – growth outpaced revenue
FY 2026 EBITDA reached AUD 945.1m, up 104.0% year on year. That outpaced revenue growth, lifting the EBITDA margin to 54.2% from 50.4% a year earlier.
The 3.8 percentage point margin improvement means the company is not just growing turnover but also controlling costs better. In mining, such an effect typically comes from scale, lower unit costs or favourable prices. Without a cost breakdown the exact driver cannot be pinpointed, but the fact remains: operating efficiency improved.
For an investor, margin expansion is a positive signal as it boosts cash flow and the ability to fund development without external borrowing. However, the sustainability of this level will depend on gold prices and stable production costs.
Net profit rose 172.1% to AUD 601.8m – the net margin climbed to 34.5% from 24.0%
Genesis's FY 2026 net profit was AUD 601.8m, up 172.1% year on year. Profit growth significantly outpaced revenue and EBITDA, with the net margin rising to 34.5% from 24.0%.
Such a sharp improvement in net profitability could stem not only from operations but also from lower finance costs, tax optimisation or one-off items. The report lacks detail, so it is impossible to claim that all of the increase came from core activities. Nevertheless, a profit level of AUD 601.8m confirms a strong earnings capacity.
For shareholders, the quality of profit matters as much as its size. If the growth is sustainable, it provides a base for dividends and further development. If a significant part of the increase is one-off, the effect may not repeat next year.
Leverage is negative: net cash of AUD 266.8m, with net debt/EBITDA LTM at minus 0.28
At the latest reporting date, Genesis's net debt was negative at minus AUD 266.8m, meaning the company has a net cash position. The net debt/EBITDA ratio for the trailing twelve months stands at minus 0.28.
Negative leverage means cash and equivalents exceed debt obligations. This gives the company significant financial flexibility: it can fund development, return capital to shareholders or withstand price shocks without the risk of breaching covenants.
Over the past 12 months, net debt decreased by AUD 0.2bn, confirming further balance sheet strengthening. Combined with high operating profit, such a safety cushion makes Genesis one of the more resilient players in the sector.
LTM operating cash flow of AUD 935.2m comfortably covers dividend payments
Operating cash flow over the trailing twelve months reached AUD 935.2m. That is below EBITDA but still a substantial sum, comfortably covering dividend payments and capital expenditure.
With a market capitalisation of AUD 9,340.9m and a dividend yield of 0.63%, annual payouts amount to roughly AUD 59m. Thus, operating cash flow covers dividends more than 15 times over, indicating a high degree of safety.
Free cash flow after capex is not disclosed in the FACTS, but even without that detail it is clear the company generates enough funds to sustain and grow the business. This reduces the need for external financing and supports credit quality.
A dividend yield of 0.63% is small even with profit growth – the payout remains low
Genesis's dividend yield over the trailing twelve months is 0.63%. With net profit of AUD 601.8m and a market capitalisation of AUD 9,340.9m, this means only a small portion of earnings is paid out.
Our estimate: if the company maintains its current payout ratio, the dividend for the current year may remain modest. However, given profit growth and no debt burden, management has room to increase payouts. It will all depend on dividend policy and capital allocation priorities – project development or returning cash to shareholders.
For an income-oriented investor, such a yield is hardly attractive: it is well below the risk-free rate. The main return in this name currently comes from capital appreciation, not dividends.
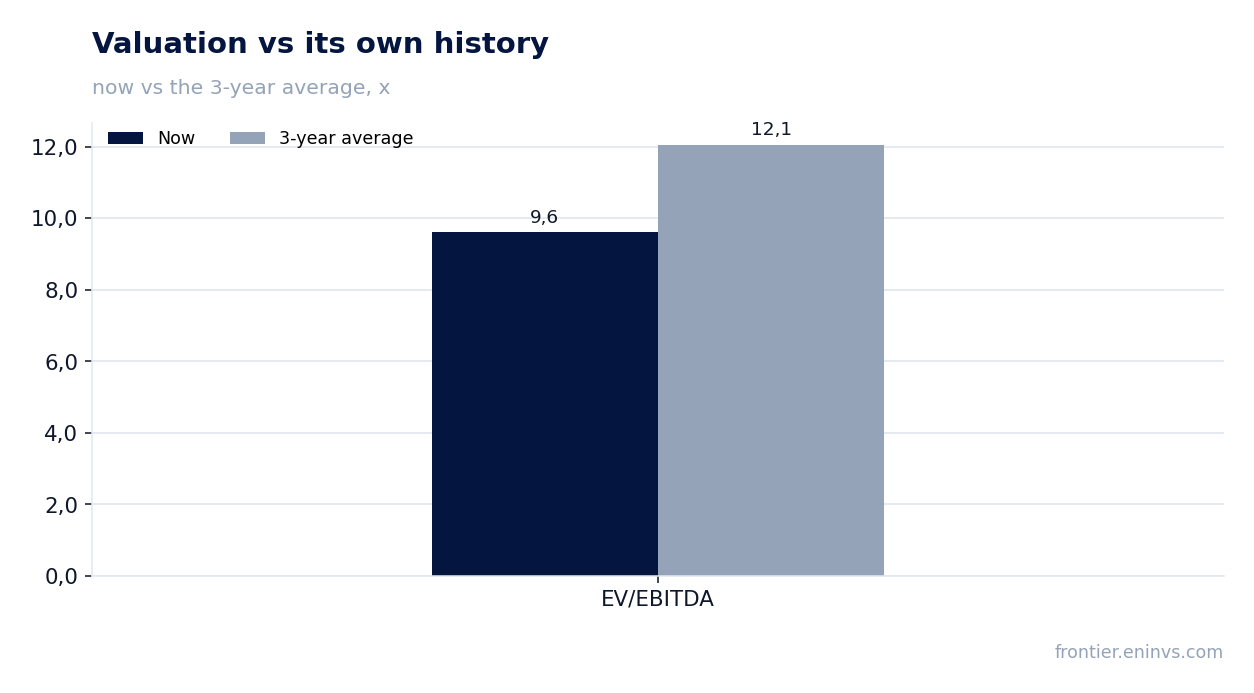
LTM EV/EBITDA of 9.6x is below its own three-year average of 12.1x, but the portal's model implies 34% downside to fair value
The current EV/EBITDA multiple for the trailing twelve months is 9.6x, below its own three-year average of 12.1x. This suggests the stock is trading cheaper than usual relative to its history.
However, the portal's model, which re-prices EBITDA at current commodity prices against a target EV/EBITDA, indicates that the fair value of the share is 34% below the current market price. This means that even with a historically low multiple, the market is pricing in higher earnings expectations than our model assumes.
The LTM P/E is 15.5, which may also seem modest against profit growth. But if current-year earnings prove unsustainable, the multiple will quickly rise. The relationship between price and historical valuation suggests limited upside and prevailing downside risk.
Valuation on the latest reported figures
| Metric | Value |
|---|---|
| Market cap | 9.34 bn AUD |
| P/E (LTM) | 15.5 |
| EV/EBITDA (LTM) | 9.6 |
| P/B | 4.50 |
| Net debt / EBITDA (LTM) | -0.28 |
| Operating cash flow (LTM) | 0.94 bn |
| ROE | 35.0% |
| Dividend yield (12m) | 0.6% |
| EV/EBITDA, 3-year average | 12.1 |
Bottom line
Genesis delivered a strong FY 2026 report: revenue rose 89.4%, EBITDA 104.0%, net profit 172.1%. The EBITDA margin reached 54.2%, and the net margin 34.5%. The company has a net cash position of AUD 266.8m and generates significant operating cash flow of AUD 935.2m. However, while the LTM EV/EBITDA of 9.6x is below its three-year average, the portal's model implies 34% downside to fair value, and the dividend yield is only 0.63%. At the current price the stock looks rather unattractive.
Open the company's financial profile GMD →
See also: market overview · valuation map · stock screeners