Rare earths and lithium rewrote the mining playbook while coal and oil stalled
This season's Australian corporate results were defined by a stark divergence: battery and technology metals delivered explosive growth, while traditional energy and bulk commodities barely moved. Rare earths and lithium posted median revenue growth of +80.2% and +73.0% respectively, whereas coal mining managed just +0.9% and oil & gas +1.6%. The gap between the hottest and coldest sectors exceeded 80 percentage points, a clear signal that the market is rewarding future-facing commodities and punishing the old economy.
Revenue growth by industry (median YoY)
Rare earths and lithium delivered the goods, but gold miners quietly shone
Lynas Rare Earths (LYC) led the charge with revenue up 80.2% year over year, while EBITDA surged 184.7%. Pilbara Minerals (PLS) matched that momentum in lithium, with revenue up 73.0% and net profit up a staggering 368.6%. But the real standout was Mineral Resources (MIN), which combines iron ore, lithium, and services: revenue rose 44.5%, EBITDA jumped 232.4%, and net profit soared 217.4%. These three names alone show that exposure to battery materials and diversified operations can produce outsized gains.
Gold miners also impressed, with Genesis Minerals (GMD) posting revenue growth of 89.4%, EBITDA up 104.0%, and net profit up 172.1%. Evolution Mining (EVN) delivered a solid 27.7% revenue increase and 76.2% EBITDA growth. The sector's median revenue growth of 66.1% underscores that gold's safe-haven appeal is translating into real financial performance.
Coal and oil & gas were the ugly ducklings of the season
Coal mining barely grew revenue (+0.9% median), and profitability collapsed. New Hope (NHC) saw EBITDA fall 32.4% and net profit plunge 63.4%. Whitehaven Coal (WHC) reported revenue down 7.4% and net profit down 40.7%, despite EBITDA rising 35.8% — a sign of margin pressure. Yancoal (YAL) posted revenue up 11.8% but net profit crashed 89.6%. Oil & gas was equally disappointing: Santos (STO) revenue inched up 1.6% but EBITDA fell 17.6% and net profit dropped 19.1%. These results highlight the sector's struggle with weak prices and cost inflation.
The plot twist: IGO's profit explosion despite falling revenue
In a season where revenue growth was king, IGO (IGO) delivered a genuine surprise: revenue fell 9.7% year over year, yet EBITDA skyrocketed 143.9% and net profit jumped 115.2%. This decoupling of revenue and profit is rare and suggests a massive margin expansion, likely from cost cuts or one-off gains. It's a warning sign that not all growth is created equal — and that the market may be mispricing this turnaround story.
Cheap for the growth: Regis Resources and Mineral Resources are bargains
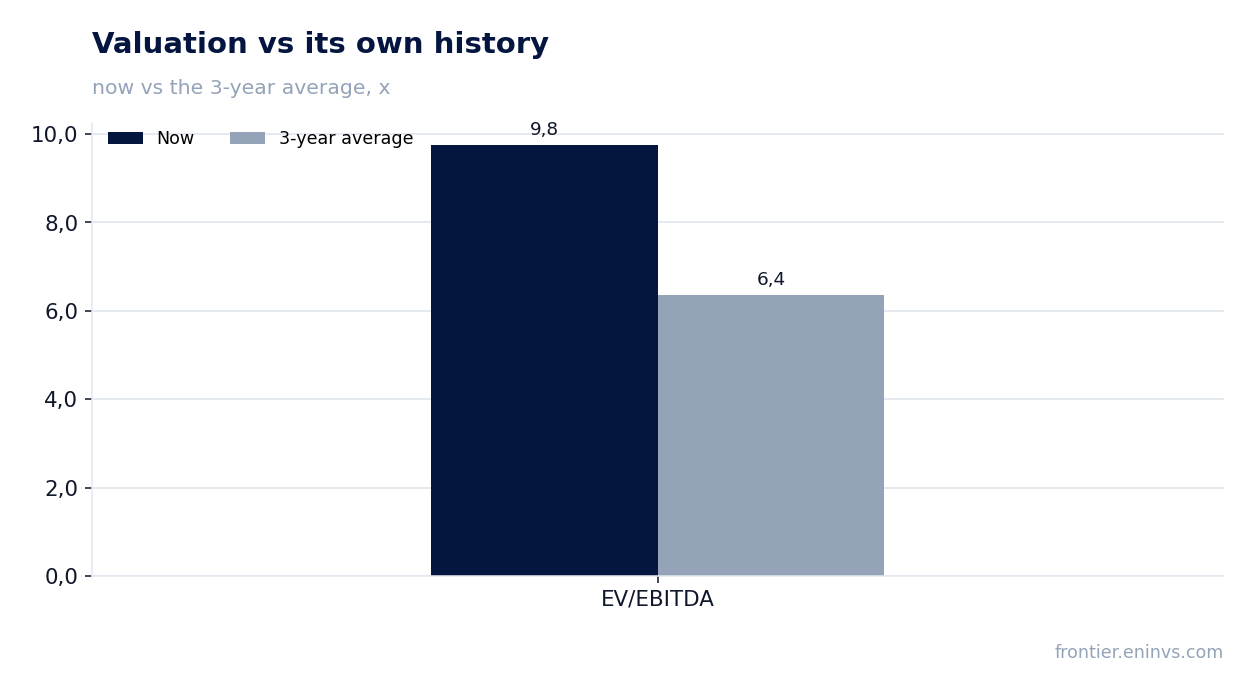
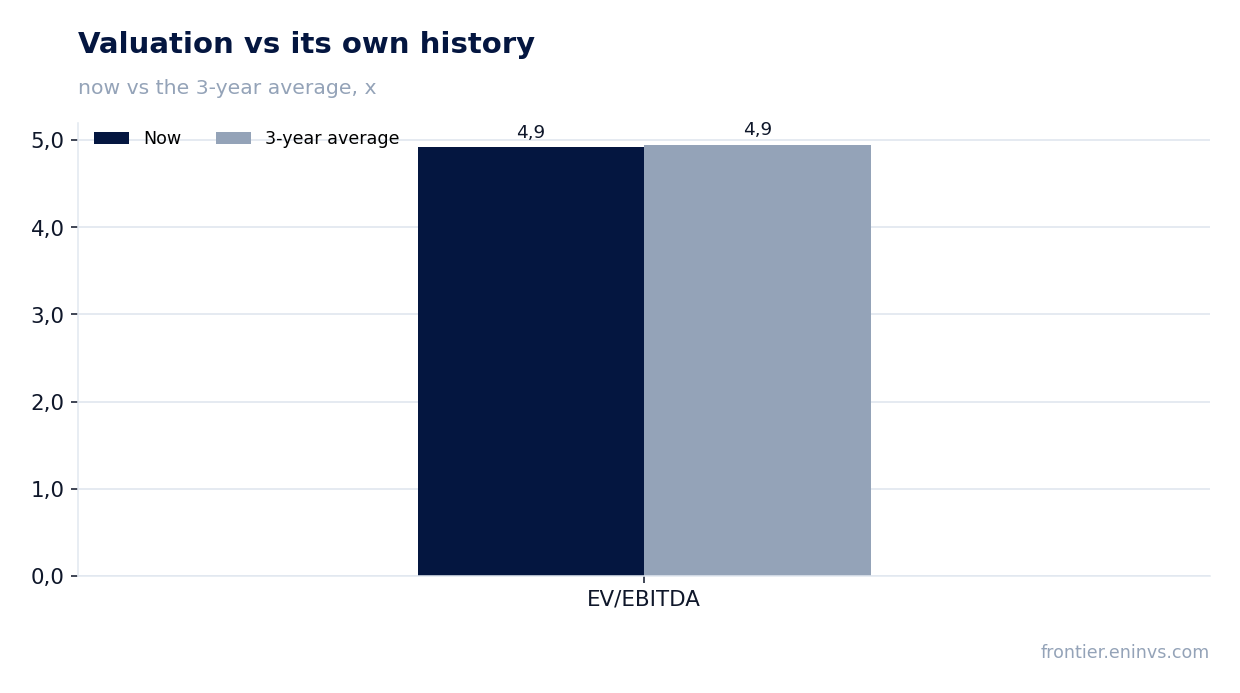
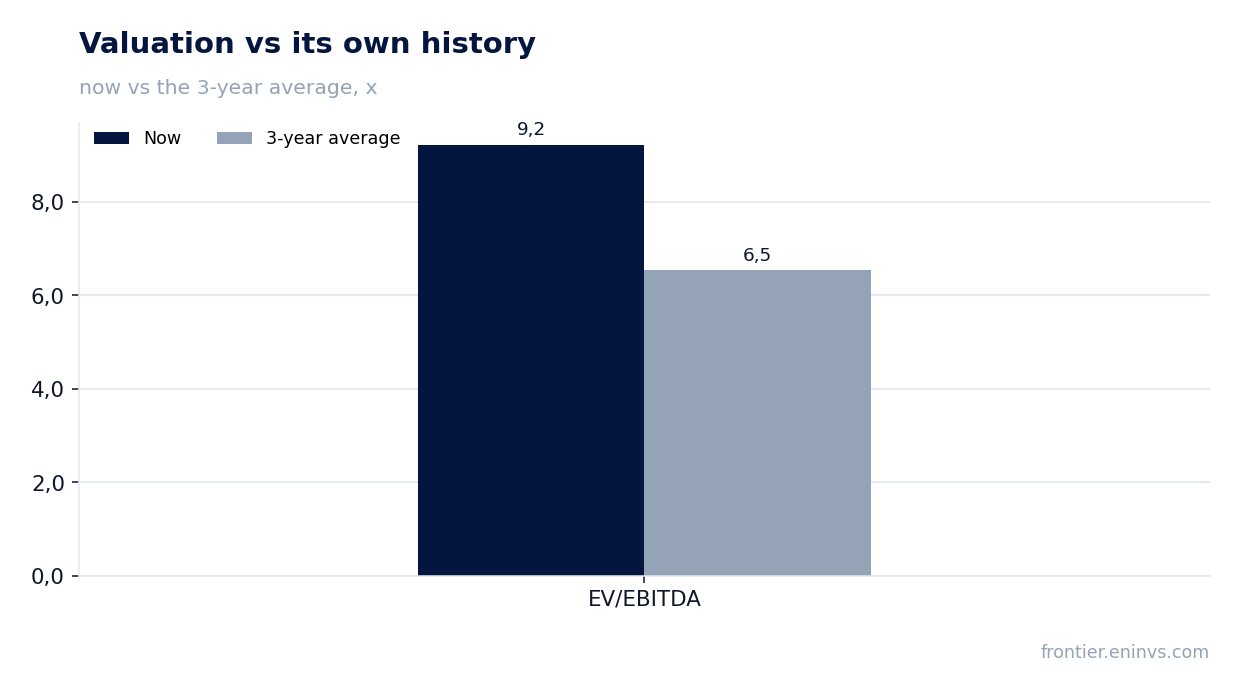
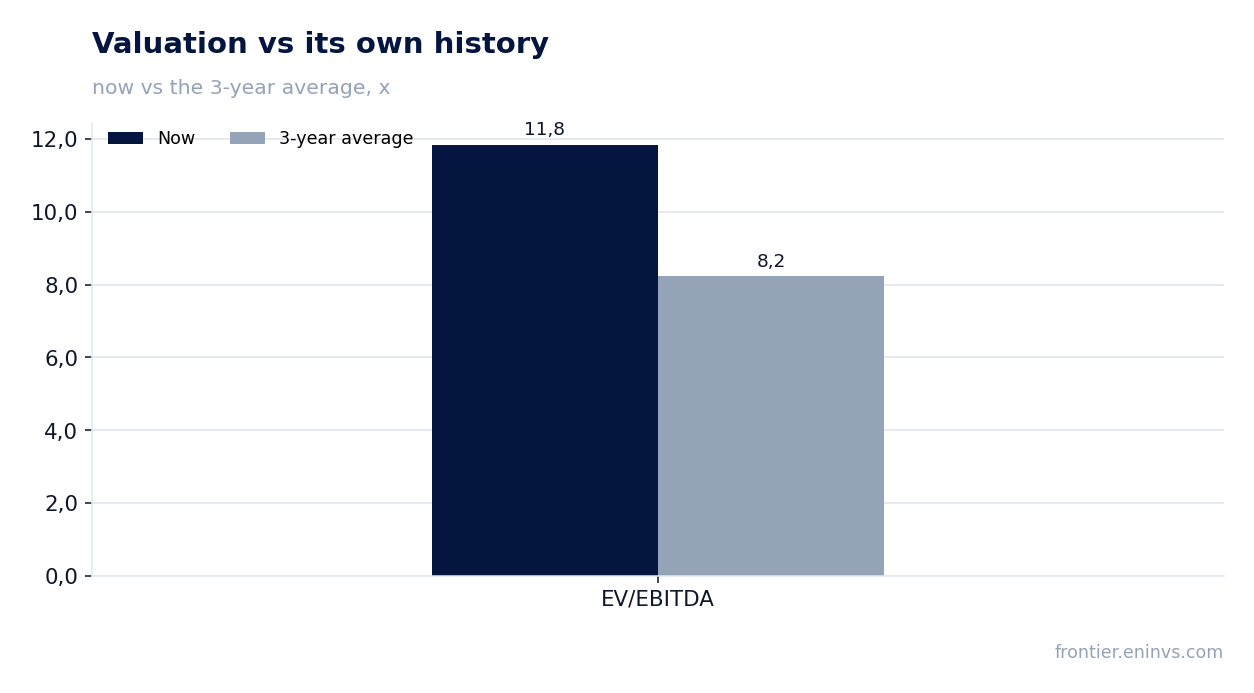
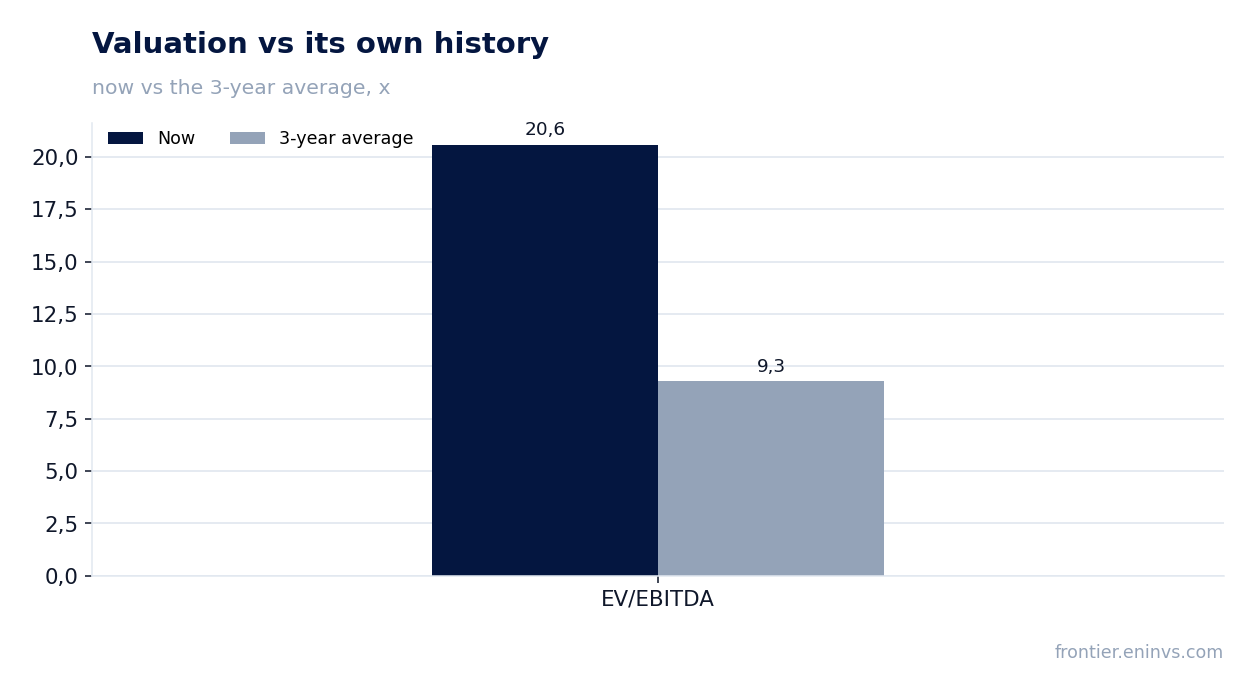
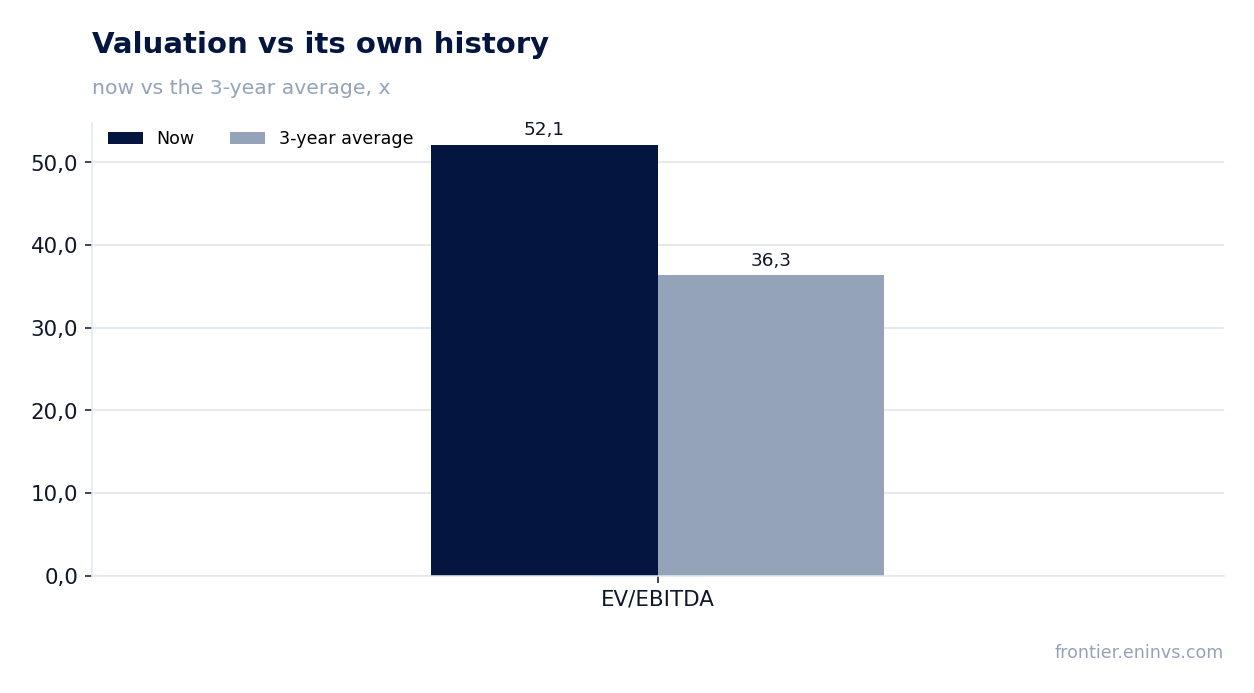
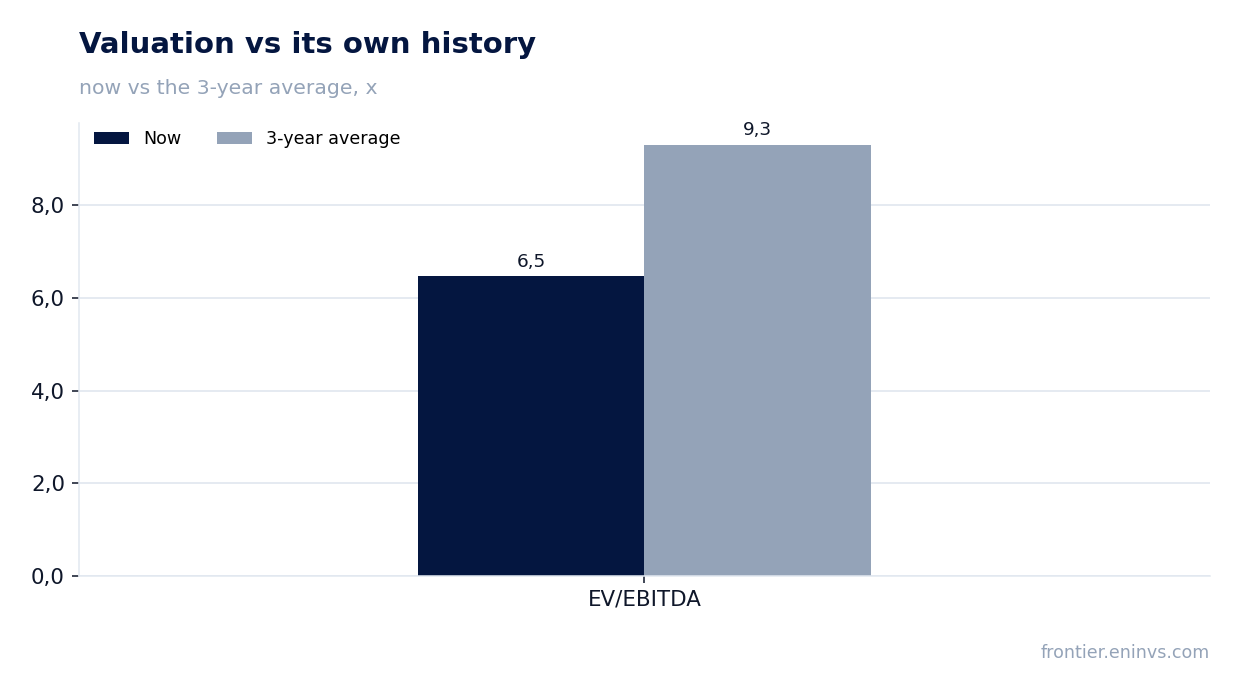
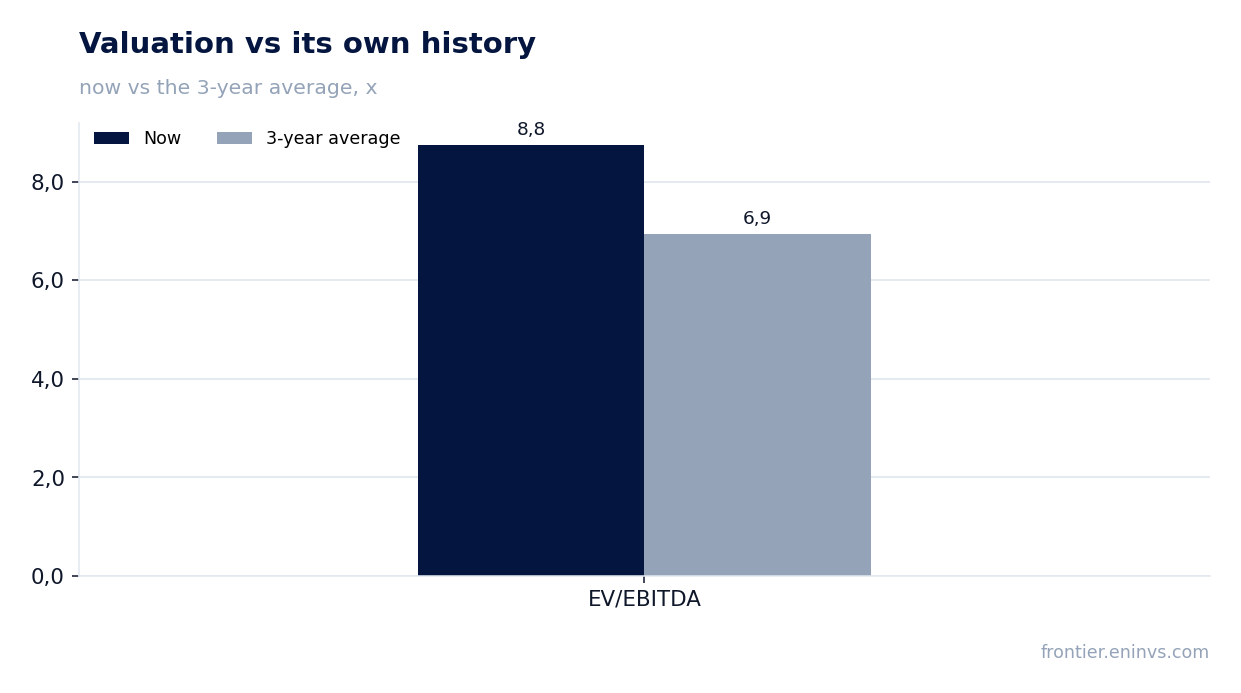
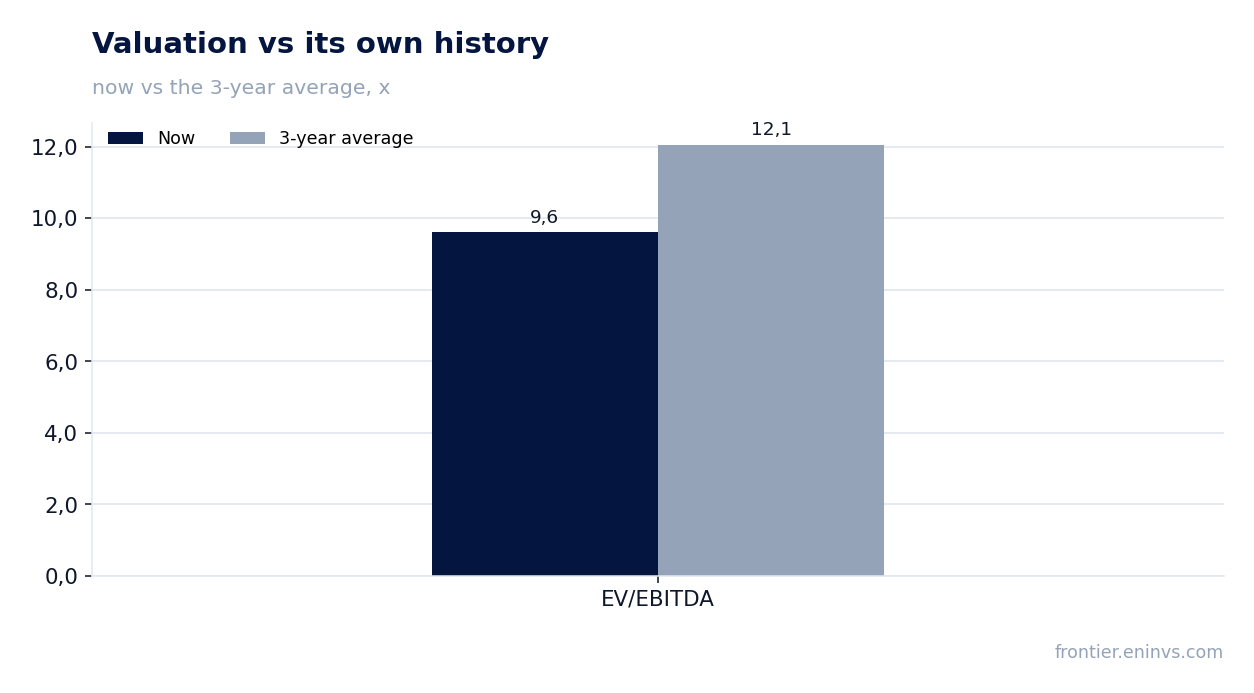
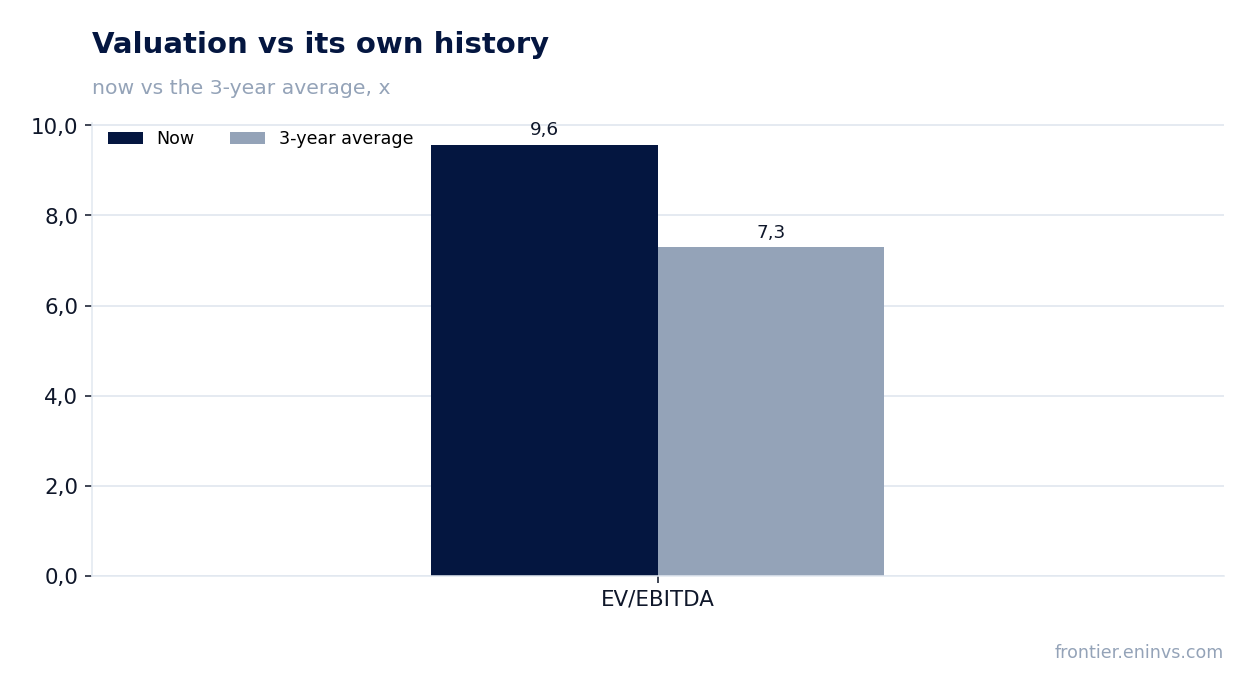
Regis Resources (RRL) trades at a P/E of 7.8x and EV/EBITDA of 3.4x while growing revenue 42.8% and net profit 181.1% — a clear value opportunity. Mineral Resources (MIN) is similarly attractive at 9.5x earnings and 5.5x EV/EBITDA, with revenue up 44.5%. In contrast, Lynas (LYC) looks priced for perfection at 58.6x earnings and 43.4x EV/EBITDA, despite 80.2% revenue growth. IGO's 33.6x P/E and 62.3x EV/EBITDA seem stretched given its revenue decline. For value-focused investors, the gold and diversified miners offer the best risk-reward.
Income hunters: Whitehaven and Yancoal offer hefty yields
Whitehaven Coal (WHC) offers the highest dividend yield in our coverage, though the exact yield is not provided. Yancoal (YAL) also provides a strong yield, making coal miners the income champions despite their growth struggles. For investors prioritizing dividends, these names warrant a closer look, but beware of the underlying earnings volatility.
Looking at the long view, Northern Star Resources (NST) stands out with a 3-year revenue CAGR of +360.7%, reflecting a massive transformation. Genesis Minerals (GMD) also impresses with a +182.9% CAGR. In contrast, Pilbara Minerals (PLS) has a -29.1% CAGR, highlighting the boom-bust nature of lithium. As we look ahead, watch for whether the battery materials rally can sustain its momentum and if the laggards can engineer a turnaround. The divergence between future-facing and traditional commodities is likely to persist, making stock selection critical.
Players: growth & yield (no absolute levels)
| Company | Industry | Revenue YoY | EBITDA YoY | Net profit YoY | P/E |
|---|---|---|---|---|---|
| Northern Star Resources (FY) | Gold mining | n/m | +23.0% | +24.2% | 20.5x |
| Fortescue (FY) | Iron ore | +9.2% | -3.7% | -14.9% | 12.0x |
| Woodside Energy (H1) | Oil & LNG | +13.0% | +5.8% | +27.1% | 13.4x |
| Mineral Resources (FY) | Iron / lithium / services | +44.5% | +232.4% | +217.4% | 9.5x |
| South32 (FY) | Diversified mining | +0.6% | -1.2% | +410.3% | 14.1x |
| Evolution Mining (FY) | Gold mining | +27.7% | +76.2% | +59.3% | 18.1x |
| Whitehaven Coal (FY) | Coal mining | -7.4% | +35.8% | -40.7% | 16.1x |
| Yancoal Australia (H1) | Coal mining | +11.8% | -11.1% | -89.6% | 25.6x |
| Santos (H1) | Oil & gas | +1.6% | -17.6% | -19.1% | 26.2x |
| Regis Resources (FY) | Gold mining | +42.8% | +73.3% | +181.1% | 7.8x |
| New Hope (FY) | Coal mining | +0.9% | -32.4% | -63.4% | 30.6x |
| Genesis Minerals (FY) | Gold mining | +89.4% | +104.0% | +172.1% | 13.9x |
| Sandfire Resources (FY) | Copper mining | +38.9% | +57.6% | +281.6% | 20.1x |
| Pilbara Minerals (FY) | Lithium | +73.0% | +262.3% | +368.6% | 22.7x |