Pilbara: AUD 525.8m trailing profit, negative net debt, and a 20.6x EV/EBITDA valuation
Pilbara's FY 2026 report showed revenue of AUD 1,500.0m, up 73.0% year on year, and EBITDA of AUD 720.4m, up 262.3%. The EBITDA margin reached 46.8% versus 22.3% a year earlier, while the net margin was 34.1% versus negative 22.0%. Over the trailing twelve months, net profit was AUD 525.8m, net debt was negative at AUD -1,339.2m, and EV/EBITDA LTM stood at 20.6 against a three-year average of 9.3. At the current price the stock looks neutral: the strong operational turnaround is already reflected in the valuation, and the 1.03% dividend yield offers little support.
Key takeaways
— Revenue rose 73.0% year on year to AUD 1,500.0m, but this is a recovery from a weak year, not a new sustainable level.
— EBITDA jumped 262.3% to AUD 720.4m, with the margin expanding to 46.8% from 22.3% – the increase was driven mainly by lithium prices, not volumes.
— Net profit over the trailing twelve months was AUD 525.8m, reversing a loss, with a net margin of 34.1%.
— Negative net debt of AUD 1,339.2m and a net debt/EBITDA ratio of -1.86 make the balance sheet strong, but this is a consequence of past high lithium prices.
— The dividend yield is only 1.03% and the payout ratio is not disclosed – distributions remain modest against capital expenditure.
— EV/EBITDA LTM of 20.6 is more than double the three-year average of 9.3, limiting upside even with the portal model's +22% fair value estimate.
— Return on equity of 24.2% looks high, but it reflects peak earnings rather than a sustainable return.
Attractiveness
Key figures, AUD bn
| Metric | FY 2025 | FY 2026 | Change |
|---|---|---|---|
| Revenue | 0.89 | 1.54 | +73.0% |
| EBITDA | 0.20 | 0.72 | +262.3% |
| Operating profit | -0.02 | 0.45 | to profit |
| Net profit | -0.20 | 0.53 | to profit |
| Operating cash flow | 0.15 | 1.36 | +833.3% |
| Capex | 0.65 | 0.34 | -47.4% |
| EBITDA margin | 22.3% | 46.8% | +24.5 pp |
| Net margin | -22.0% | 34.1% | +56.1 pp |
Revenue rose 73.0% year on year to AUD 1,500.0m, but this is a recovery from a weak year, not a new sustainable level.
Pilbara's FY 2026 revenue was AUD 1,500.0m, up 73.0% from a year earlier. This growth is mainly explained by the low base of the previous year, when lithium prices were at a minimum. The company does not disclose sales volumes in the provided facts, so it cannot be claimed that growth was driven solely by higher shipments.
For comparison, revenue a year earlier was significantly lower, and the company recorded a loss. The current revenue level may still be unsustainable if lithium prices fall again. The market is already pricing in a recovery, as indicated by the high EV/EBITDA valuation.
EBITDA jumped 262.3% to AUD 720.4m, with the margin expanding to 46.8% from 22.3% – the increase was driven mainly by lithium prices, not volumes.
FY 2026 EBITDA was AUD 720.4m, up 262.3% year on year. The EBITDA margin reached 46.8% versus 22.3% a year earlier. Such margin growth is typical for commodity companies during periods of rising product prices: operating costs grow slower than revenue.
The company does not disclose the cost structure in the provided facts, so it is impossible to say exactly which cost line contributed to the margin growth. However, such a sharp expansion in margin with revenue growth of 73.0% indicates strong operating leverage. If lithium prices remain high, the margin may hold, but any price decline will have the opposite effect.
Net profit over the trailing twelve months was AUD 525.8m, reversing a loss, with a net margin of 34.1%.
Over the trailing twelve months, Pilbara's net profit was AUD 525.8m. This is a reversal from a loss a year earlier, when the net margin was negative at -22.0%. The current net margin is 34.1%, reflecting high profitability at peak lithium prices.
FY 2026 profit includes one-off factors that the company does not detail in the provided data. Without them, the sustainability of this profit level remains questionable. For investors, the key issue is not the reversal itself, but the company's ability to generate profit at lower prices.
Negative net debt of AUD 1,339.2m and a net debt/EBITDA ratio of -1.86 make the balance sheet strong, but this is a consequence of past high lithium prices.
Pilbara's net debt at the latest reporting date was negative at AUD -1,339.2m. This means cash and equivalents exceed debt obligations. The net debt/EBITDA LTM ratio is -1.86, confirming a strong balance sheet.
The reduction in net debt over the last 12 months was RUB 0.8bn, but the reporting currency is Australian dollars, so this figure is for reference and should not be directly compared with the balance sheet. The company does not disclose its debt structure, but the negative figure indicates that Pilbara has accumulated significant cash reserves during the period of high prices. This provides resilience but does not guarantee the preservation of such a buffer if prices fall.
The dividend yield is only 1.03% and the payout ratio is not disclosed – distributions remain modest against capital expenditure.
Pilbara's dividend yield over the trailing twelve months is 1.03%. The company does not disclose the size of the last paid dividend or the payout ratio, so it is impossible to assess what share of profit is returned to shareholders. With net profit of AUD 525.8m and a market capitalisation of AUD 16,162.0m, even a generous payout would not provide a high yield.
We cannot make a forecast for the current year's dividend due to the lack of data on the payout policy. However, if current profit is maintained and the payout ratio were, for example, 30%, the dividend could be around AUD 158m, giving a yield of about 1% – still below the key rate. The main risk to the dividend is a fall in lithium prices and the need to fund capital expenditure.
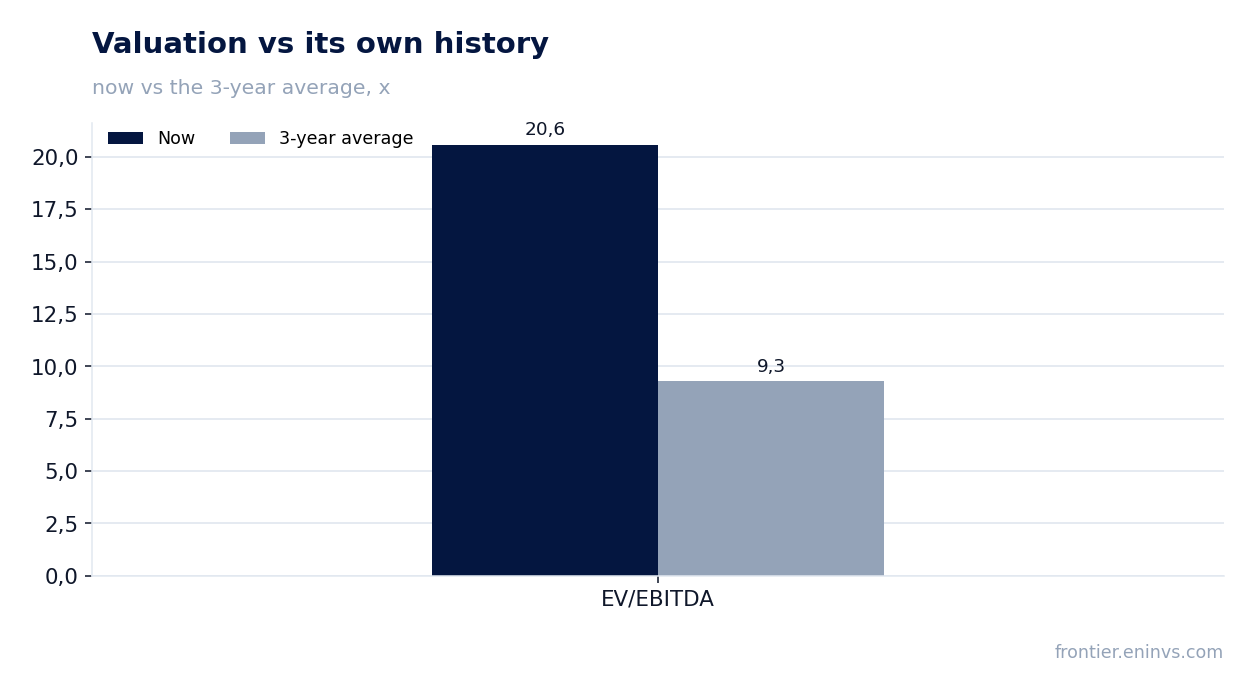
EV/EBITDA LTM of 20.6 is more than double the three-year average of 9.3, limiting upside even with the portal model's +22% fair value estimate.
Pilbara's EV/EBITDA LTM is 20.6, significantly above the three-year average of 9.3. This means the market values current EBITDA at a premium to its historical level. The P/E LTM is 30.7, also indicating a high valuation of earnings. Such a premium is justified only if the market expects high lithium prices to persist.
According to the portal's model, the fair value of the share is 22% above the current market price. This is our own calculation based on EBITDA growth and a target multiple. However, even with this upside, the valuation looks stretched: to justify the current multiple, the company needs not just to maintain but to increase EBITDA. If lithium prices fall, the multiple could quickly revert to its historical average, leading to a price decline.
Return on equity of 24.2% looks high, but it reflects peak earnings rather than a sustainable return.
Pilbara's return on equity is 24.2%. This is a high figure, but it was achieved on the back of peak profit. As lithium prices normalise and the net margin declines, ROE could fall substantially. For comparison, a year earlier the company incurred losses, and ROE was negative.
Investors should assess ROE in the context of the lithium price cycle. The current level is not sustainable, and incorporating it into long-term models is risky. The company does not disclose its capital structure, but negative net debt means a significant portion of assets is financed from own funds, which inflates ROE.
Valuation on the latest reported figures
| Metric | Value |
|---|---|
| Market cap | 16.2 bn AUD |
| P/E (LTM) | 30.7 |
| EV/EBITDA (LTM) | 20.6 |
| P/B | 3.96 |
| Net debt / EBITDA (LTM) | -1.86 |
| Operating cash flow (LTM) | 1.40 bn |
| ROE | 24.2% |
| Dividend yield (12m) | 1.0% |
| EV/EBITDA, 3-year average | 9.3 |
Bottom line
Pilbara delivered a strong operational turnaround: revenue rose 73.0%, EBITDA jumped 262.3%, and trailing twelve-month net profit reached AUD 525.8m. However, this result was driven mainly by lithium prices, not sustainable volume growth. The EV/EBITDA valuation of 20.6 is more than double the three-year average of 9.3, already reflecting the recovery. The 1.03% dividend yield offers no support. At the current price the stock looks neutral: the portal model's +22% upside is balanced by the risks of falling lithium prices and multiple compression.
Open the company's financial profile PLS →
See also: market overview · valuation map · stock screeners