Evolution: profit up 59%, but the portal's model sees 28% downside

26 августа Evolution раскрыла результаты за финансовый год 2026, завершившийся 30 июня. Выручка выросла на 27,7% до 5 600,0 млн AUD, EBITDA — на 76,2% до 3 135,5 млн AUD, чистая прибыль — на 59,3% до 1 475,1 млн AUD. Акции торгуются по мультипликатору EV/EBITDA LTM 9,6 против собственного трёхлетнего среднего 7,3, и наш модельный расчёт указывает на потенциал снижения в 28% — при такой оценке бумага выглядит скорее непривлекательной.
Key takeaways
— EBITDA выросла на 76,2% благодаря росту выручки и расширению маржи
— Маржа EBITDA достигла 56,4% против 40,9% годом ранее
— Чистая прибыль выросла на 59,3%, маржа по чистой прибыли — до 26,5%
— Долговая нагрузка остаётся низкой: net debt / EBITDA LTM составляет 0,02
— Модель портала оценивает акцию на 28% ниже текущей цены
— Бумага входит в стратегию AU Commodity-Upside, но это не аргумент для вердикта
Attractiveness
Key figures, AUD bn
| Metric | FY 2025 | FY 2026 | Change |
|---|---|---|---|
| Revenue | 4.35 | 5.56 | +27.7% |
| EBITDA | 1.78 | 3.14 | +76.2% |
| Operating profit | 1.43 | 2.37 | +65.3% |
| Net profit | 0.93 | 1.48 | +59.3% |
| Operating cash flow | 1.97 | 2.64 | +34.1% |
| Capex | 1.18 | 1.20 | +2.4% |
| EBITDA margin | 40.9% | 56.4% | +15.5 pp |
| Net margin | 21.3% | 26.5% | +5.2 pp |
EBITDA grew 76.2% on higher revenue and margin expansion
In fiscal 2026, Evolution's revenue grew 27.7% to A$5,600.0m. EBITDA jumped 76.2% to A$3,135.5m — more than double the pace of revenue, indicating significant operating leverage.
The main driver was margin expansion: EBITDA margin reached 56.4% versus 40.9% a year earlier. This shows the company not only increased volumes but also materially improved its cost structure — likely due to higher gold prices and cost control.
EBITDA margin reached 56.4% versus 40.9% a year earlier
Margin expansion of 15.5 percentage points is the key event of the report. From 40.9% a year ago, the company reached 56.4% in fiscal 2026. This is among the highest in the sector, reflecting favourable pricing and operational efficiency.
This dynamic means each additional dollar of revenue now yields significantly more profit than before. However, such a high margin may be partly due to peak gold prices, and its sustainability will be tested in the next reporting period.
Net profit grew 59.3%, net margin up to 26.5%
Net profit for fiscal 2026 was A$1,475.1m, up 59.3% year on year. Net margin rose from 21.3% to 26.5% — profit growth was slower than EBITDA, indicating higher finance costs or taxes, but final profitability remains high.
Trailing twelve months net profit is A$1,475.1m, corresponding to a P/E LTM of 20.3. This is noticeably higher than many gold miners, raising questions about valuation fairness.
Leverage remains low: net debt / EBITDA LTM is 0.02
At the latest balance sheet date, Evolution's net debt was A$60.2m, and net debt / EBITDA LTM was just 0.02. This is an extremely conservative level, giving the company significant financial flexibility for investments or shareholder returns.
Over the last 12 months, net debt declined by A$0.9bn (in ruble equivalent), confirming the company's ability to generate excess cash flow. Operating cash flow for the last 12 months was A$2,600.0m, more than enough to cover capex and dividends.
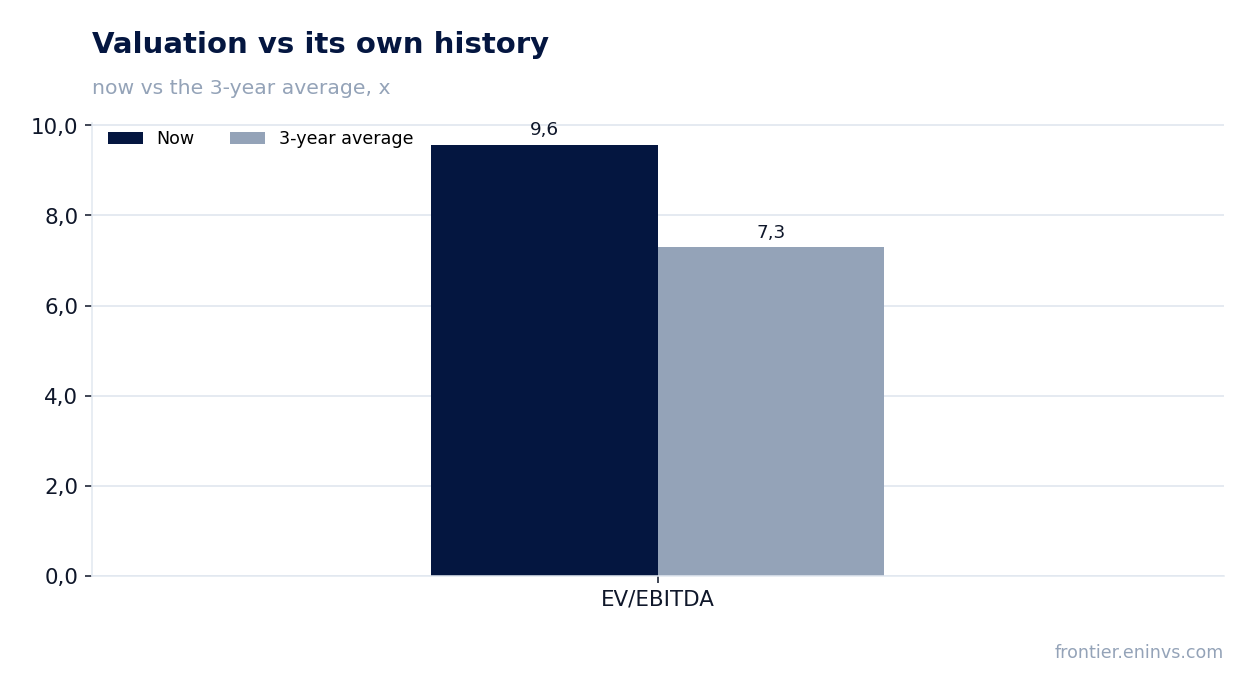
The portal's model values the share 28% below the current price
According to the portal's model, which re-prices EBITDA at current commodity prices and applies a target EV/EBITDA multiple, the fair value of the share is 28% below the current market price. This means the market has already priced in an optimistic scenario for gold prices and margins.
The current EV/EBITDA LTM multiple is 9.6 versus the three-year average of 7.3. The share trades at a premium to its own history, making it vulnerable to a correction if gold prices or operating metrics disappoint.
The share is in the AU Commodity-Upside strategy, but this is not an argument for the verdict
Evolution is currently held in our AU Commodity-Upside strategy on the portal. Inclusion in the strategy follows its own screening criteria and is not a recommendation to buy or sell.
We state this fact for transparency: it does not influence our verdict, which is based solely on fair value assessment and fundamentals.
Valuation on the latest reported figures
| Metric | Value |
|---|---|
| Market cap | 30.0 bn AUD |
| P/E (LTM) | 20.3 |
| EV/EBITDA (LTM) | 9.6 |
| P/B | 5.14 |
| Net debt / EBITDA (LTM) | 0.02 |
| Operating cash flow (LTM) | 2.60 bn |
| ROE | 24.3% |
| Dividend yield (12m) | 1.4% |
| EV/EBITDA, 3-year average | 7.3 |
Bottom line
Evolution delivered a strong report: revenue and EBITDA grew at double-digit rates, margins reached 56.4%, and leverage remained minimal. However, much of the growth was driven by favourable pricing, and the EV/EBITDA multiple of 9.6 is well above its own three-year average of 7.3. The portal's model indicates 28% downside, making the share rather unattractive at current levels. A revision of the verdict would require either a lower price in line with historical valuation or confirmation of margin sustainability at less favourable gold prices.
Open the company's financial profile EVN →
See also: market overview · valuation map · stock screeners