Northern Star: EBITDA и прибыль растут, но выручка упала на 65,9% из-за продажи концентрата и перехода на новую мощность
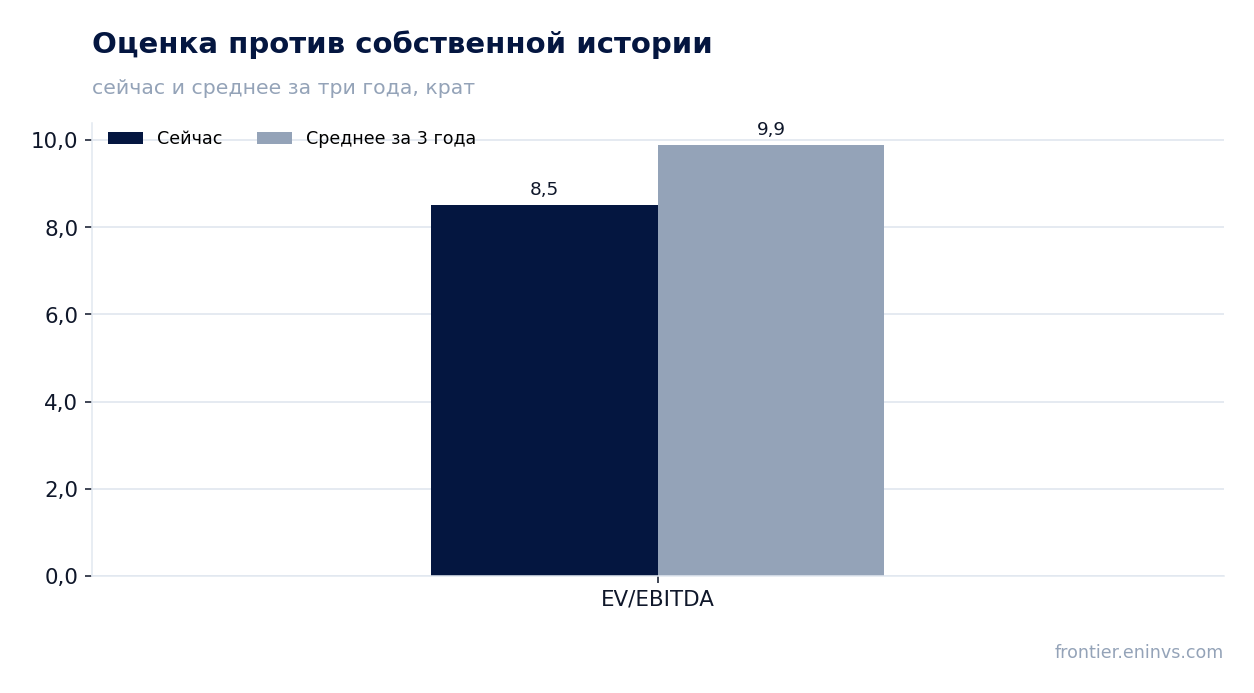
29 июля 2026 года Northern Star раскрыла результаты за финансовый год, закончившийся 30 июня 2026. За отчётный период выручка упала на 65,9% до 7 000 млн AUD, тогда как EBITDA выросла на 22,0% до 3 806,1 млн AUD, а чистая прибыль – на 24,2% до 1 547,7 млн AUD. Рост прибыли при обвале выручки объясняется переходом на новую мощность и продажей концентрата, что искажает сопоставимость. При текущей цене акция выглядит скорее привлекательно: мультипликатор EV/EBITDA (8,5x) ниже собственного трёхлетнего среднего (9,9x), а чистый долг отрицательный.
Главные тезисы
— Выручка упала на 65,9% из-за продажи концентрата и перехода на новую мощность, но EBITDA выросла на 22,0%
— EBITDA-маржа взлетела до 187,2% с 52,3% год назад – это эффект низкой базы и разовых статей
— Чистая прибыль выросла на 24,2%, но маржа чистой прибыли 76,2% против 20,9% год назад – результат разовых факторов
— Чистый долг отрицательный: минус 1 018,1 млн AUD, при этом долг вырос на 0,4 млрд RUB за квартал и на 0,7 млрд RUB за 12 месяцев
— KCGM Mill Expansion в стадии пусконаладки: капитальные затраты 713 млн AUD за год, проект на финальной стадии
— Обратный выкуп акций на 129 млн AUD в квартале – компания возвращает капитал, но дивидендная доходность всего 1,07%
— По модели портала акция переоценена на 7%: справедливая стоимость ниже текущей цены
Оценка привлекательности
Ключевые показатели, млрд AUD
| Показатель | FY 2025 | FY 2026 | Изм. |
|---|---|---|---|
| Выручка | 6,41 | 2,19 | -65,9% |
| EBITDA | 3,35 | 4,09 | +22,0% |
| Операционная прибыль | 1,99 | 2,50 | +25,6% |
| Чистая прибыль | 1,34 | 1,66 | +24,2% |
| Операционный денежный поток | 2,95 | 3,18 | +7,8% |
| Капзатраты | 2,30 | 2,71 | +18,1% |
| Рентабельность по EBITDA | 52,3% | 187,2% | +134,9 п.п. |
| Чистая маржа | 20,9% | 76,2% | +55,3 п.п. |
Выручка упала на 65,9% из-за продажи концентрата и перехода на новую мощность, но EBITDA выросла на 22,0%
За финансовый год, закончившийся 30 июня 2026, выручка Northern Star составила 7 000,0 млн AUD, что на 65,9% ниже, чем годом ранее. Падение связано с тем, что компания в отчётном периоде продавала золотой концентрат (74 тыс. унций за год) и переходила на новую мощность переработки, что изменило структуру выручки.
При этом EBITDA выросла на 22,0% до 3 806,1 млн AUD. Рост обеспечен операционной эффективностью: все три производственных центра генерировали положительный чистый денежный поток от рудников в размере 1 179 млн AUD за год. Компания подтвердила, что затраты AISC в 2 698 AUD/унцию остались в пределах первоначального прогноза.
EBITDA-маржа взлетела до 187,2% с 52,3% год назад – это эффект низкой базы и разовых статей
EBITDA-маржа за отчётный период составила 187,2% против 52,3% годом ранее. Такой скачок невозможен без разовых факторов: в выручку не попали продажи концентрата, которые учитываются как отдельная статья, а EBITDA включает неденежные статьи, такие как переоценка запасов и хеджирование.
Компания отмечает, что в отчётном периоде был кредит по неденежному движению запасов в размере 190 млн AUD за год, что увеличило EBITDA. Поэтому маржа 187,2% не отражает операционную рентабельность, а является артефактом учёта.
Чистая прибыль выросла на 24,2%, но маржа чистой прибыли 76,2% против 20,9% год назад – результат разовых факторов
Чистая прибыль за отчётный период составила 1 547,7 млн AUD, что на 24,2% выше, чем годом ранее. Чистая маржа достигла 76,2% против 20,9% в прошлом году. Такой уровень маржинальности несопоставим с операционной деятельностью – он вызван теми же разовыми статьями, что и EBITDA, включая неденежные движения запасов и, вероятно, налоговые эффекты.
В отчёте упоминается, что налоговая амортизация по проекту Hemi начнётся с даты приобретения, что даст экономию по налогам около 200 млн AUD в FY27 и 150–200 млн AUD в FY28. Это может частично объяснить повышенную чистую прибыль в отчётном периоде.
Чистый долг отрицательный: минус 1 018,1 млн AUD, при этом долг вырос на 0,4 млрд RUB за квартал и на 0,7 млрд RUB за 12 месяцев
На последнем балансе чистый долг Northern Star составил минус 1 018,1 млн AUD, то есть денежные средства и золото в слитках превышают долг. Отношение чистого долга к EBITDA за последние 12 месяцев – минус 0,27, что означает нетто-кэш.
При этом за квартал чистый долг вырос на 0,4 млрд AUD, а за 12 месяцев – на 0,7 млрд AUD. Рост связан с капитальными затратами на расширение KCGM и обратным выкупом акций. Компания сохраняет невыбранные кредитные линии на 1 750 млн AUD и имеет облигации на 600 млн USD.
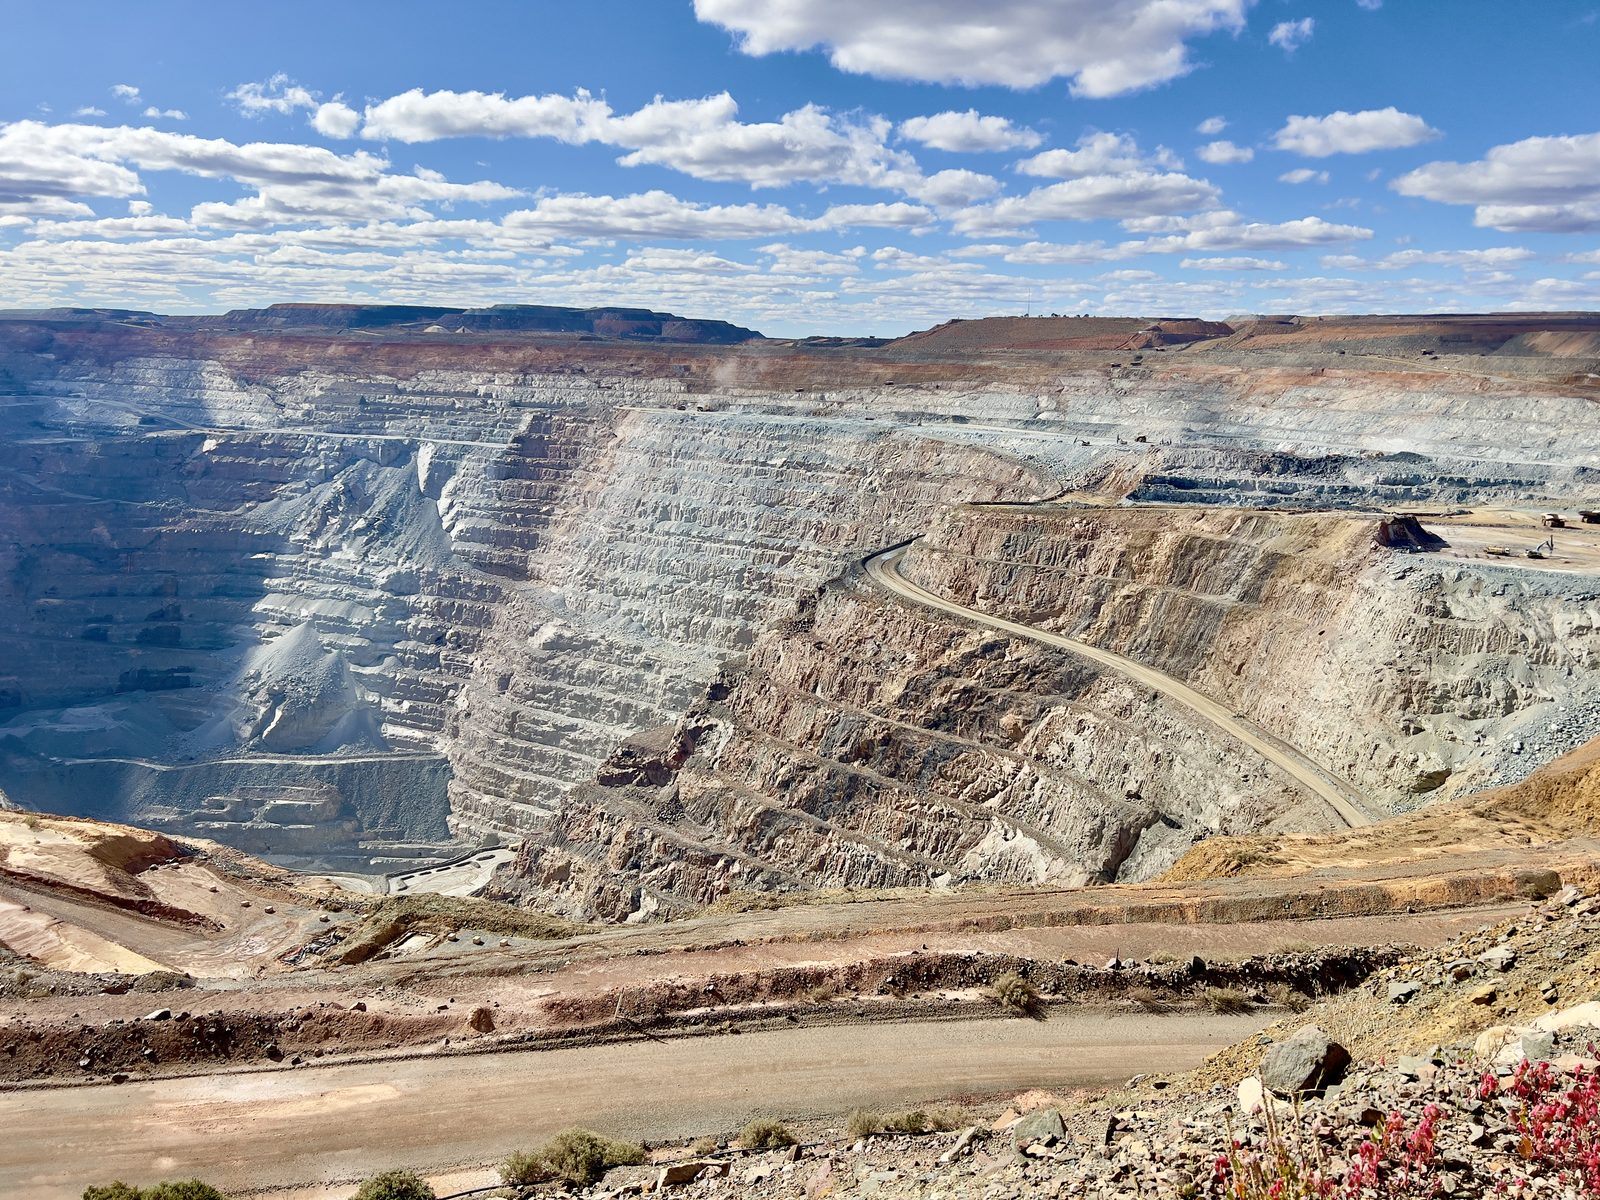
KCGM Mill Expansion в стадии пусконаладки: капитальные затраты 713 млн AUD за год, проект на финальной стадии
Ключевое событие отчёта – начало пусконаладки первой стадии расширения фабрики KCGM, которая увеличит мощность переработки до 27 млн тонн в год. Капитальные затраты по проекту за финансовый год составили 713 млн AUD, чуть выше пересмотренного прогноза в 680–700 млн AUD. Общие затраты с начала проекта достигли 1 605 млн AUD.
Вторая стадия, которая объединит переработку в единый центр, должна завершиться во второй половине FY27 и дать прирост извлечения на 1–2%. Компания ожидает выхода на устойчивую мощность 27 млн тонн в год к FY29. Это объясняет, почему выручка временно снизилась: компания сознательно использует низкосортную руду в период пусконаладки.
Обратный выкуп акций на 129 млн AUD в квартале – компания возвращает капитал, но дивидендная доходность всего 1,07%
В июньском квартале Northern Star выкупила акций на 129 млн AUD в рамках программы объёмом до 500 млн AUD. Это часть политики возврата капитала акционерам. За последние 12 месяцев дивидендная доходность составила 1,07% – скромно для золотодобытчика.
Компания генерирует сильный денежный поток: операционный денежный поток за последние 12 месяцев – 3 200,0 млн AUD. Свободный денежный поток до выкупа составил 206 млн AUD за квартал, что позволяет финансировать и стройку, и возврат капитала.
По модели портала акция переоценена на 7%: справедливая стоимость ниже текущей цены
Наша модель портала, которая пересчитывает EBITDA по текущим ценам на золото и применяет целевой мультипликатор EV/EBITDA, показывает, что акция торгуется на 7% выше справедливой стоимости. Это означает, что рынок уже закладывает успешный запуск KCGM и рост производства.
Текущий мультипликатор EV/EBITDA за последние 12 месяцев – 8,5x, что ниже собственного трёхлетнего среднего в 9,9x. P/E за последние 12 месяцев – 21,6x. Акция торгуется с дисконтом к своей истории, но модель портала указывает на ограниченный потенциал роста.
Оценка по последним отчётным данным
| Метрика | Значение |
|---|---|
| Капитализация | 33,4 млрд AUD |
| P/E (LTM) | 21,6 |
| EV/EBITDA (LTM) | 8,5 |
| P/B | 2,13 |
| Чистый долг / EBITDA | -0,27 |
| Операционный денежный поток (LTM) | 3,20 млрд |
| ROE | 12,1% |
| Дивидендная доходность (12 мес) | 1,1% |
| EV/EBITDA, среднее за 3 года | 9,9 |
Итог
Сильная сторона отчёта – операционная эффективность: EBITDA выросла на 22%, все три центра генерируют денежный поток, а чистый долг отрицательный. Разовые статьи, такие как неденежные движения запасов, искажают маржу, но не меняют картину устойчивого бизнеса. Главный вопрос для держателя – успеет ли KCGM выйти на полную мощность к FY29 и не съедят ли капитальные затраты денежный поток. При текущей цене акция выглядит скорее привлекательно: мультипликатор ниже собственной истории, но модель портала показывает ограниченный апсайд.
Перейти к финансовой карточке компании NST →
Смотрите также: обзор рынка · карта оценки рынков · скринеры акций