Barnwell Industries: loss narrowed threefold, but one-off cost savings carried it, not revenue

On 11 August Barnwell Industries reported results for its third fiscal quarter ended 30 June 2026. Revenue rose 5.9% year on year to $3.379 million, the first growth in six quarters, the EBITDA margin reached 12.6% against minus 23.7% a year earlier, and the net loss narrowed to $0.44 million from $1.55 million. The 36.3 percentage point margin improvement looks strong, but it rests on administrative cost cuts after the relocation from Honolulu to Houston rather than on production growth. With an EV/EBITDA of 4.47 and negative operating cash flow over the trailing twelve months, the share looks neutral: the reporting inflection is real, but confirmation of its durability is still missing.
Key takeaways
— Revenue grew for the first time in six quarters, but only by 5.9% — not enough to reverse the annual base decline
— The margin was carried by administrative cost cuts, not by production
— The net loss narrowed threefold, but it includes $0.187 million of non-cash charges
— Operating cash flow over the trailing twelve months is negative — minus $1.9 million
— There is no debt, but the $4.467 million cash cushion is all that remains after asset sales
— The EV/EBITDA multiple of 4.47 is the level the market gives for liquidation, not for growth
Attractiveness
Key figures, USD bn
| Metric | Q3 2025 | Q3 2026 | Change |
|---|---|---|---|
| Revenue | 0.00 | 0.00 | +5.9% |
| EBITDA | -0.00 | 0.00 | to profit |
| Operating profit | -0.00 | 0.00 | to profit |
| Net profit | -0.00 | -0.00 | — |
| Operating cash flow | -0.00 | -0.00 | — |
| Capex | 0.00 | 0.00 | -99.2% |
| EBITDA margin | -23.7% | 12.6% | +36.3 pp |
| Net margin | -48.7% | -13.0% | +35.7 pp |
Revenue grew for the first time in six quarters, but only by 5.9% — not enough to reverse the annual base decline
In the third fiscal quarter of 2026 revenue was $3.379 million against $3.192 million a year earlier, up 5.9%. This is the first positive annual figure after five quarters of decline: in the first quarter of 2024 the drop was 36.1%, in the second quarter of 2025 — 32.3%, in the third quarter of 2025 — 42.2%, in the first quarter of 2025 — 30.2%, in the second quarter of 2026 — 29.0%. The inflection is clear, but the comparison base is already very low.
Production drove the growth: the company reported 82 thousand barrels of oil equivalent for the quarter against 75 thousand in the previous quarter, a 9% sequential increase. Oil prices were also high, and the company explicitly mentions the positive impact of elevated prices. At the same time, revenue for the nine months of fiscal 2026 was $8.660 million against $10.695 million a year earlier — a 19% decline remains, and one quarter does not reverse it.
A sustainable turnaround requires a series of growing quarters, not just one. For now, trailing twelve-month revenue is $11.7 million, still below prior-year levels. The next report will show whether this was a random spike on a low base or the start of a trend.
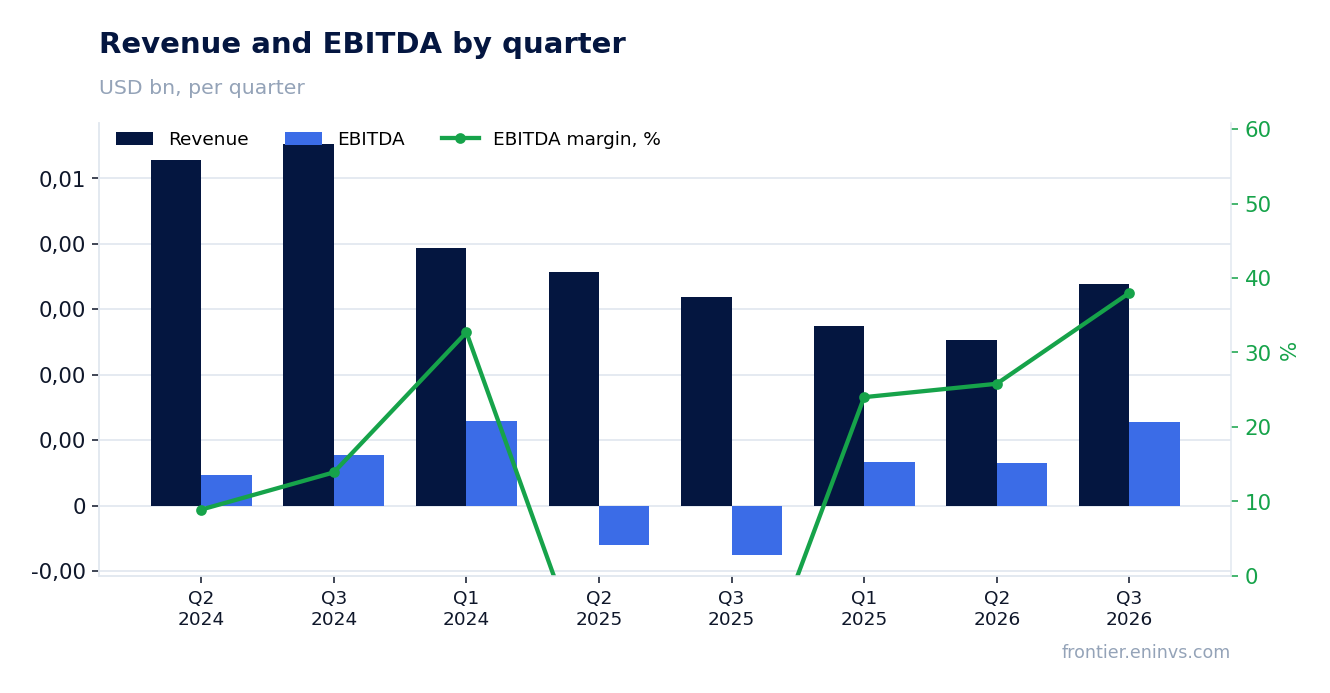
The margin was carried by administrative cost cuts, not by production
The EBITDA margin in the third fiscal quarter of 2026 was 12.6% against minus 23.7% a year earlier. The 36.3 percentage point improvement is a result not so much of revenue growth as of cost reduction. General and administrative expenses fell to $1.409 million from $1.521 million in the previous quarter, and cash G&A expenses — to $1.280 million from $1.392 million, an 8% sequential decline.
The company completed the relocation of its headquarters from Honolulu to Houston and established a new finance team. Salaries, wages and bonuses declined 12% compared to the previous quarter. It is these measures, not operating leverage from production, that made the main contribution to the margin. Oil and gas operating results increased by $0.670 million to $0.757 million, but that is a consequence of both higher prices and lower depletion expense.
The durability of such a margin is questionable: administrative cost savings have limits, and one-off factors such as insurance recoveries of $0.026 million in the previous quarter will not repeat. If oil prices decline, the margin will compress again, since the company's operating leverage is weak.
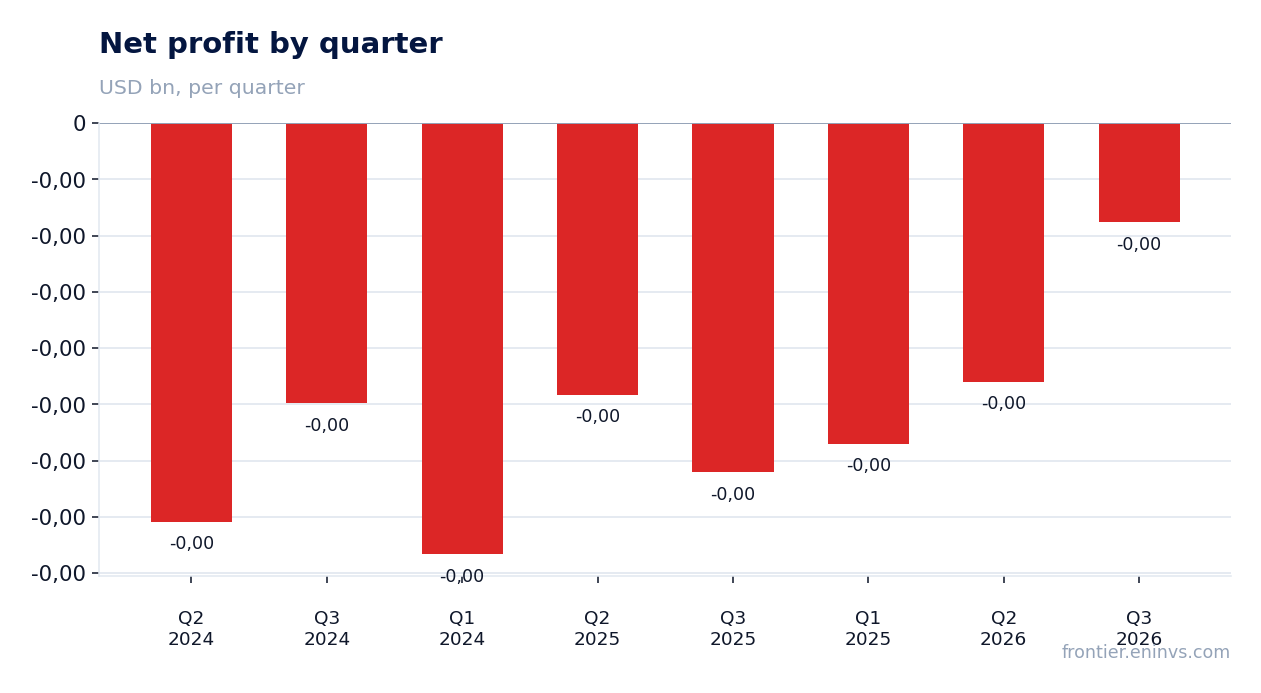
The net loss narrowed threefold, but it includes $0.187 million of non-cash charges
The net loss in the third fiscal quarter of 2026 was $0.44 million against $1.55 million a year earlier. A more than threefold reduction. However, the loss includes non-cash items: accretion of asset retirement obligation — $0.187 million, depreciation and depletion — $0.546 million, SERP expenses — $0.026 million. Without these items the loss would be substantially smaller.
The company also recorded a foreign currency loss of $0.056 million against a gain of $0.058 million in the previous quarter. This is a small impact, but it shows that part of the result depends on currency fluctuations rather than operating activity.
Adjusted EBITDA, as calculated by the company, was $0.425 million against minus $0.369 million in the previous quarter. This is a positive shift, but the amount is still small relative to the scale of the business. Loss per share narrowed to $0.03 from $0.15 a year earlier, reflecting both the improved result and an increase in the number of shares to 14.3 million from 10.1 million.
Operating cash flow over the trailing twelve months is negative — minus $1.9 million
Over the trailing twelve months operating cash flow was minus $1.9 million. In the third fiscal quarter of 2026 it was also negative — minus $0.7 million, as in the previous quarter — minus $0.655 million. This is an alarming signal: even with positive EBITDA, the company is not generating cash from operations.
At the same time, capital expenditures in the third quarter were minimal — $0.019 million, indicating that the company is not investing in development. In the previous quarter they were $0.222 million. Free cash flow remains negative, and the company covers its needs through asset sales and available cash.
Cash on the balance sheet is $4.467 million, and the company remains debt-free. However, if operating cash flow does not turn positive, the cash cushion will shrink. This is a key risk to the sustainability of the current valuation.
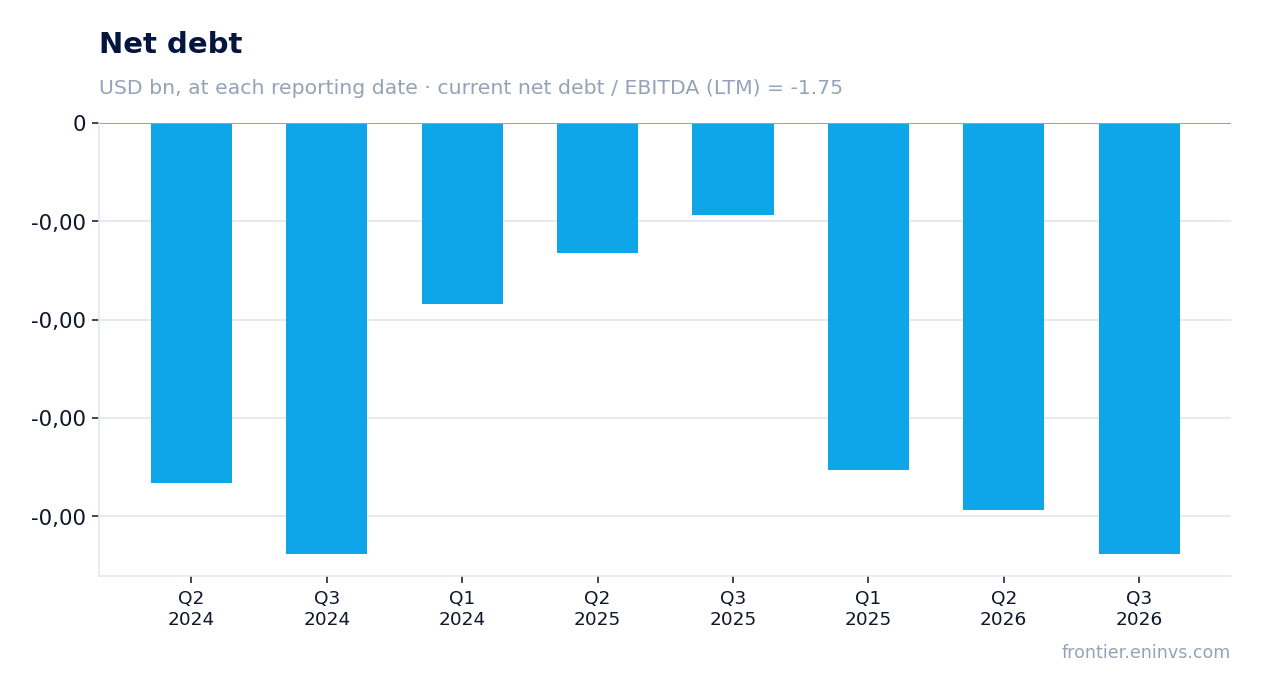
There is no debt, but the $4.467 million cash cushion is all that remains after asset sales
The company remains debt-free: net debt is negative at minus $2.793 million as of the latest reporting date. The net debt to EBITDA ratio for the trailing twelve months is minus 1.75. This is a level, not a direction: we do not have an earlier value for this ratio, so we cannot speak of leverage rising or falling. Importantly, there is no debt burden, which provides financial flexibility.
Cash and equivalents are $4.467 million, working capital is $3.070 million. The company has completed its exit from Hawaii real estate development: in July 2026 it signed an agreement to sell its remaining interests for $1.55 million in cash at a gross price of $1.77 million, plus an expected additional distribution of about $0.77 million before closing. The deal is expected to close before 30 September 2026.
Thus, the cash cushion is largely formed through asset sales rather than operating activity. This allows the company to fund current expenses and seek new opportunities, but it does not create value unless profitable use of capital is found.
The EV/EBITDA multiple of 4.47 is the level the market gives for liquidation, not for growth
EV/EBITDA over the trailing twelve months is 4.47. This is a low multiple, reflecting both the low EBITDA base ($1.6 million) and uncertainty about the company's future. Market capitalisation is $10.07 million, net debt is negative, which increases EV relative to capitalisation.
Comparison with its own history is not possible due to lack of data: the FACTS do not contain a three-year average for this multiple. However, it can be said that the current level is close to the lower bound of the historical range for such companies, reflecting market pessimism. At the same time, ROE is negative — minus 6.9%, confirming unprofitability.
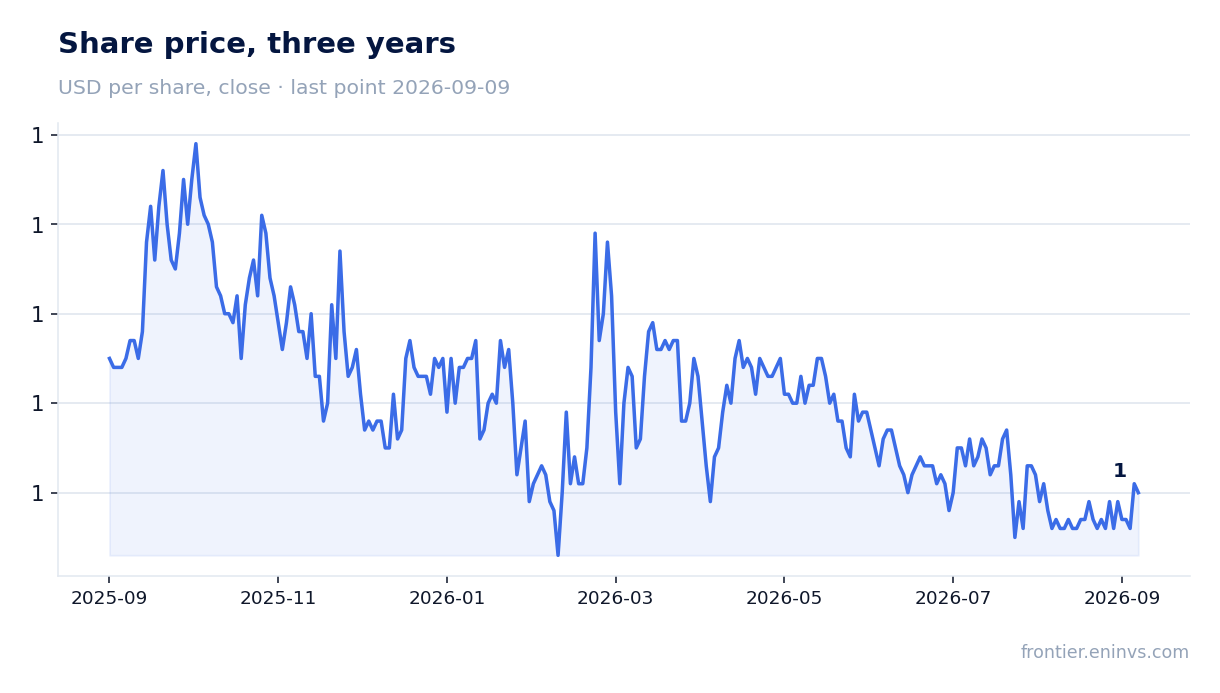
The share closed at $0.97 before the report, fell 1.0% on the release day, and has risen 3.1% from the release to 9 September 2026. The market reaction is muted: investors are likely awaiting confirmation of the sustainability of improvements. A re-rating would require either sustained positive operating cash flow or the announcement of a transformative transaction.
Valuation on the latest reported figures
| Metric | Value |
|---|---|
| Market cap | 0.01 bn USD |
| EV/EBITDA (LTM) | 4.5 |
| P/B | 1.44 |
| Net debt / EBITDA (LTM) | -1.75 |
| Operating cash flow (LTM) | -0.00 bn |
| ROE | -6.9% |
Bottom line
The report for the third fiscal quarter of 2026 showed real progress: revenue grew for the first time in six quarters, the loss narrowed threefold, and the margin turned positive. However, this progress is largely due to one-off factors — administrative cost cuts after the relocation and high oil prices. Operating cash flow remains negative, and the company has not yet demonstrated an ability to generate cash from core operations. With an EV/EBITDA of 4.47 and no debt, the share looks neutral: there is re-rating potential, but it requires confirmation of sustainable improvements in the coming quarters.
Open the company's financial profile BRN →
See also: market overview · valuation map · stock screeners