Frontierby eninvs

Language: EN · RU

Region: COMMODITIES

Key commodities — 1-day change · 2026-07-10
Brent 76.23 ▲ +0.2%
WTI 71.22 ▼ -0.8%
Henry Hub 2.98 ▼ -1.0%
Copper 13,819 ▲ +0.2%
Aluminum 3,154 ▼ -1.7%
Nickel 16,560 ▼ -0.1%
Zinc 3,614 ▼ -0.4%
Gold 4,097 ▼ -0.6%
Silver 59.48 ▼ -0.9%
Iron Ore 98.70 +0.0%
Coking Coal 234 ▲ +0.2%
Uranium 85.55 +0.0%
Our recommended portfolios
Performance & current holdings of our strategies for this market — why it makes sense to join.
Global Commodities● live +131.4%
CAGR +16% · vs index +2% · Sharpe 0.49 · maxDD -61%
Day+0.1%S&P 500 +0.8%
Week+0.0%S&P 500 +0.8%
YTD+25.6%S&P 500 +11.2%

Rows are ordered partly by extraction health (share of stable periods). Hover a row for OK / partial / error counts.

CompanyCountrySectorUpsideDiv. %FCF Yield LTMΔ revenue (NII for banks)Δ EBITDA (assets for financials)EV/EBITDA LTMP/E LTMP/B FYROE (ann.)
PBF Energy
COMM_PBF
COOil refining+146%2.1%-4.9%11.9%6.5x13.9x1.2x14.6%
Par Pacific
COMM_PARR
COOil refining+136%13.5%4.5% ▼379.5%5.9x7.3x2.2x14.4%
Genco Shipping & Trading
COMM_GNK
COShipping+122%4.7%2.7%60.6% ▼335.1%12.0x62.5x1.2x4.2%
Matson
COMM_MATX
COShipping+87%0.7%5.3%-3.1% ▼-15.6%11.3x15.5x2.4x8.2%
Valero Energy
COMM_VLO
COOil refining+84%1.7%4.6%7.0% ▲-2.9%10.2x20.7x3.7x21.2%
Euroseas
COMM_ESEA
COShipping+81%4.3%24.4%-0.9% ▼-15.8%3.1x3.6x1.0x27.3%
Danaos Corporation
COMM_DAC
COShipping+74%1.4%11.4%0.2%3.6%3.7x4.5x0.6x14.6%
Expand Energy
COMM_EXE
CONatural gas+58%3.6%14.4%100.2% ▲406.1%3.3x6.6x1.1x24.3%
Phillips 66
COMM_PSX
COOil refining+55%2.6%-2.2%6.9% ▼3.1%22.9x18.5x2.6x2.9%
Newmont Corporation
COMM_NEM
COGold+40%1.1%11.0%45.8% ▼70.2%6.2x12.2x3.0x37.9%
EQT Corporation
COMM_EQT
CONatural gas+32%1.3%9.2%94.2% ▲140.9%4.9x9.4x1.3x24.3%
Sunoco LP
COMM_SUN
COOil refining+14%5.5%6.8%106.4% ▲154.9%10.4x9.8x1.2x31.5%
Marathon Petroleum
COMM_MPC
COOil refining+12%1.4%0.6%8.5%49.5%9.7x18.7x5.0x12.0%
Intrepid Potash
COMM_IPI
COFertilizers+10%11.5%4.4% ▲19.3%6.6x32.2x0.9x6.0%
Alamos Gold
COMM_AGI
COGold+9%0.3%3.8%79.2%166.3%7.8x11.9x2.8x16.9%
Comstock Resources
COMM_CRK
CONatural gas+3%-11.4%14.5% ▲7.6%5.3x6.4x1.5x15.9%
Amplify Energy
COMM_AMPY
COCrude oil-1%-33.2%-48.0%1.6x5.0x0.4x-34.7%
CF Industries
COMM_CF
COFertilizers-5%1.8%9.1%19.4% ▲61.4%5.6x8.7x3.8x53.1%
Cresco Labs
COMM_CRLBF
COCannabis-5%-57.8%-8.7% ▼-10.6%4.4x0.8x-15.5%
Texas Pacific Land Corporation
COMM_TPL
COCrude oil-6%0.4%-0.3%20.8%21.2%38.8x53.5x18.5x37.9%
Innovative Industrial Properties
COMM_IIPR
COCannabis-7%12.1%22.6%-3.8% ▼-1.6%8.9x14.7x1.0x7.0%
PrimeEnergy Resources
COMM_PNRG
COCrude oil-13%12.7%-21.3%-30.9%2.8x13.6x1.4x8.0%
Range Resources
COMM_RRC
CONatural gas-15%1.0%7.5%49.8%160.5%6.3x9.7x2.0x30.6%
UFP Industries
COMM_UFPI
COLumber-15%1.3%4.7%-8.4%-20.2%9.0x18.3x1.6x6.6%
APA Corporation
COMM_APA
COCrude oil-15%3.0%12.9%-14.2% ▼6.6%2.9x7.8x2.0x28.4%
Trulieve Cannabis
COMM_TCNNF
COCannabis-16%11.7%-3.7% ▼4.5%6.6x1.5x0.8%
SSR Mining
COMM_SSRM
COGold-19%9.8%83.7% ▲140.6%6.9x25.7x1.9x-11.9%
Occidental Petroleum
COMM_OXY
COCrude oil-20%1.9%19.2%-8.3%-26.7%6.6x10.8x1.4x35.8%
Teck Resources
COMM_TECK
COCopper-20%0.5%10.0%80.0% ▼175.0%7.6x26.3x1.6x12.9%
Industrias Peñoles
COMM_IPOAF
COGold-23%0.9%11.4%91.6%153.8%4.1x9.5x4.2x44.0%
Suzano
COMM_SUZ
COPulp-24%0.0%5.3%6.3% ▲8.5%3.9x2.3x1.2x39.0%
Kinross Gold
COMM_KGC
COGold-26%0.5%9.4%60.8% ▲89.3%5.4x9.9x3.4x38.2%
Southern Copper
COMM_SCCO
COCopper-26%2.1%2.8%36.2%53.8%16.9x29.5x13.3x55.4%
Fortuna Mining
COMM_FSM
COSilver-27%14.6%75.6%126.9%2.9x7.7x1.9x25.7%
Coeur Mining
COMM_CDE
COGold-27%0.1%7.6%137.8% ▲326.6%7.3x12.9x3.1x14.4%
Core Natural Resources
COMM_CNR
COCoal-29%0.5%5.8%6.6% ▲164.6%7.5x1.1x2.3%
Tronox Holdings
COMM_TROX
COTitanium dioxide-30%3.3%-33.6%3.0%240.0%37.4x0.8x-30.4%
Royal Gold
COMM_RGLD
COGold-30%0.9%-2.7%142.5% ▲148.5%16.4x26.5x2.3x15.4%
Energy Transfer LP
COMM_ET
CONatural gas-31%6.8%8.1%32.1%18.4%9.0x15.6x1.4x10.2%
Hecla Mining Company
COMM_HL
COSilver-34%0.1%6.4%100.4% ▲230.2%11.9x38.7x4.1x-2.9%
ONEOK
COMM_OKE
CONGL-35%4.7%1.9%19.6% ▲12.9%12.0x16.0x2.5x13.8%
Freeport-McMoRan
COMM_FCX
COCopper-35%1.0%-0.7%8.8% ▼49.9%9.7x18.3x4.6x28.9%
Weyerhaeuser
COMM_WY
COLumber-36%2.8%2.9%-2.0% ▲22.0%16.1x41.0x1.7x6.6%
Murphy Oil
COMM_MUR
COCrude oil-36%4.0%3.8%10.2%16.1%5.0x57.0x0.9x4.1%
Equinor
COMM_EQNR
COCrude oil-38%4.4%8.7%-5.3% ▲1.5%3.0x16.0x2.2x29.6%
Green Thumb Industries
COMM_GTBIF
COCannabis-38%5.9%7.4% ▼1.7%6.6x13.6x0.9x3.2%
Alcoa Corporation
COMM_AA
COAluminium-39%0.8%2.3%-5.2%-19.0%11.6x12.3x1.9x26.3%
Canadian Natural Resources
COMM_CNQ
COCrude oil-39%2.1%6.3%-15.9%-23.7%8.4x12.6x2.7x12.1%
Warrior Met Coal
COMM_HCC
COCoal-42%0.4%-7.2%52.9% ▼371.9%12.4x30.2x1.9x13.3%
Sociedad Quimica y Minera de Chile
COMM_SQM
COLithium-42%1.4%3.7%69.8% ▼105.9%12.9x26.0x4.1x25.3%
Alpha Metallurgical Resources
COMM_AMR
COCoal-43%55.7%-1.3% ▼689.7%11.2x1.2x-2.9%
Baker Hughes
COMM_BKR
COCrude oil-43%1.6%3.9%2.5%92.4%11.9x22.5x2.9x19.5%
Antero Resources
COMM_AR
CONatural gas-47%-7.6%43.8% ▲104.4%7.3x10.6x1.4x28.1%
Rio Tinto
COMM_RIO
COIron ore-48%4.5%-8.7%7.4% ▲3.8%7.5x14.3x2.4x17.0%
SandRidge Energy
COMM_SD
CONatural gas-49%5.1%0.8%16.8% ▲31.9%3.7x6.5x1.0x14.4%
Caledonia Mining
COMM_CMCL
COGold-50%0.7%25.5%18.3% ▲2.6%2.4x5.9x1.7x23.9%
EOG Resources
COMM_EOG
COCrude oil-50%3.0%-2.1%22.1%32.0%6.5x13.1x2.4x26.1%
Wheaton Precious Metals
COMM_WPM
COGold-52%0.4%2.7%91.8% ▲104.5%24.4x27.9x5.8x26.0%
Franco-Nevada Corporation
COMM_FNV
COGold-54%0.4%-0.3%76.6% ▼82.9%20.5x36.1x5.3x23.8%
Eldorado Gold
COMM_EGO
COGold-54%0.2%-6.6%50.0% ▲71.8%6.2x11.1x1.5x12.7%
Vermilion Energy
COMM_VET
COCrude oil-56%2.1%35.3%8.9% ▼-62.1%4.4x1.0x-27.5%
Peabody Energy
COMM_BTU
COCoal-59%1.3%-6.9%3.9% ▲-47.3%11.3x0.8x-3.7%
Silvercorp Metals
COMM_SVM
COSilver-60%2.4%96.2% ▲248.5%6.9x36.4x3.0x-0.3%
First Majestic Silver
COMM_AG
COSilver-63%0.1%6.6%95.5% ▲190.5%8.8x23.4x3.0x20.9%
National Oilwell Varco
COMM_NOV
COCrude oil-65%1.8%10.7%-2.4% ▼-42.3%10.2x73.1x1.1x1.2%
The Andersons
COMM_ANDE
COAgriculture-65%1.1%-22.5%-1.2%81.1%14.9x22.5x1.9x10.6%
Kimbell Royalty Partners
COMM_KRP
CONatural gas-66%10.2%-21.5%-22.2%-30.3%7.5x17.1x2.2x4.7%
Matador Resources
COMM_MTDR
COCrude oil-66%2.8%3.6%-33.8% ▼-49.4%4.7x13.2x1.1x-2.6%
GeoPark
COMM_GPRK
COCrude oil-67%0.5%-14.5%-6.3% ▼4.6%3.6x8.9x2.1x30.0%
Devon Energy
COMM_DVN
COCrude oil-67%2.5%7.7%-14.5% ▲-31.3%5.2x11.5x1.7x3.1%
Black Stone Minerals
COMM_BSM
COCrude oil-68%8.7%7.9%0.2% ▲0.5%9.0x9.8x3.5x6.6%
Magnolia Oil & Gas
COMM_MGY
COCrude oil-68%2.4%1.3%2.3% ▼-0.2%5.8x14.9x2.4x19.8%
Petrobras
COMM_PBR
COOil refining-70%2.2%7.8%12.5% ▲13.6%4.5x7.0x2.9x31.6%
Exxon Mobil
COMM_XOM
COCrude oil-71%3.0%3.2%2.4% ▼-20.6%9.6x22.7x2.2x6.5%
Chevron
COMM_CVX
COCrude oil-72%4.0%2.3%2.1% ▼0.5%9.1x29.3x1.7x4.8%
ConocoPhillips
COMM_COP
COCrude oil-72%3.1%6.4%-4.6% ▲-13.1%6.6x18.5x2.1x13.5%
Nucor Corporation
COMM_NUE
COSteel-77%1.0%-1.0%21.3% ▲126.6%11.8x24.1x2.4x14.0%
Albemarle Corporation
COMM_ALB
COLithium-78%1.3%9.5%32.7% ▲115.6%32.2x1.6x13.2%
Curaleaf Holdings
COMM_CURLF
COCannabis-78%-0.8%5.7% ▼-14.4%12.1x2.9x35.4%
Alliance Resource Partners
COMM_ARLP
COCoal-80%9.8%9.5%-4.5% ▼-36.0%5.8x12.7x1.7x2.0%
Vale
COMM_VALE
COIron ore-80%7.1%4.9%15.0% ▲27.8%4.9x12.3x1.5x22.1%
Steel Dynamics
COMM_STLD
COSteel-82%0.9%1.3%19.1% ▲70.5%15.7x23.9x3.7x17.8%
Dorchester Minerals
COMM_DMLP
COCrude oil-83%9.6%-1.0%36.4% ▼10.2x18.3x4.1x38.7%
Valvoline
COMM_VVV
COOil refining-84%-12.5%25.0% ▼34.8%16.5x51.6x14.3x54.2%
Diamondback Energy
COMM_FANG
COCrude oil-90%2.3%0.8%4.7% ▲-49.1%13.3x182.4x1.4x0.3%
Hallador Energy
COMM_HNRG
COCoal-92%7.2%-13.5% ▲-82.8%8.8x32.1x4.5x-20.4%
Ovintiv
COMM_OVV
COCrude oil-92%2.2%-11.5%6.5% ▲-142.3%8.2x18.1x1.2x-22.2%
NACCO Industries
COMM_NC
COCoal-93%1.6%-9.8%-4.3% ▲14.1%8.3x16.4x0.8x8.2%
Gerdau
COMM_GGB
COSteel-96%1.7%-3.3%7.8% ▲35.6%4.4x14.1x0.9x7.9%
Endeavour Silver
COMM_EXK
COSilver-99%-0.8%230.2% ▲666.4%12.3x5.0x42.4%
Ramaco Resources
COMM_METC
COCoal-99%-45.0%-9.7% ▼-239.3%1.3x-15.9%
Archer-Daniels-Midland
COMM_ADM
COAgriculture2.6%6.6%1.6%5.8%19.4x35.1x1.7x5.2%
Almaden Minerals
COMM_AAU
COGold mining21.2%34.2x4.6x-6.5%
Battalion Oil
COMM_BATL
COOil & gas-122.3%-17.5%-37.9%2.5x0.2x-27.1%
Bunge Global
COMM_BG
COAgriculture2.5%-44.6%87.8% ▲-26.0%19.3x32.2x1.3x1.7%
Barrick Mining Corporation
COMM_B
COGold2.5%8.6%66.7% ▲111.3%4.6x7.5x2.3x23.8%
B2Gold
COMM_BTG
COGold1.0%5.6%117.7%222.0%2.3x9.5x1.7x22.0%
Barnwell Industries
COMM_BRN
COOil & gas-4.7%-29.0% ▼-151.9%1.5x-56.5%
CrossAmerica Partners
COMM_CAPL
COCrude oil9.3%17.9%-2.4% ▼44.2%8.5x14.4x-40.3%
Cleveland-Cliffs
COMM_CLF
COSteel-3.2%6.3% ▲-283.0%0.9x-15.9%
BRF S.A.
COMM_BRFS
COProtein46.0%10.7% ▲-3.8%2.0x3.3x1.0x14.8%
Daqo New Energy
COMM_DQ
COPolysilicon-9.1%-78.5% ▲0.2x0.2x-8.0%
Epsilon Energy
COMM_EPSN
CONatural gas4.7%5.7%58.4% ▲29.7%3.6x1.0x2.3%
Ero Copper
COMM_ERO
COCopper2.7%110.4% ▲113.6%9.1x8.8x2.8x42.8%
Lithium Americas
COMM_LAC
COLithium-100.3%-209.7%1.8x-0.1%
Martin Midstream Partners
COMM_MMLP
COChemistry0.9%-6.6%-2.5% ▲-23.2%6.6x30.3%
The Mosaic Company
COMM_MOS
COFertilizers4.2%-9.4%14.4% ▲-109.7%9.7x146.4x0.5x-8.6%
Mexco Energy
COMM_MXC
COOil & gas1.2%2.3%-10.8% ▼15.7%3.6x13.5x0.9x0.3%
REX American Resources
COMM_REX
COOil refining-4.4%-1.2% ▼94.2%14.9x16.6x2.8x11.9%
Sibanye-Stillwater
COMM_SBSW
COPGM3.8%-10.5%18.5% ▲65.2%10.6x2.7x-12.9%
CSN
COMM_SID
COSteel-125.4%8.9% ▲-14.0%3.6x0.4x-14.6%
SM Energy
COMM_SM
COCrude oil3.7%10.0%75.0% ▲-75.5%6.0x24.9x0.8x-22.9%
Talos Energy
COMM_TALO
COCrude oil14.3%-7.9% ▼-65.8%11.9x1.1x-50.7%
US Energy
COMM_USEG
COOil & gas-41.0%-26.9% ▼1.4x-40.7%
Tyson Foods
COMM_TSN
COProtein2.6%2.1%4.4%73.7%11.3x57.9x1.1x5.8%
W&T Offshore
COMM_WTI
COCrude oil1.2%5.9%15.5% ▼70.0%9.0x42.8%

Work in progress — needs attention

Issuers below have weak extraction, thin market data, missing valuation inputs, or extreme headline YoY/ROE. Hover the row for the checklist.

CompanyCountrySectorUpsideDiv. %FCF Yield LTMΔ revenue (NII for banks)Δ EBITDA (assets for financials)EV/EBITDA LTMP/E LTMP/B FYROE (ann.)
Delek US
COMM_DK
COOil refining+152%1.8%-0.0%0.4% ▲9.3x6.2x-189.6%
ZIM Integrated Shipping
COMM_ZIM
COShipping+131%3.6%74.5%-18.1% ▼-37.3%3.3x6.0x0.7x12.0%
CNX Resources
COMM_CNX
CONatural gas+105%15.8%276.9%3.4x3.9x1.1x31.1%
Gulfport Energy
COMM_GPOR
CONatural gas+86%8.4%122.1% ▲290.3%3.3x5.0x1.6x36.4%
CVR Energy
COMM_CVI
COOil refining+20%0.3%-1.6%20.3% ▲64.3%7.6x116.4x4.3x-121.1%
BHP Group
COMM_BHP
COIron ore-10%1.8%9.2%-7.9% ▼9.5%8.6x18.2x4.3x24.1%
Riley Exploration Permian
COMM_REPX
COCrude oil-27%4.8%-6.8%11.2% ▼1.1%4.2x11.7x1.1x-47.4%
Evolution Petroleum
COMM_EPM
COCrude oil-29%13.1%9.8%-10.6% ▲-28.2%4.9x83.0x1.7x-56.7%
Targa Resources
COMM_TRGP
CONGL-41%1.6%-3.9%-10.2%39.7%14.8x27.5x19.1x61.8%
California Resources
COMM_CRC
COCrude oil-51%3.0%1.1%6.7%-3.6%5.3x12.6x1.2x-86.3%
Osisko Gold Royalties
COMM_OR
COGold-52%0.4%2.7%87.3% ▲96.0%19.9x22.2x4.5x20.3%
Hudbay Minerals
COMM_HBM
COCopper-54%0.1%2.8%9.4% ▼63.9%6.3x15.1x2.6x19.5%
Northern Oil and Gas
COMM_NOG
COCrude oil-55%9.6%-13.2%-6.2% ▲-15.4%4.4x47.2x0.9x-107.0%
Cheniere Energy
COMM_LNG
CONatural gas-62%0.8%0.7%7.8% ▲-344.7%13.7x39.0x7.3x
Agnico Eagle Mines
COMM_AEM
COGold-76%0.8%5.9%43.7% ▲89.1%8.6x16.8x3.0x19.6%
Cameco
COMM_CCJ
COUranium-82%0.2%1.4%9.0% ▼-5.3%61.8x89.3x9.0x7.6%
Pan American Silver
COMM_PAAS
COSilver-82%0.8%6.1%28.4% ▲57.0%9.5x17.2x2.4x16.8%
Gold Resource Corporation
COMM_GORO
COGold-82%-4.8%255.7% ▲5.6x27.3x4.1x40.8%
PEDEVCO
COMM_PED
COCrude oil-84%9.9%360.4% ▼447.9%1.9x0.3x-52.6%
AngloGold Ashanti
COMM_AU
COGold-95%5.6%8.7%70.8% ▲126.8%7.3x13.1x5.1x43.1%
Nutrien
COMM_NTR
COFertilizers-98%1.7%6.8%3.5% ▲45.5%6.9x13.7x1.2x9.2%
Anglo American PLC
COMM_AAL
COCopper0.5%4.0%10.8%119.2%22.5x268.4x39.2%
Aemetis
COMM_AMTX
COCrude oil27.4% ▼27.7%
American Resources
COMM_AREC
COCoal2.1%-100.0% ▼3.5x2.1x9.7%
Calumet
COMM_CLMT
COOil refining7.6%3.6% ▲-62.1%33.9x142.8%
VAALCO Energy
COMM_EGY
COCrude oil4.8%-20.0%-43.3% ▼-96.3%21.2x1.2x-95.1%
Gold Fields
COMM_GFI
COGold4.2%1.4%15.6% ▲30.1%11.4x23.6x5.9x26.7%
Gran Tierra Energy
COMM_GTE
COCrude oil82.2%2.3%-234.4%1.0x-64.9%
Kosmos Energy
COMM_KOS
COCrude oil-17.1%27.8%-515.9%2.0x-172.9%
Houston American Energy
COMM_HUSA
COOil & gas-42.9%29.9%1.1x-77.0%
Mercer International
COMM_MERC
COTimber & wood-3.5% ▼-83.3%0.6x
NGL Energy Partners
COMM_NGL
COCrude oil7.2%-9.0% ▲-39.1%14.7x160.7%
Ring Energy
COMM_REI
COCrude oil-19.2%-6.9% ▼-367.8%0.3x-121.0%
Taseko Mines
COMM_TGB
COCopper3.5%73.4% ▼252.7%14.5x226.0x6.9x8.5%

Earnings analysis

Short take-aways from recent corporate results and commodity trends.

Commodity Results: Precious Metals & Mining Lead, Oil & Gas Lag

The latest commodity corporate results reveal a stark divergence in revenue growth. Precious and base-metals mining topped the industry rankings with a median revenue increase of 91.6% year over year, followed closely by precious-metals royalty companies at 89.5% and silver miners at 85.5%. At the other end, oil and gas companies posted a median decline of 5.4%, while polysilicon and coking coal saw the steepest drops of 78.5% and 100.0%, respectively.

Revenue growth by industry (median YoY)

Precious & base-metals mining92Precious-metals royalty90Silver mining86Gold mining71Lithium51Natural gas50Copper mining36Oil26Oil & gas-5.4Natural Gas-11Polysilicon-78Coking coal-1000−100100
median revenue YoY, %

Growth Leaders and Laggards

Among individual players, gold and silver miners dominated the growth leaderboard. Coeur Mining posted a revenue surge of 137.8% year over year, with EBITDA soaring 326.6% and net profit turning positive. Endeavour Silver saw revenue jump 230.2%, while EBITDA and net profit also swung sharply higher. In the precious-metals royalty space, Royal Gold delivered revenue growth of 142.5%, with EBITDA and net profit each rising over 147%. At the other extreme, Daqo New Energy (polysilicon) saw revenue collapse 78.5%, and American Resources (coking coal) reported a 100.0% revenue decline.

Accelerators and Decelerators

Several companies showed notable shifts in momentum. Bunge Global accelerated sharply, with revenue growth jumping from a prior-period decline of 10.8% to a current increase of 87.8%. Similarly, Sunoco LP reversed from a prior-period revenue decline of 1.6% to a surge of 106.4%. In contrast, Amplify Energy slowed dramatically, with revenue growth dropping from a prior-period increase of 5.3% to a decline of 48.0%. Canadian Natural Resources also decelerated, with revenue growth falling from a prior-period increase of 4.5% to a decline of 15.9%.

Long-term growth standouts include Pan American Silver, which posted a 3-year revenue CAGR of 34.3%, and Alamos Gold with a 30.1% CAGR. Among dividend leaders, Dorchester Minerals offered a yield of 8.1%, while Energy Transfer LP yielded 7.9% and Texas Pacific Land Corporation yielded 5.2%.

Players: growth & yield (no absolute levels)

CompanyIndustryRevenue YoYEBITDA YoYNet profit YoY
Exxon Mobil (Q1)Oil & gas+2.4%-20.6%-45.8%
Rio Tinto (FY)Diversified mining+7.4%+3.8%-11.3%
BHP Group (FY)Diversified mining-7.9%+9.5%+16.1%
Chevron (Q1)Oil & gas+2.1%+0.5%-36.9%
MU (Q3)
Marathon Petroleum (Q1)Oil refining+8.5%+49.5%n/m
Phillips 66 (Q1)Oil refining+6.9%-57.5%
Valero Energy (Q1)Oil refining+7.0%n/m+312.3%
Equinor (Q1)Natural gas-5.3%+10.2%+18.2%
Energy Transfer LP (Q1)Oil+32.1%+18.4%-5.2%
Nutrien (FY)Fertilizers+3.5%+45.5%+228.1%
Petrobras (Q1)Oil+12.5%+13.6%+3.9%
Bunge Global (Q1)Agribusiness+87.8%-26.0%-66.2%
Archer-Daniels-Midland (Q1)Agribusiness+1.6%+5.8%+1.0%

US refiners at peak margins: a deep dive on PBF Energy

PBF →

Research note, data as of 24-25 June 2026. Not individual investment advice. US refining is running at abnormally high margins, and unlike past spikes this one is largely structural. We cover how much refiners earn now, how long it lasts, how much free cash flow PBF can generate, and a backtest of buying cheap on crack-adjusted EV/EBITDA. The lead name is PBF Energy (PBF) — the most concentrated way to play the theme.

The crack spread is ~$46/bbl now — double the norm, but not at its peak

The 3-2-1 crack spread — the notional margin of turning three barrels of crude into two of gasoline and one of diesel — sits around $46/bbl, versus a historical norm of ~$10-12. The headline USGC 3-2-1 averaged ~$42 in April 2026 (+95% YoY) and spiked above $52 in spring on Hormuz tension. In 2024-2025 the crack sagged to ~$20-24, which is why refiner profits collapsed.

Crack spread: where we are in the cycle

Historical norm11Now (Jun 2026)462022 peak64064
$/bbl (3-2-1)

The high crack has lasted only ~4 months of a typical 3-9

The acute phase of the rally began in late February 2026 (Iran/Hormuz), so the high crack has lasted only about 4 months. Historically, elevated margins after a geopolitical shock persist 3-9 months — so the cycle is only partly through, and permanent capacity closures can extend it. Key nuance: PBF has barely monetized this crack yet, because its best plant (Martinez) was down — the bulk of the earnings is still ahead.

Strikes on Russian refineries and Hormuz add fuel — but it's reversible

Ukrainian strikes have knocked an estimated 20%+ of Russia's refining capacity offline; Russia began importing gasoline by sea and curbed product exports, and as a major diesel exporter its lost flows push global cracks up. The Hormuz/Iran conflict added a risk premium and Middle East outages. Both factors are reversible — cracks have eased before when Russian supply recovered — which argues the moment is cyclical, not a permanent new normal.

~900 kb/d shut for good — that lengthens the cycle

Since 2023 the US has permanently retired about 900 kb/d of refining capacity. Shut plants don't come back, which structurally tightens supply regardless of demand. Base case: elevated margins persist another 12-18 months, compressing 20-30% from peaks; bull case 24+ months; bear case a return to 2023 levels within 6-12 months.

US capacity permanently closed since 2023

LyondellBasell Houston264Valero Benicia145Phillips 66 Los Angeles1390264
kb/d

PBF is a pure-play refiner: maximum sensitivity to the crack

PBF is a pure-play refiner — no midstream, no chemicals to smooth the cycle. Six plants, ~1.0 million b/d, weighted Nelson complexity 12.7. That makes it the most crack-geared large name — amplitude in both directions.

PBF refineries

RegionPlantsThroughput (kb/d)
East Coast / ВостокDelaware City + Paulsboro280-300
Mid-continentToledo135-145
Gulf Coast / ЗаливChalmette175-185
West Coast / ЗападMartinez + Torrance250-270
Total / Итого6 plants / 6 заводов850-910

PBF's profit swings wildly: $4.3bn at the peak, ~zero at the trough

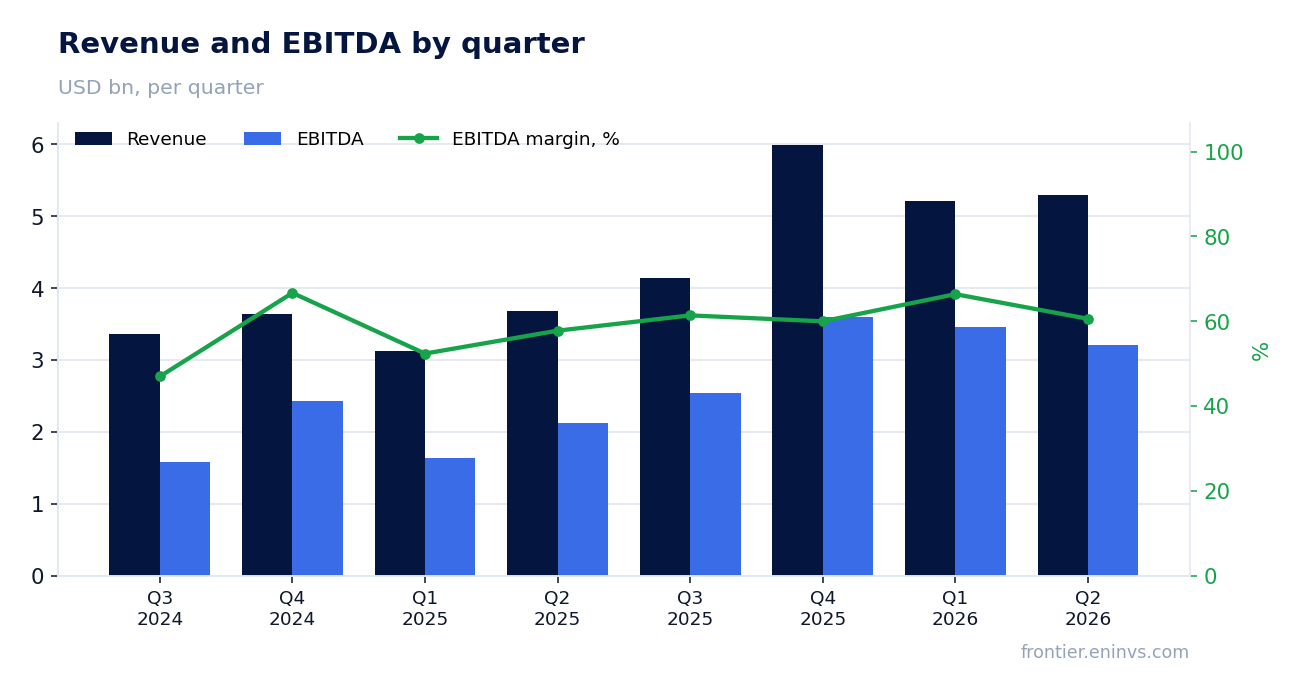
A pure-play cuts both ways: adjusted EBITDA was $4.3bn in 2022, collapsed to $0.09bn in 2024 — a 48x swing in two years — and was near zero in 2025 (Martinez outage). At full utilization and current spreads the potential is $2.5-3.5bn a year.

PBF adjusted EBITDA by year

20224.320233.520240.12025 (est)0.2Potential3.004.3
$bn

PBF's margin tracks the crack — depressed now by Martinez downtime

PBF's realized refining margin moved from +$11.7/bbl (Q1'24) to -$3.9 (Q4'24) to +$11.2 (Q4'25), then dipped to +$6.0 in Q1'26 — low despite a high crack because Martinez was down. As Martinez returns to full load in Q2 2026, the margin should re-converge toward the crack environment.

PBF realized refining margin by quarter

Q1'2412Q3'246.8Q4'24-3.9Q1'256.0Q3'259.0Q4'2511Q1'266.00−1212
$/bbl

+$1/bbl of crack ~ +7% of market cap — that's the core leverage

At ~900 kb/d PBF processes ~330 million barrels a year, so every +$1/bbl of durable margin is ~$0.33bn of pre-tax EBITDA, ~$2.8/share, ~7% of market cap. Per $1bn of market cap PBF carries ~188 kb/d of capacity vs ~41 for VLO/MPC — 4.6x more barrels per dollar (but also more debt).

Leverage to the crack: capacity per $1bn market cap

PBF188DINO56MPC41VLO41PSX290188
kb/d per $1bn

At current cracks PBF can earn ~20-40% of its market cap in FCF in a year

Assuming 2026 capex ~$0.9bn, net interest ~$0.19bn and 21% tax: mid-cycle (EBITDA ~$1.8bn) yields ~11% FCF on the $4.8bn market cap; at current high cracks with Martinez running (~$2.5bn) ~22%; at a 2022-style peak (~$3.5bn) ~39%; at the trough FCF is negative. So a sustained high crack can return a fifth to two-fifths of the market cap in free cash flow in a single year.

Estimated PBF FCF yield by state of the cycle

Trough (2024)-3.0Mid-cycle11Current high cracks222022 peak390−3939
% of market cap

Debt is manageable, and Martinez restarts into the high-spread window

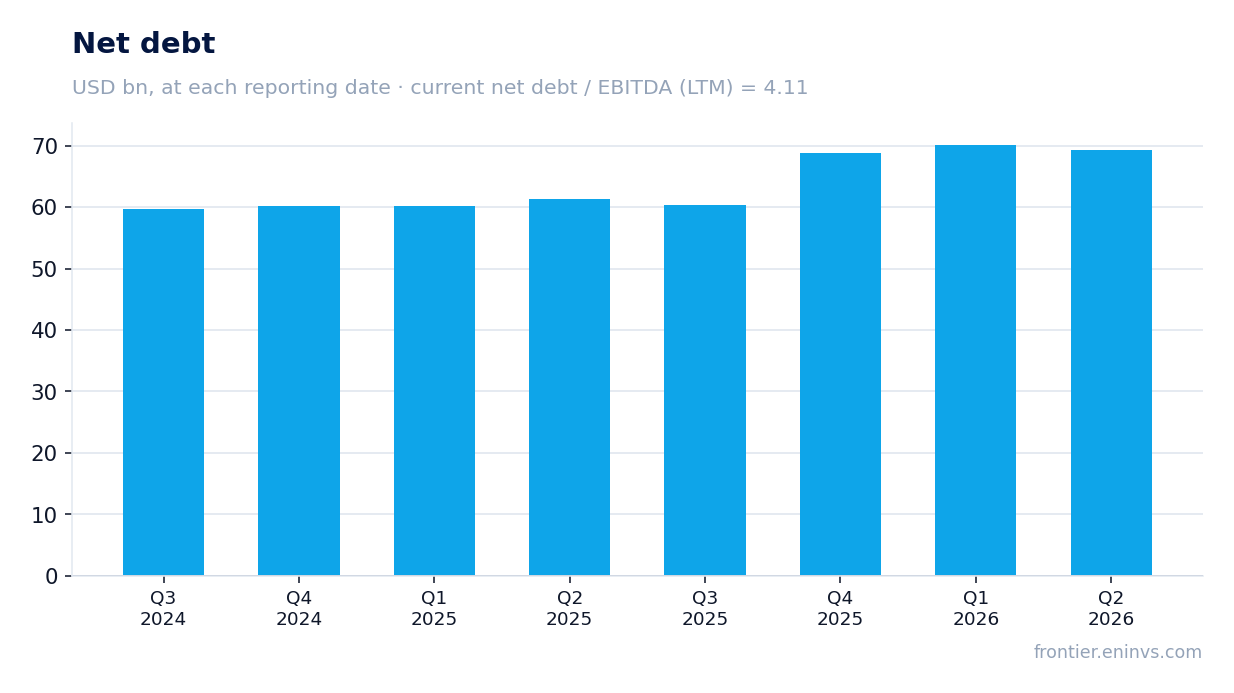
Net debt is ~$2.3bn (net debt/cap ~36%, debt/EBITDA ~1.9x), with no maturity wall — 2026 refinancing pushed the 2028 notes out to 2034. Dividend ~2.7% plus a buyback; priority is deleveraging. Martinez (fire 1 Feb 2025, ~$0.9bn insurance recoveries) completes its restart in Q2 2026 — full load returns into the high-spread window.

Backtest: cheap on EV/(crack-adjusted EBITDA) = historically a good entry

We tested buying when a refiner is cheap on EV/EBITDA computed at the current crack (not reported earnings) across VLO/PBF/MPC/PSX/DINO, 2020-2026, monthly, with point-in-time ranking. Cheap names returned +47% on average over the next 12 months (median +45%) versus just +5% for expensive ones.

12-month forward return by cheapness on crack EV/EBITDA

Cheap47Mid18Expensive5.0047
% avg forward return

Statistical weight comes from our Global Commodities strategy, whose refiner signal is built on the same crack model (crack to EBITDA to EV/EBITDA to upside): 2016-2026 it returned ~28% CAGR vs ~14% for the S&P, with a ~+11%/yr cross-sectional ranking edge over an equal-weight basket of the same names.

For cyclicals, multiples on reported earnings mislead — use anchors

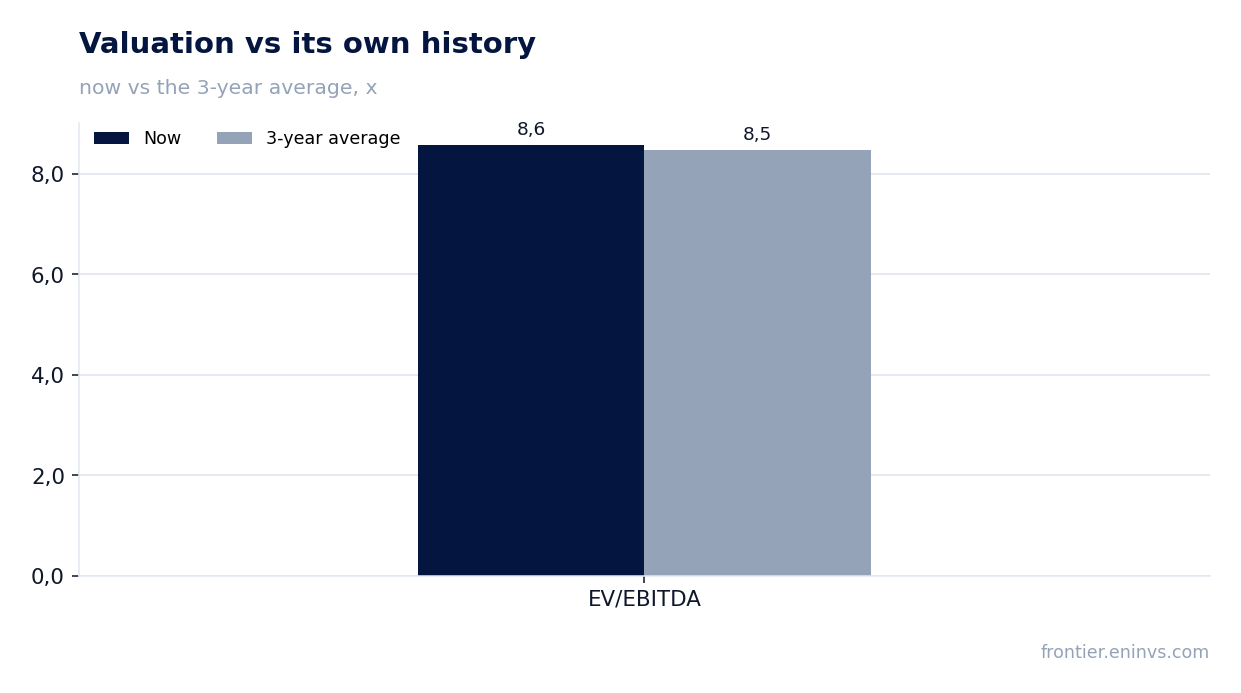
For a cyclical, any multiple on reported/peak earnings misleads (P/E and EV/EBITDA alike) — at the margin peak, earnings are huge and the multiple looks low right at the top. Better anchors: EV/EBITDA recomputed at the current crack (as in the backtest), EV/mid-cycle EBITDA, and price-to-book. PBF's P/B range is 0.25x (trough), 1.12x median, 2.55x (peak); now ~0.90x, around or below book (~$44/share). Supercycle history: 2004-2005 saw Valero +239% and HF Sinclair +265%; 2022 saw HF Sinclair +106%, Valero +58%, Marathon +53%.

PBF price / book value (P/B)

Trough min0.2Now0.9Median1.1Peak max2.502.5
x

Risk/reward skews up: base +45%, bull +112%, bear -28%

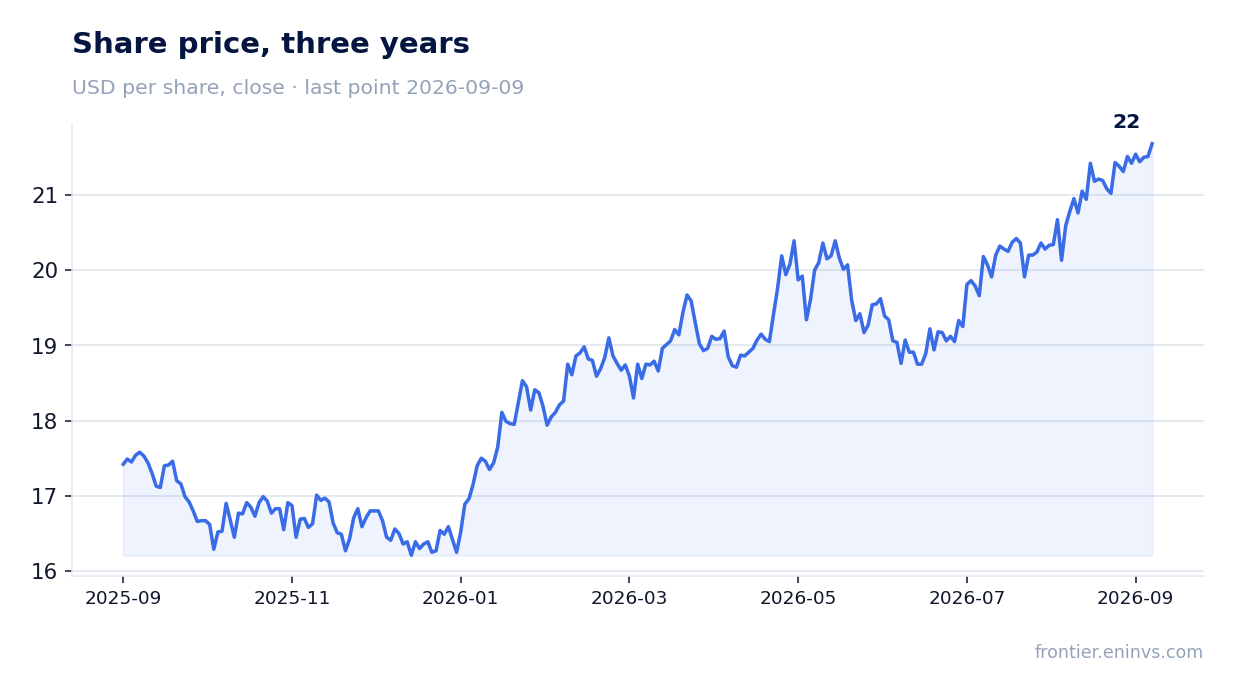
Combining FCF-driven equity build with multiple normalization toward mid-cycle, rough 12-24 month price scenarios for PBF (current ~$40): base (crack ~$30-35) ~$58 (+45%); bull (crack ~$40+, holds 24 months) ~$85 (+112%); bear (crack to $20) ~$29 (-28%). The risk/reward skews up, but this is a high-volatility cyclical bet — both upside and downside are large. Not a forecast.

PBF illustrative price scenarios

Bear29Current40Base58Bull85085
$ / share

Commodity spot-potential: who is most geared to the price rally

The spot-potential model re-prices each company's revenue at current commodity spot prices versus the LTM-realised average, and reads the implied EBITDA uplift. It is computed for 18 of the 24 commodity names.

Spot-EBITDA potential (selected)

Albemarle (Li)343Alpha Met (coal)246Peabody (coal)129Core Natural (coal)101AngloGold37Newmont35Freeport (Cu)32Barrick30Southern Copper210343
% EBITDA uplift

Operating leverage drives the ranking

The largest potentials belong not to the companies whose commodity rose most, but to those with the thinnest EBITDA margins. Albemarle, Alpha Met, Peabody and Core Natural all earn just 5-11% margins today — so a revenue increment from higher prices drops almost entirely to EBITDA and multiplies a small base. Albemarle is the extreme: lithium prices collapsed, its EBITDA is near-breakeven, and lithium spot sits ~58% above the LTM average — recovering that implies a several-fold EBITDA jump.

The dependable reads

The high-margin gold and copper majors — Newmont, Barrick, AngloGold, Freeport, Southern Copper — show a steadier +20-37%. They already earn 35-65% margins, so a price move lifts EBITDA proportionally rather than explosively. These are the robust signals; the triple-digit coal and lithium figures correctly flag enormous gearing to a price recovery, but are fragile on a near-breakeven base.