CrossAmerica Partners: revenue up 22.6% but profit fell – last year's gain came from real estate sales

On 5 August CrossAmerica Partners reported second-quarter 2026 results. Revenue rose 22.6% year on year to $1,179.0 million, adjusted EBITDA reached $51.8 million, while net income fell 17.3% to $20.8 million: last year's base included $29.7 million of one-off real estate gains. Excluding that effect the business grew: adjusted EBITDA added 40% and trailing-twelve-month distribution coverage reached 1.39x. At $21.47 the share looks rather attractive: an EV/EBITDA of 9.1x against net debt of 4.35 EBITDA and rising cash flow, with the portal's model showing only +1% to fair value.
Key takeaways
— Revenue rose 22.6% year on year but the entire gain came from fuel prices, not volumes
— Adjusted EBITDA added 40% on margin per gallon, not on sales
— Net income fell 17.3% as one-off real estate gains disappeared from the base
— Leverage of 4.35 EBITDA is a level the business services but does not reduce
— The $0.5250 per unit distribution is covered 1.68x by cash flow
— A 9.1x EV/EBITDA and 16.1x P/E leave no cushion to fair value
Attractiveness
Key figures, USD bn
| Metric | Q2 2025 | Q2 2026 | Change |
|---|---|---|---|
| Revenue | 0.96 | 1.18 | +22.6% |
| EBITDA | 0.06 | 0.05 | -19.4% |
| Operating profit | 0.04 | 0.04 | -15.0% |
| Net profit | 0.03 | 0.02 | -17.3% |
| Operating cash flow | 0.02 | 0.03 | +46.6% |
| Capex | 0.01 | 0.01 | -37.5% |
| EBITDA margin | 6.7% | 4.4% | -2.3 pp |
| Net margin | 2.6% | 1.8% | -0.8 pp |
Revenue rose 22.6% year on year but the entire gain came from fuel prices, not volumes
Second-quarter 2026 revenue reached $1,179.0 million, up 22.6% year on year. This is the first quarterly growth after four quarters of decline: in Q1 2026 revenue fell 2.4%, in Q4 2025 – 8.3%, in Q3 – 9.9%. The turnaround did not come from volumes: the retail network sold 124.0 million gallons against 141.7 million a year earlier, down 12%, while wholesale deliveries fell 11% to 160.3 million gallons.
The driver was price: retail margin per gallon rose to $0.492 from $0.370, wholesale – to $0.111 from $0.085. The company attributes this to differences in crude oil price movements between the two periods and overall market volatility. Revenue grew because fuel was more expensive, not because the company sold more – volumes continue to fall amid portfolio optimisation: the average number of retail sites dropped to 560 from 603.
For an investor this means revenue growth is not sustainable: it rests on external conditions, not on business expansion. Falling volumes are a consequence of asset sales, which the company pursues deliberately but which shrink the base for future sales. The next report will show whether the high margin persists once oil prices stabilise.
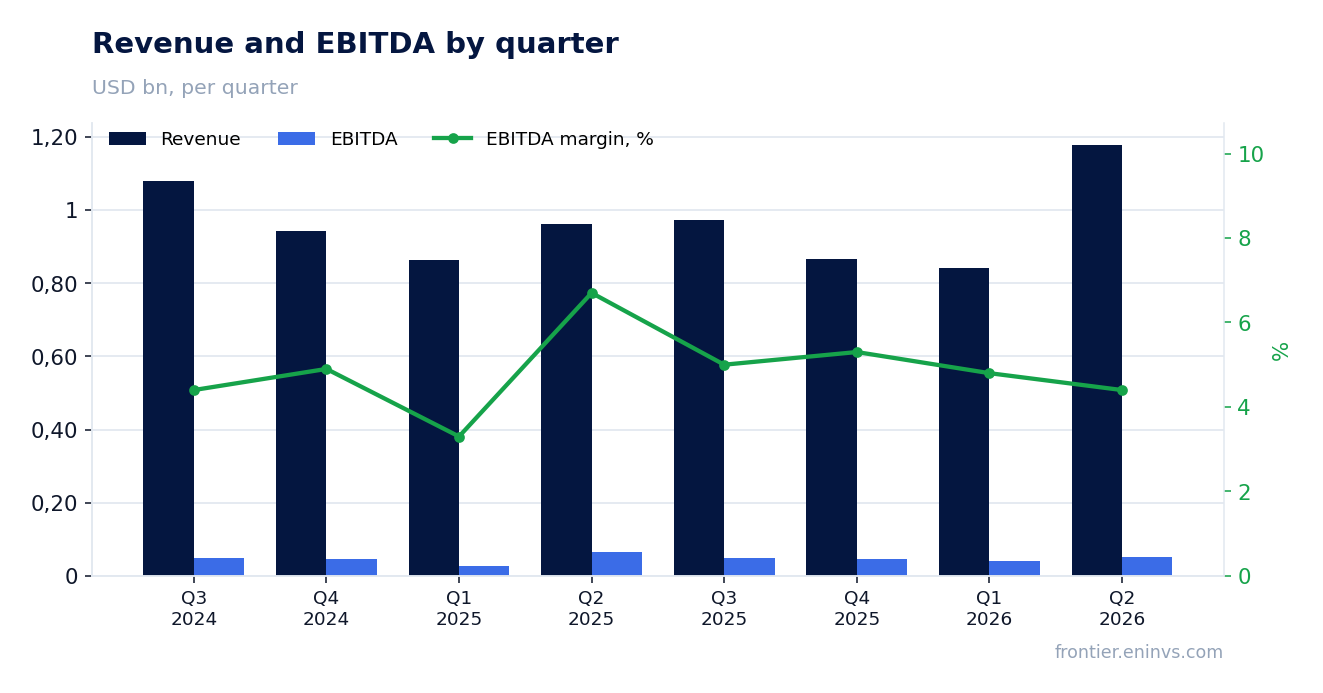
Adjusted EBITDA added 40% on margin per gallon, not on sales
Adjusted EBITDA in Q2 2026 reached $51.8 million against $37.1 million a year earlier, up 40%. This is a sharp reversal after a weak first quarter, when the figure was $40.8 million. Improvement came in both segments: retail gross profit rose to $85.7 million from $76.1 million, wholesale – to $27.1 million from $24.9 million.
The main source is margin per gallon. In retail it rose to $0.492 from $0.370, in wholesale – to $0.111 from $0.085. This added $7.7 million of extra profit in retail fuel and $2.6 million in wholesale. Merchandise margin also helped: its percentage rose to 29.5% from 28.2%, despite a 9% reduction in store count.
At the same time the company cut costs: retail operating expenses fell $2.1 million to $48.7 million, wholesale – $0.8 million to $6.3 million. This kept the EBITDA margin at 4.4%, though a year earlier it was 6.7% – but that base included one-off real estate gains that do not repeat. Excluding them, the current margin looks sustainable.
The 40% EBITDA growth is the strongest signal in the report. It shows the business can earn more even with falling volumes if margin per gallon stays high. The question is how sustainable that margin is: the company itself attributes it to market volatility rather than structural change.
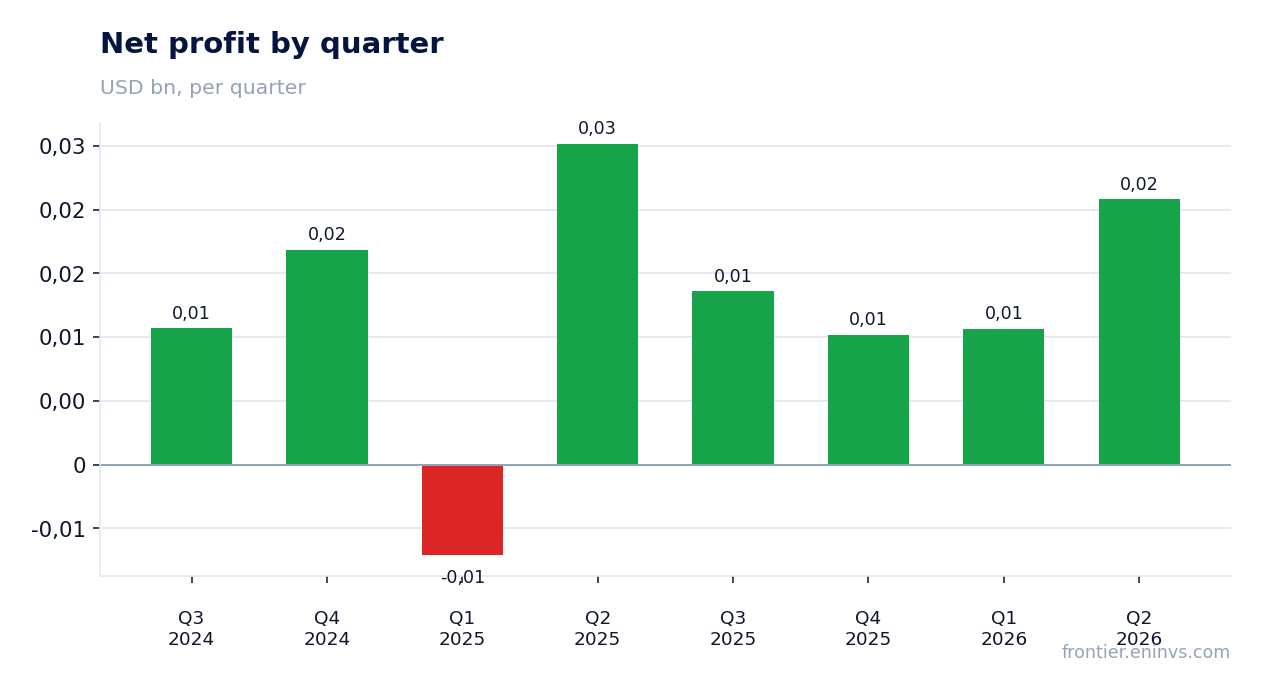
Net income fell 17.3% as one-off real estate gains disappeared from the base
Net income in Q2 2026 was $20.8 million, down 17.3% from $25.2 million a year earlier. The decline is explained not by deteriorating operations but by the comparison base: in Q2 2025 the company booked $29.7 million of net gains from real estate sales, while in the reporting quarter – only $1.1 million.
Excluding that one-off, profit would have grown: operating income rose to $35.3 million from $41.5 million, but if gains from sales are excluded, operating income from core operations increased. Adjusted EBITDA, which excludes these gains, showed 40% growth. The business earns better, but accounting profit does not show it because of the comparison with an exceptionally strong quarter a year ago.
For an investor this means the fall in net income is not a signal of deterioration. More important is that the company continues to sell real estate: five sites were sold in the quarter for $2.7 million, yielding $1.1 million of gain. These deals support cash flow but do not repeat every quarter. The next report will show how dependent profit is on such one-off receipts.
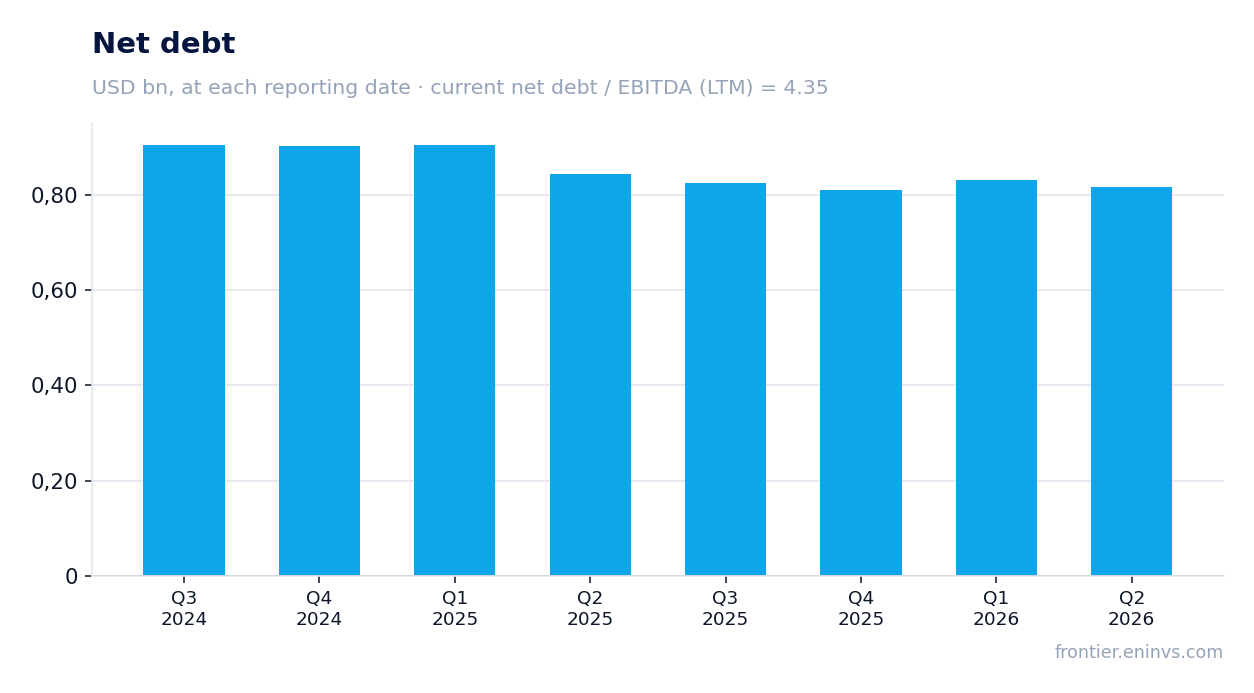
Leverage of 4.35 EBITDA is a level the business services but does not reduce
Net debt at the end of Q2 2026 was $810.0 million, almost unchanged over the year: a year earlier it was $842.3 million. The ratio of net debt to trailing-twelve-month EBITDA is 4.35x. This is a level the company services: interest expense for the quarter fell to $11.3 million from $12.6 million thanks to a lower average rate and lower average debt.
The company reports covenant leverage under its credit facility of 3.57x as of 30 June 2026 against 3.65x a year earlier. This is lower than the net debt to EBITDA ratio because the covenant is calculated on a different basis. Importantly, the company is in compliance with covenants and has $244 million available for future borrowings after covenant restrictions.
Operating cash flow over the last twelve months was $91.5 million, covering interest expense but not allowing rapid debt reduction. The company refinanced its credit facility in July 2026, extending maturity to 2031 and removing the SOFR spread adjustment. This reduces refinancing risk but does not reduce the debt itself.
For an investor, 4.35x is not critical but not comfortable either. It means the company cannot quickly increase distributions without EBITDA growth or asset sales. Debt reduction is possible only through further real estate sales or profit growth.
The $0.5250 per unit distribution is covered 1.68x by cash flow
The board declared a quarterly distribution of $0.5250 per unit for Q2 2026. Payment is due on 13 August 2026. Over the last twelve months the distribution was covered 1.39x by cash flow, and for the quarter itself – 1.68x against 1.12x a year earlier.
The coverage increase came from higher adjusted EBITDA and lower interest expense. Distributable cash flow for the quarter was $33.6 million against $22.4 million a year earlier. This allows the company not only to pay the distribution but also to allocate funds to debt repayment and capital expenditure.
At $21.47 the $0.5250 quarterly distribution gives an annual yield of about 9.8%. This is above the yield on 10-year US Treasuries but below the company's own yield in previous years. The stability of the payout depends on maintaining high margin per gallon and avoiding large one-off expenses.
The risk to the distribution is further volume decline and margin compression. If EBITDA returns to the Q1 2026 level ($40.8 million), coverage would remain above 1x but the cushion would shrink. The company has not announced a distribution increase, which signals caution.
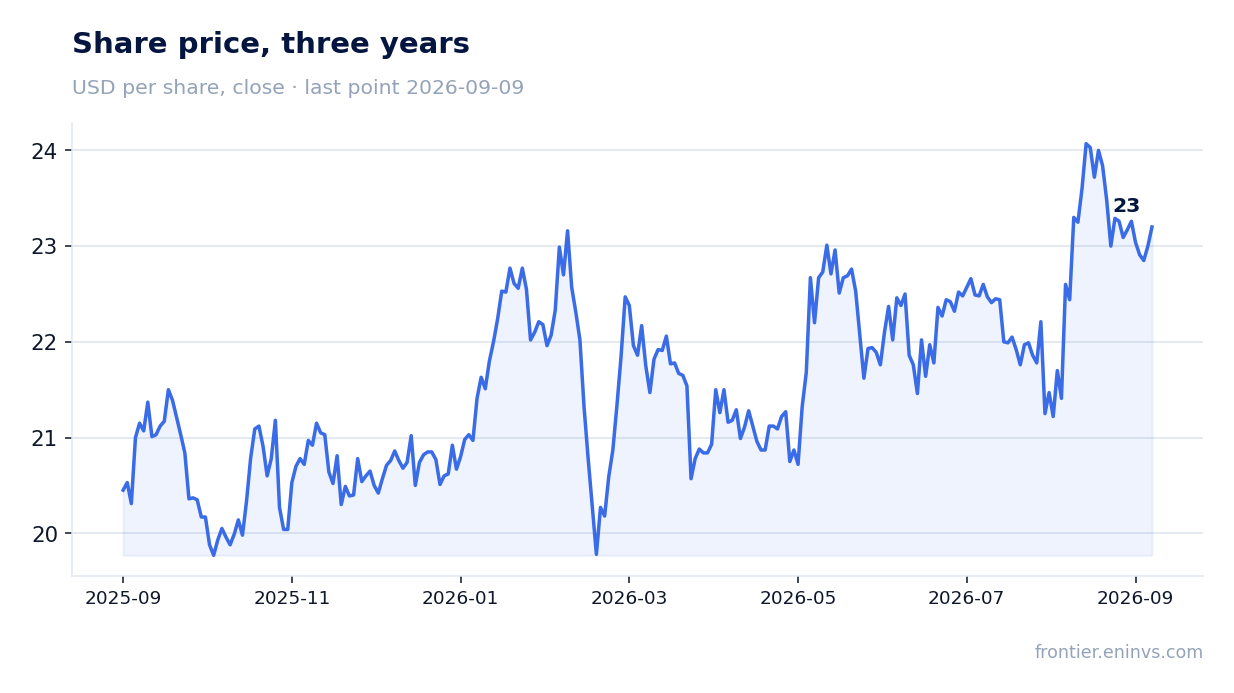
A 9.1x EV/EBITDA and 16.1x P/E leave no cushion to fair value
With a market capitalisation of $887.3 million and net debt of $810.0 million, enterprise value is about $1.7 billion. The trailing-twelve-month EV/EBITDA multiple is 9.1x, P/E – 16.1x. These are moderate levels for a company with falling volumes but rising margin.
The portal's model values the share at only 1% above the current price. This means the market has already priced in the current EBITDA level and does not expect significant growth. For comparison, in previous years the company traded at a higher valuation, but now profit growth is not obvious.
ROE is negative at -89.9%, reflecting accumulated capital deficit. This does not affect the ability to pay distributions but limits the ability to raise new capital. The investor should understand that the company operates with negative equity and is financed by debt.
The share has risen 8.1% from the report to 9 September 2026, but fell 1.2% on the publication day. This suggests the market's assessment is mixed: strong EBITDA is offset by weak net income and no volume growth. At the current valuation, further growth is possible only with a sustained increase in margin.
Valuation on the latest reported figures
| Metric | Value |
|---|---|
| Market cap | 0.89 bn USD |
| P/E (LTM) | 16.1 |
| EV/EBITDA (LTM) | 9.1 |
| Net debt / EBITDA (LTM) | 4.35 |
| Operating cash flow (LTM) | 0.09 bn |
| ROE | -89.9% |
Bottom line
The report showed strong operating dynamics: adjusted EBITDA rose 40% on margin per gallon, and distribution coverage reached 1.68x for the quarter. However, net income fell 17.3% as one-off real estate gains disappeared, and sales volumes continue to decline. Leverage of 4.35x EBITDA remains moderate but is not decreasing. At the current valuation of 9.1x EV/EBITDA and a distribution yield of about 9.8%, the share looks rather attractive for income-oriented investors, but with no cushion to fair value. The key question is whether the company can sustain margin per gallon amid falling volumes.
Open the company's financial profile CAPL →
See also: market overview · valuation map · stock screeners