CF Industries: quarterly profit up 76.6% – but the portal's model sees 17% downside
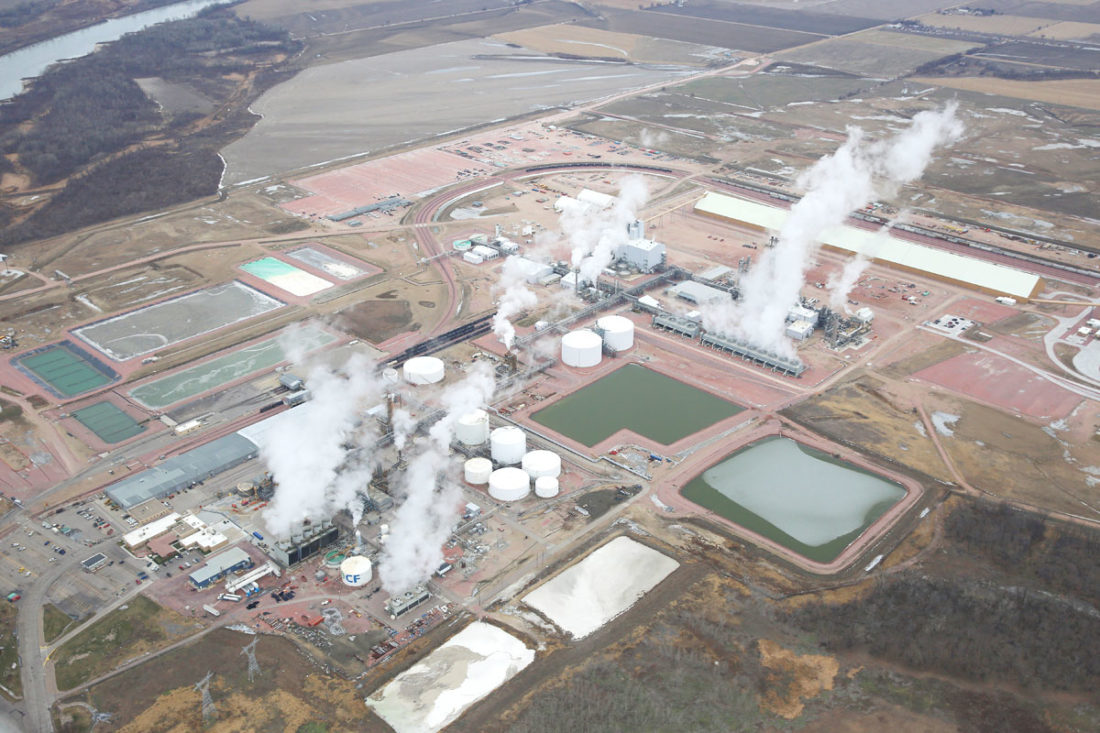
30 июля 2026 года CF Industries раскрыла результаты за второй квартал 2026 года. Выручка выросла на 17,6% год к году до 2 222 млн долл., EBITDA – на 32,5% до 1 336 млн долл., чистая прибыль – на 76,6% до 869 млн долл. При текущей цене акция выглядит скорее непривлекательно: мультипликатор EV/EBITDA выше собственного трёхлетнего среднего, а модель портала указывает на потенциал снижения на 17%.
Key takeaways
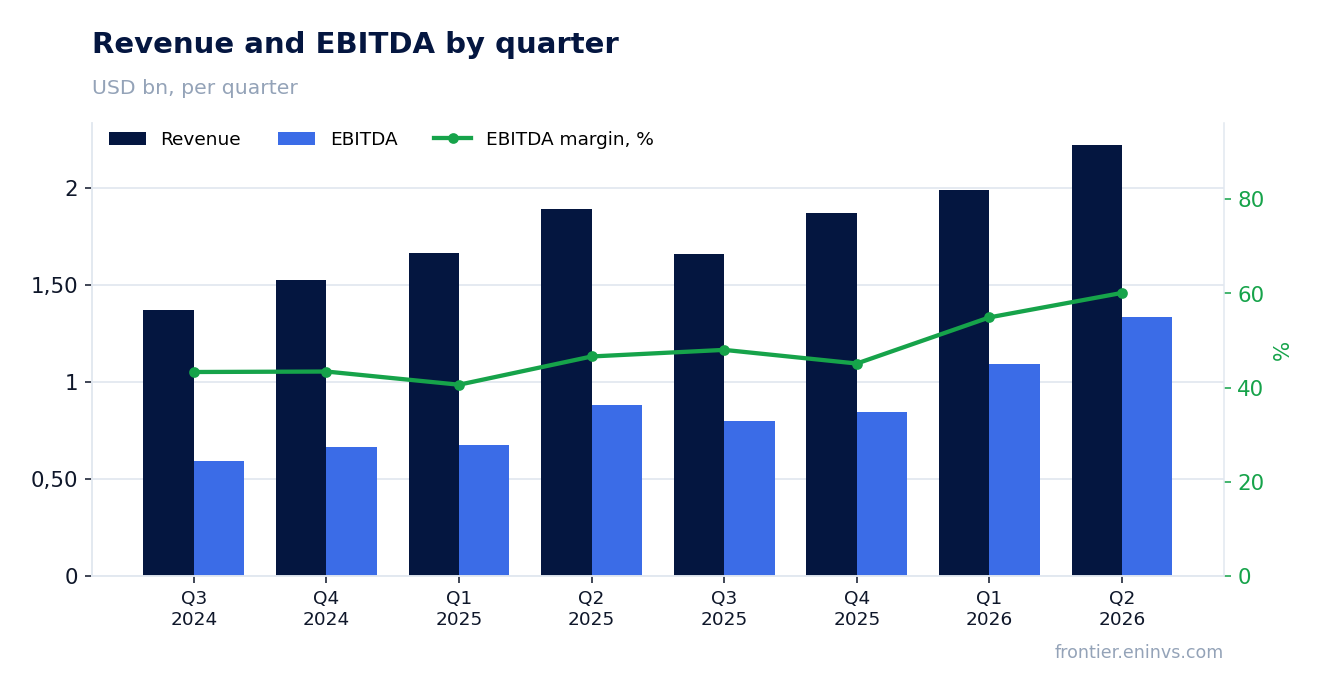
— Revenue in Q2 rose 17.6% to USD 2,222 million – the acceleration was driven by fertilizer prices
— EBITDA margin reached 52.5% versus 46.6% a year earlier – operating leverage worked on higher prices
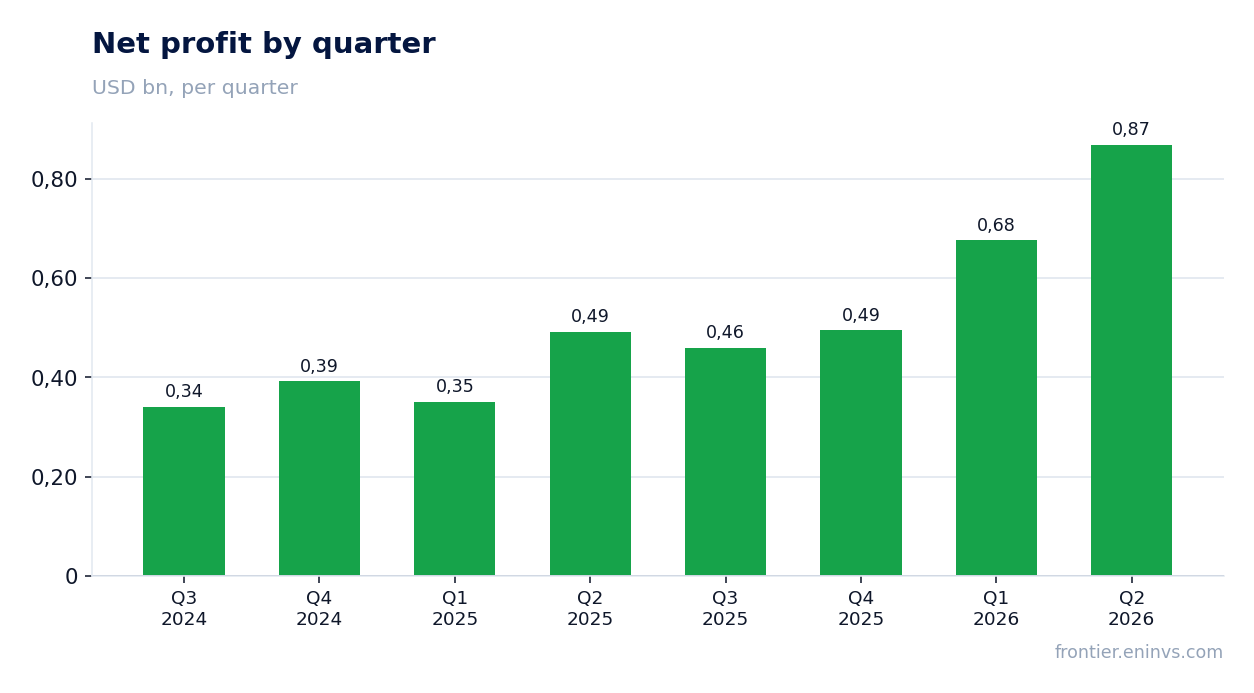
— Net profit rose 76.6% to USD 869 million – net margin jumped to 39.1%
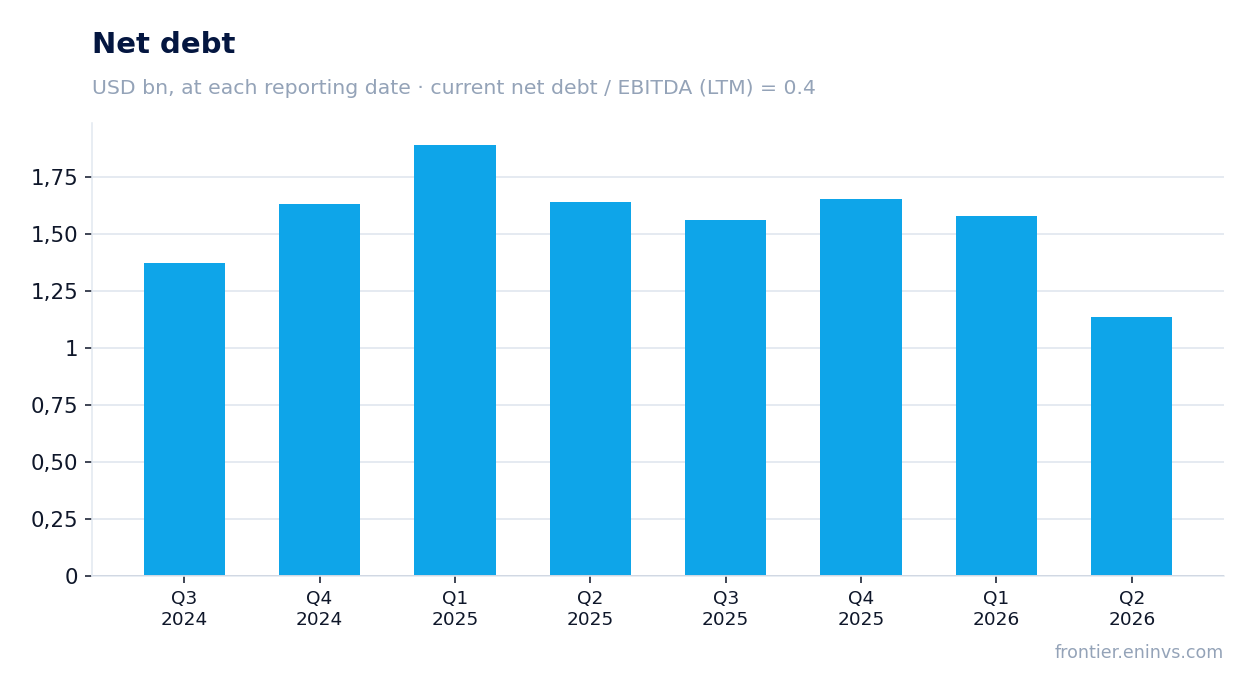
— Leverage remains low: net debt to EBITDA for the trailing twelve months is 0.4
— Operating cash flow in the quarter was USD 878 million, capex – USD 271 million
— Dividend yield over the trailing twelve months – 1.57% – modest for shareholders
— The portal's model sees 17% downside from the current price
Attractiveness
Key figures, USD bn
| Metric | Q2 2025 | Q2 2026 | Change |
|---|---|---|---|
| Revenue | 1.89 | 2.22 | +17.6% |
| EBITDA | 0.88 | 1.17 | +32.5% |
| Operating profit | 0.65 | 1.12 | +73.0% |
| Net profit | 0.49 | 0.87 | +76.6% |
| Operating cash flow | 0.56 | 0.88 | +56.0% |
| Capex | 0.24 | 0.27 | +10.6% |
| EBITDA margin | 46.6% | 52.5% | +5.9 pp |
| Net margin | 26.0% | 39.1% | +13.1 pp |
Revenue in Q2 rose 17.6% to USD 2,222 million – the acceleration was driven by fertilizer prices
In Q2 2026, CF Industries' revenue reached USD 2,222 million, up 17.6% from the same quarter a year earlier. This continues a steady growth trend: in the previous four quarters, growth rates ranged from 19.4% to 22.8%.
The main driver was fertilizer prices, which remained high amid sustained demand. The company does not disclose revenue by segment, but the dynamics point to a favorable pricing environment for nitrogen fertilizers.
EBITDA margin reached 52.5% versus 46.6% a year earlier – operating leverage worked on higher prices
Quarterly EBITDA rose 32.5% year-on-year to USD 1,336 million, and the EBITDA margin expanded from 46.6% to 52.5%. Higher fertilizer prices with relatively stable raw material and energy costs provided strong operating leverage.
The margin expansion is the key indicator that the company is not just growing revenue but also earning more profit from each additional dollar of sales. This is confirmed by operating profit, which rose to USD 1,121 million from USD 648 million a year earlier.
Net profit rose 76.6% to USD 869 million – net margin jumped to 39.1%
Net profit in Q2 reached USD 869 million, up 76.6% from a year earlier. Net margin rose to 39.1% from 26.0% – a result of not only operating leverage but also, likely, low interest expenses and an efficient tax rate.
Net profit growth significantly outpaced EBITDA growth, indicating no one-off write-offs and improved financial items. In previous quarters, net profit also grew faster than EBITDA, but the gap in Q2 was particularly wide.
Leverage remains low: net debt to EBITDA for the trailing twelve months is 0.4
At the end of the quarter, net debt stood at USD 1,654 million, and the net debt to EBITDA ratio for the trailing twelve months was 0.4. This is a very low level, providing the company with financial flexibility.
Net debt decreased by USD 0.4 billion during the quarter and by USD 0.5 billion over the trailing twelve months. Reducing debt while maintaining the investment program is a sign of strong cash flow.
Operating cash flow in the quarter was USD 878 million, capex – USD 271 million
In Q2, operating cash flow was USD 878 million, and capital expenditures were USD 271 million. Free cash flow thus exceeded USD 600 million, covering dividend payments.
Over the trailing twelve months, operating cash flow was USD 2,800 million, confirming the company's ability to generate cash even with significant capital expenditures.
Dividend yield over the trailing twelve months – 1.57% – modest for shareholders
Over the trailing twelve months, the dividend yield was 1.57%. This is modest for a company with such high profitability, but likely reflects a capital return policy through buybacks or a priority on growth investments.
Given current earnings, the company could pay more, but management apparently prefers to maintain a balance between dividends and capital expenditures.
The portal's model sees 17% downside from the current price
According to the portal's model, which re-prices EBITDA at current fertilizer prices and applies a target EV/EBITDA multiple, the fair value of the share is 17% below the current market price. This suggests the market has already priced in high fertilizer prices and strong results.
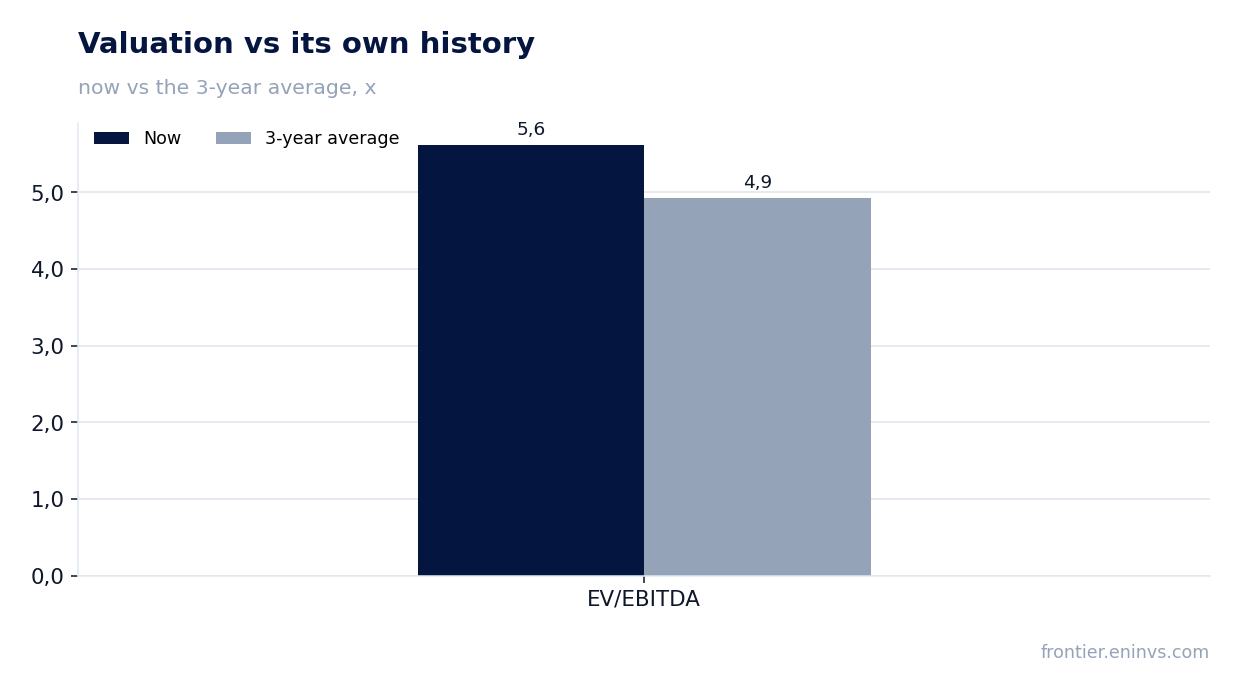
The current EV/EBITDA multiple is 5.6 versus the three-year average of 4.9. The stock trades at a premium to its own history, making it vulnerable to a correction in fertilizer prices.
Valuation on the latest reported figures
| Metric | Value |
|---|---|
| Market cap | 21.7 bn USD |
| P/E (LTM) | 8.7 |
| EV/EBITDA (LTM) | 5.6 |
| P/B | 4.49 |
| Net debt / EBITDA (LTM) | 0.40 |
| Operating cash flow (LTM) | 2.80 bn |
| ROE | 62.7% |
| Dividend yield (12m) | 1.6% |
| EV/EBITDA, 3-year average | 4.9 |
Bottom line
CF Industries delivered a strong quarter: revenue and profit grew at double-digit rates, margins expanded, and leverage remained low. However, these results are already fully reflected in the price: the stock trades above its own three-year multiple, and the portal's model points to downside. With a dividend yield of 1.57% and no clear catalysts for further growth, we view the share as rather unattractive. A sustained decline in fertilizer prices, which would make multiples more attractive, or prices holding longer than expected, could change our view.
Open the company's financial profile CF →
See also: market overview · valuation map · stock screeners