CMB.TECH: Q2 profit jumped 47-fold, but 369 million of it came from a one-off item
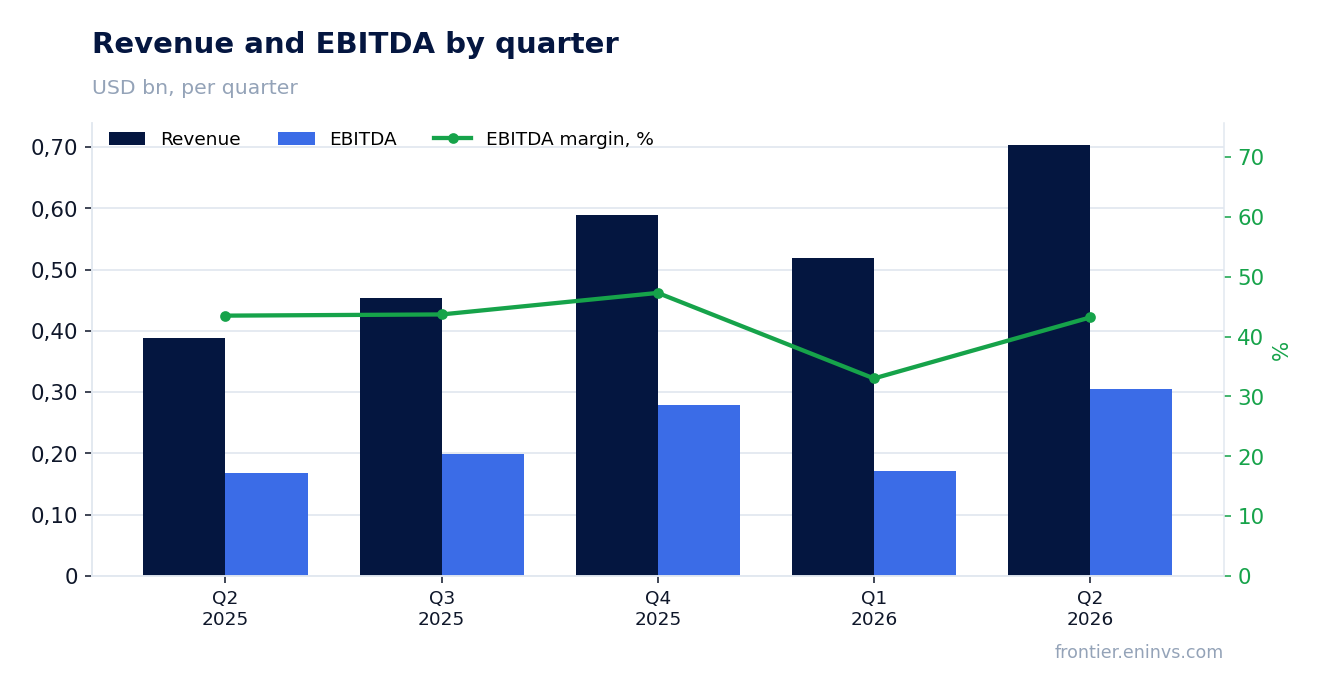
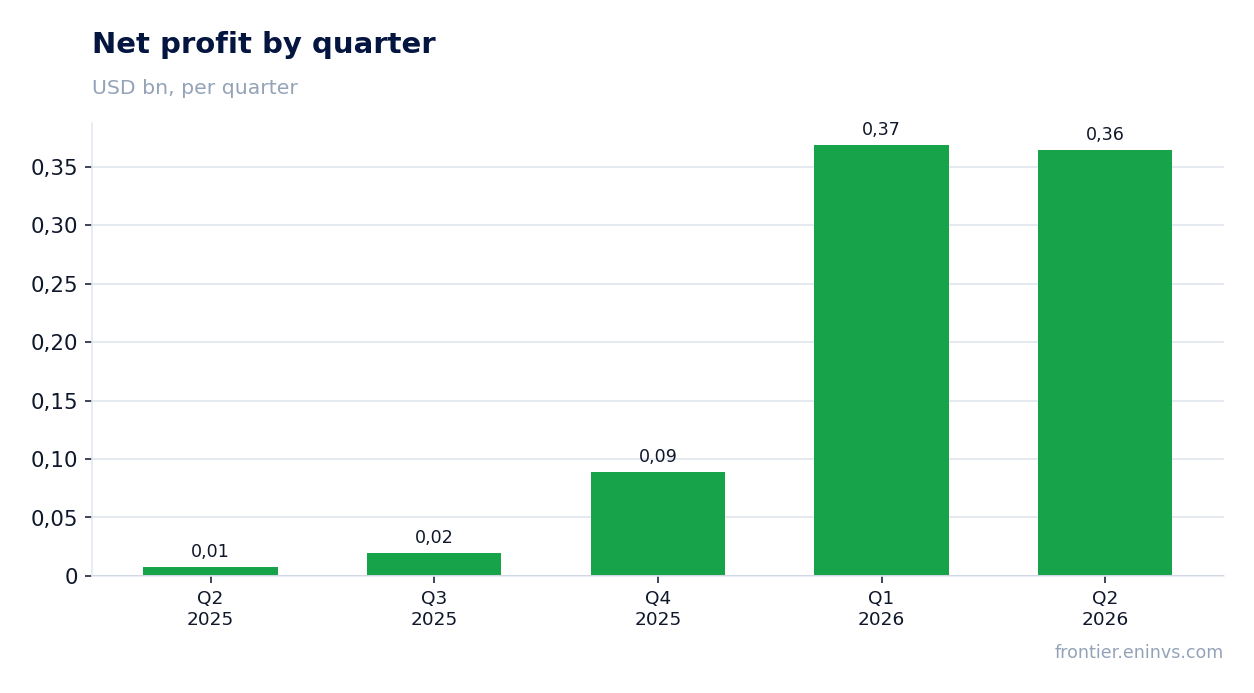
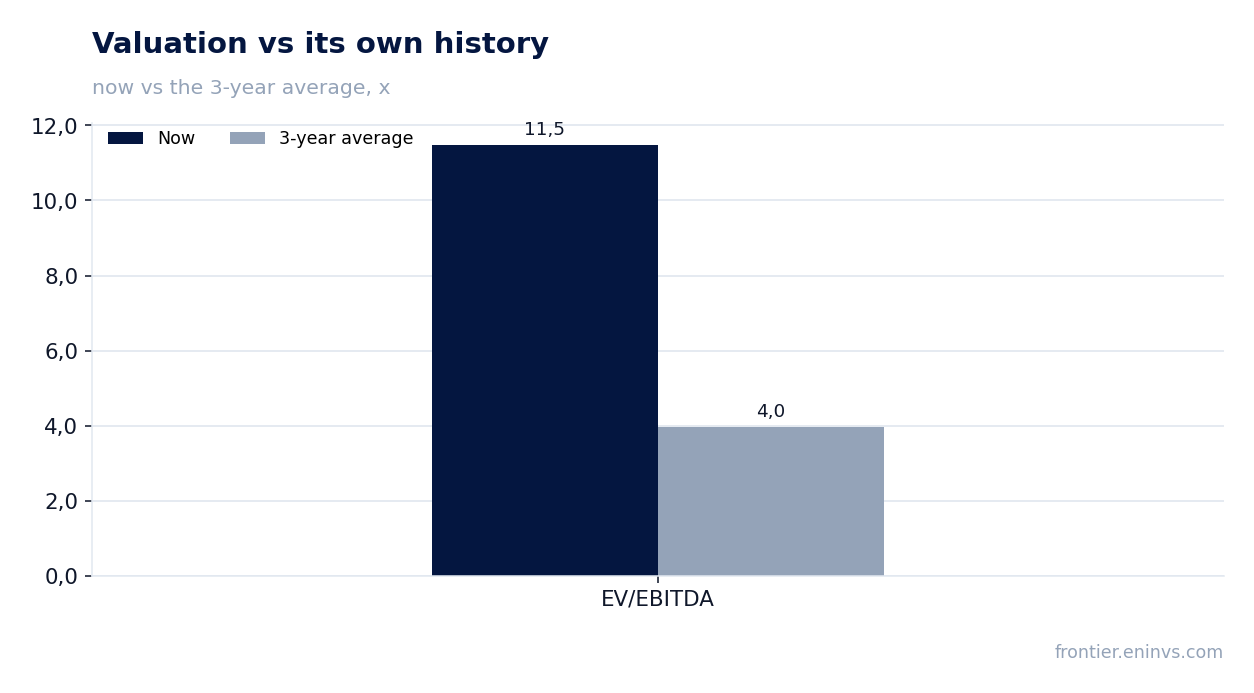
On 25 August CMB.TECH reported results for the second quarter of 2026. Revenue rose 81.5% year on year to 703.9 million, EBITDA – by 84.9% to 304.3 million, and net profit jumped to 364.4 million from 7.8 million a year earlier. EBITDA margin reached 64.0%, net margin – 51.8%. However, almost all of the quarter's profit and 368.8 million in the first quarter came from one-off items rather than operating results, and that is what defines the stock's valuation: with an EV/EBITDA multiple of 11.5 against its own three-year average of 4.0, the share looks overvalued despite the strong report.
Key takeaways
— Revenue rose 81.5% year on year to 703.9 million, but organic growth may have been more modest
— EBITDA margin of 64.0% rests on one-off items, not operating efficiency
— Net profit of 364.4 million is almost entirely driven by one-off items
— Debt load of 2.3x EBITDA LTM is moderate, but debt rose to 5,295.5 million
— Operating cash flow of 249.9 million does not cover investments
— Dividend yield of 4.36% with a payout that may shrink
— Valuation: EV/EBITDA 11.5 versus its own three-year average of 4.0
Attractiveness
Key figures, USD bn
| Metric | Q2 2025 | Q2 2026 | Change |
|---|---|---|---|
| Revenue | 0.39 | 0.70 | +81.5% |
| EBITDA | 0.24 | 0.45 | +84.9% |
| Operating profit | 0.06 | 0.30 | +407.4% |
| Net profit | 0.01 | 0.36 | +4590.8% |
| Operating cash flow | 0.04 | 0.25 | +497.5% |
| Capex | -0.32 | — | — |
| EBITDA margin | 62.8% | 64.0% | +1.2 pp |
| Net margin | 2.0% | 51.8% | +49.8 pp |
Revenue rose 81.5% year on year to 703.9 million, but organic growth may have been more modest
In the second quarter of 2026, CMB.TECH's revenue reached 703.9 million, up 81.5% year on year. This is an acceleration from the first quarter, when revenue was 519.6 million, and from the fourth quarter of 2025 (589.0 million). Such growth looks impressive, but the company does not disclose how much of the increase was organic and how much came from acquisitions or one-off factors.
For comparison: in the third quarter of 2025, revenue was 454.2 million, and in the second quarter of 2025 – 387.8 million. Thus, quarterly revenue nearly doubled over the year. However, without segment detail, it is impossible to judge how sustainable this growth is.
Investors should note that such a high growth rate may be due to a low base effect or one-off contracts. In the next report, it will be important to see whether revenue remains above 700 million or whether this was a one-time spike.
EBITDA margin of 64.0% rests on one-off items, not operating efficiency
EBITDA in the second quarter of 2026 was 304.3 million, with an EBITDA margin of 64.0% versus 62.8% a year earlier. The 1.2 percentage point margin increase looks positive, but it may be driven by one-off factors rather than improved operating efficiency.
Operating profit in the second quarter of 2026 equals EBITDA (304.3 million), meaning there is no depreciation or other operating expenses below EBITDA. This is unusual and suggests that the company may be accounting for some expenses differently or received a one-off income that is not reflected in EBITDA.
In the first quarter of 2026, EBITDA was 171.7 million, and operating profit was also 171.7 million. This reporting structure complicates the analysis of real profitability. Without disclosure of cost line details, it is impossible to judge how sustainable the 64.0% margin is.
For comparison: in the fourth quarter of 2025, EBITDA was 278.6 million, and operating profit was 164.0 million, meaning depreciation and other expenses were significant. In the second quarter of 2026, they are absent, which may indicate the one-off nature of the profit.
Net profit of 364.4 million is almost entirely driven by one-off items
Net profit in the second quarter of 2026 was 364.4 million, 47 times higher than 7.8 million a year earlier. However, this growth is almost entirely due to one-off items rather than operating activities. In the first quarter of 2026, net profit was also abnormally high at 368.8 million, confirming the presence of large one-off gains.
Net margin in the second quarter of 2026 reached 51.8% versus 2.0% a year earlier. This means more than half of revenue turned into net profit, which is highly unusual for an operating business. Most likely, the company recognised income from asset sales, revaluation, or other non-operating items.
Over the last 12 months, net profit was 842.1 million, which also includes one-off items. Without their disclosure, it is impossible to assess sustainable profitability. Investors should focus on EBITDA and operating cash flow rather than net profit.
In the next report, it will be important to see whether high net profit persists or returns to a normal level. If one-off items do not recur, net profit could be significantly lower.
Debt load of 2.3x EBITDA LTM is moderate, but debt rose to 5,295.5 million
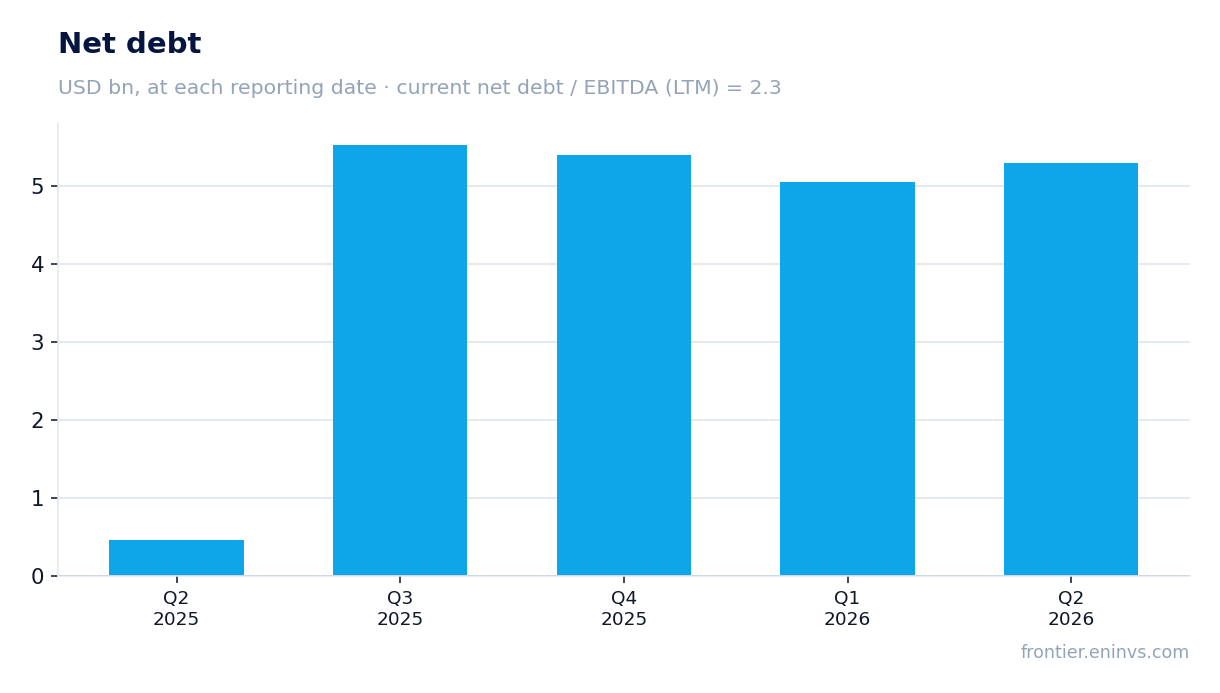
Net debt at the end of the second quarter of 2026 was 5,295.5 million, up 0.3 billion from the previous reporting date and down 0.1 billion from a year earlier. The net debt to EBITDA ratio for the last 12 months is 2.3. This is a moderate level, but it has increased compared to previous periods.
For comparison: in the third quarter of 2025, net debt was 5,528.1 million, in the fourth quarter of 2025 – 5,398.2 million, in the first quarter of 2026 – 5,043.6 million. Thus, debt fluctuates in the range of 5.0–5.5 billion, and its current level is not critical.
However, the 0.3 billion increase in debt over the quarter may indicate the need to finance investments or cover cash flow gaps. With LTM EBITDA of 615.4 million, the 2.3x ratio looks comfortable, but if EBITDA declines, the burden will increase.
It is important to note that the company does not disclose the debt structure and interest rates, which complicates the assessment of interest expenses. In the next report, attention should be paid to debt dynamics and servicing.
Operating cash flow of 249.9 million does not cover investments
Operating cash flow in the second quarter of 2026 was 249.9 million, significantly below net profit (364.4 million). This confirms that profit is largely non-cash. Over the last 12 months, operating cash flow was 783.5 million, also below LTM net profit (842.1 million).
Capital expenditures are not disclosed for the first and second quarters of 2026, but in previous periods they were significant: in the fourth quarter of 2025 – 204.8 million, in the third quarter of 2025 – 277.2 million, in the second quarter of 2025 – 321.5 million. If capital expenditures remain at around 200–300 million per quarter, operating cash flow does not cover investments.
This means the company may need additional financing, which has already led to increased debt. In the next report, it will be important to see whether capital expenditures decrease and whether profit conversion into cash flow improves.
Free cash flow is likely to remain negative, limiting the ability to pay dividends and reduce debt.
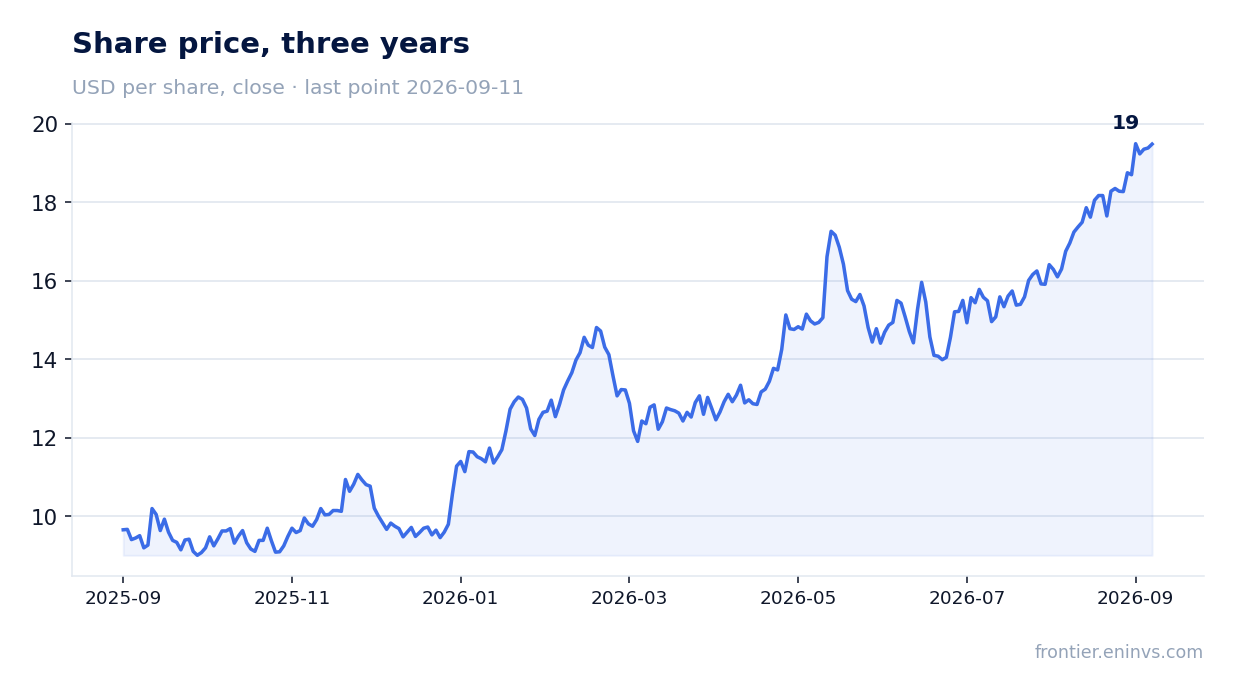
Dividend yield of 4.36% with a payout that may shrink
CMB.TECH's dividend yield over the last 12 months is 4.36%. This is a moderate level that may attract income-oriented investors. However, the sustainability of the dividend is questionable, given that net profit largely consists of one-off items and operating cash flow does not cover capital expenditures.
The company does not disclose its dividend policy or payout ratio. If the dividend is calculated from net profit, it could be significantly reduced if one-off income disappears. For example, if sustainable net profit is only a portion of the LTM 842.1 million, the dividend could be lower.
Our estimate: at the current yield of 4.36%, the dividend looks fair, but it is not protected from a cut. The key factor is the company's ability to generate sustainable cash flow. If operating cash flow remains at the LTM level of 783.5 million and capital expenditures at 800–1000 million per year, free cash flow will be negative, and the dividend may be financed by debt.
For comparison: the key rate in Russia is not known from the facts, but a yield of 4.36% may be insufficient to compensate for risks. In the next report, it will be important to see whether the dividend remains at the current level or is revised.
Valuation: EV/EBITDA 11.5 versus its own three-year average of 4.0
CMB.TECH's current EV/EBITDA multiple is 11.5, significantly above its own three-year average of 4.0. This indicates that the stock is valued much higher than historically. The LTM P/E is 6.7, but it is distorted by one-off items in net profit.
The company's market capitalisation is 5,652.5 million, and LTM EV/EBITDA is 11.5. For comparison: with a three-year average of 4.0, the current level implies either significant future profit growth or overvaluation. Given that LTM EBITDA is 615.4 million and LTM net profit is 842.1 million, the market may be pricing in the sustainability of one-off income, which is unlikely.
Return on equity (ROE) is 48.1%, which looks high but may also be a consequence of one-off items. Without excluding them, ROE does not reflect sustainable profitability.
Thus, the valuation looks inflated relative to its own history. To justify the current multiple, the company needs to demonstrate sustainable growth in EBITDA and net profit without one-off factors.
Valuation on the latest reported figures
| Metric | Value |
|---|---|
| Market cap | 5.65 bn USD |
| P/E (LTM) | 6.7 |
| EV/EBITDA (LTM) | 11.5 |
| P/B | 4.74 |
| Net debt / EBITDA (LTM) | 2.30 |
| Operating cash flow (LTM) | 0.78 bn |
| ROE | 48.1% |
| Dividend yield (12m) | 4.4% |
| EV/EBITDA, 3-year average | 4.0 |
Bottom line
CMB.TECH's Q2 2026 report looks impressive on paper: revenue rose 81.5%, EBITDA – by 84.9%, net profit – 47-fold. However, almost all profit is driven by one-off items rather than operating activities, as evidenced by operating profit equalling EBITDA and an abnormally high net margin of 51.8%. Operating cash flow does not cover capital expenditures, and debt rose to 5,295.5 million. With EV/EBITDA at 11.5 versus its own three-year average of 4.0, the stock looks overvalued. The dividend yield of 4.36% does not compensate for the risks related to profit and cash flow sustainability. The verdict is 'rather unattractive'.
Open the company's financial profile CMBT →
See also: market overview · valuation map · stock screeners