Caledonia Mining: revenue and EBITDA hit new highs, but profit stays flat year on year
Caledonia Mining has reported its results for the second quarter of 2026. Revenue rose 16.2% year on year to USD 75.9 million, EBITDA added 6.0% to USD 42.0 million, and net profit increased 16.2% to USD 23.8 million. The EBITDA margin fell to 55.3% from 60.6% a year earlier, while the net margin held at 31.4%. With an EV/EBITDA of 3.35 and a dividend yield of 1.08%, the share looks cheap on cash flow, but the portal's model points to 49% downside to fair value, so the verdict is neutral.
Key takeaways
— Revenue rose 16.2% year on year to USD 75.9 million, but this is the slowest pace in five quarters
— EBITDA added 6.0% to USD 42.0 million, while its margin fell to 55.3% from 60.6% a year earlier
— Net profit increased 16.2% to USD 23.8 million, with the net margin unchanged at 31.4%
— Operating cash flow for the quarter was USD 28.9 million, while capital expenditure was USD 11.0 million
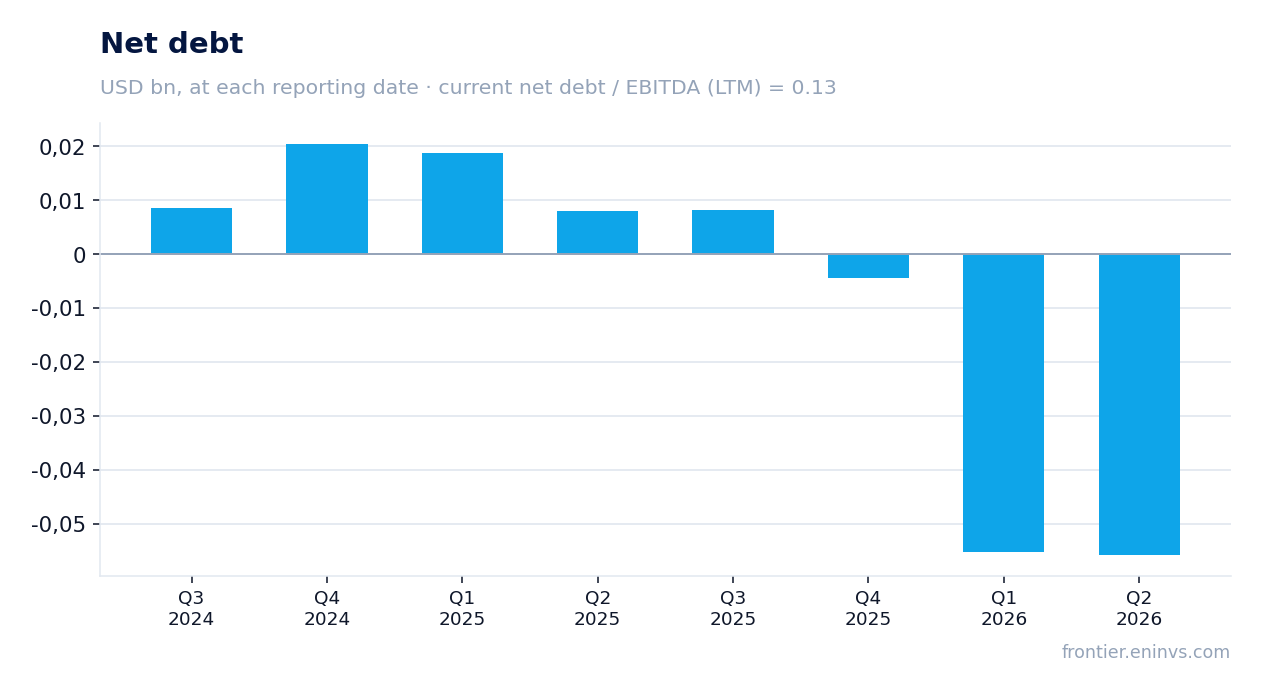
— Net debt is negative at USD 55.9 million, and net debt to LTM EBITDA stands at 0.13
— The trailing 12-month dividend yield is 1.08%, below the key rate and historical levels
— EV/EBITDA LTM of 3.35 and P/E LTM of 7.66 mean the share trades below its historical averages, but the portal's model implies 49% downside
Attractiveness
Key figures, USD bn
| Metric | Q2 2025 | Q2 2026 | Change |
|---|---|---|---|
| Revenue | 0.07 | 0.08 | +16.2% |
| EBITDA | 0.04 | 0.04 | +6.0% |
| Operating profit | 0.04 | 0.03 | -6.0% |
| Net profit | 0.02 | 0.02 | +16.2% |
| Operating cash flow | 0.03 | 0.03 | +3.0% |
| Capex | 0.01 | 0.01 | -10.5% |
| EBITDA margin | 60.6% | 55.3% | -5.3 pp |
| Net margin | 31.4% | 31.4% | +0.0 pp |
Revenue rose 16.2% year on year to USD 75.9 million, but this is the slowest pace in five quarters
In the second quarter of 2026, Caledonia Mining's revenue reached USD 75.9 million, up 16.2% year on year. This is a record quarterly figure, but growth has slowed: in the first quarter of 2026 revenue rose 18.3%, and in the fourth quarter of 2025 it added 43.9%. The deceleration reflects the high base of last year, when revenue grew 37.1% in the second quarter of 2025.
Sequential dynamics are also positive: revenue increased 14.3% from USD 66.4 million in the first quarter of 2026. This points to sustained demand for the company's products despite the year-on-year slowdown. The main drivers were likely both volumes and gold prices, but the exact split is not disclosed in the provided data.
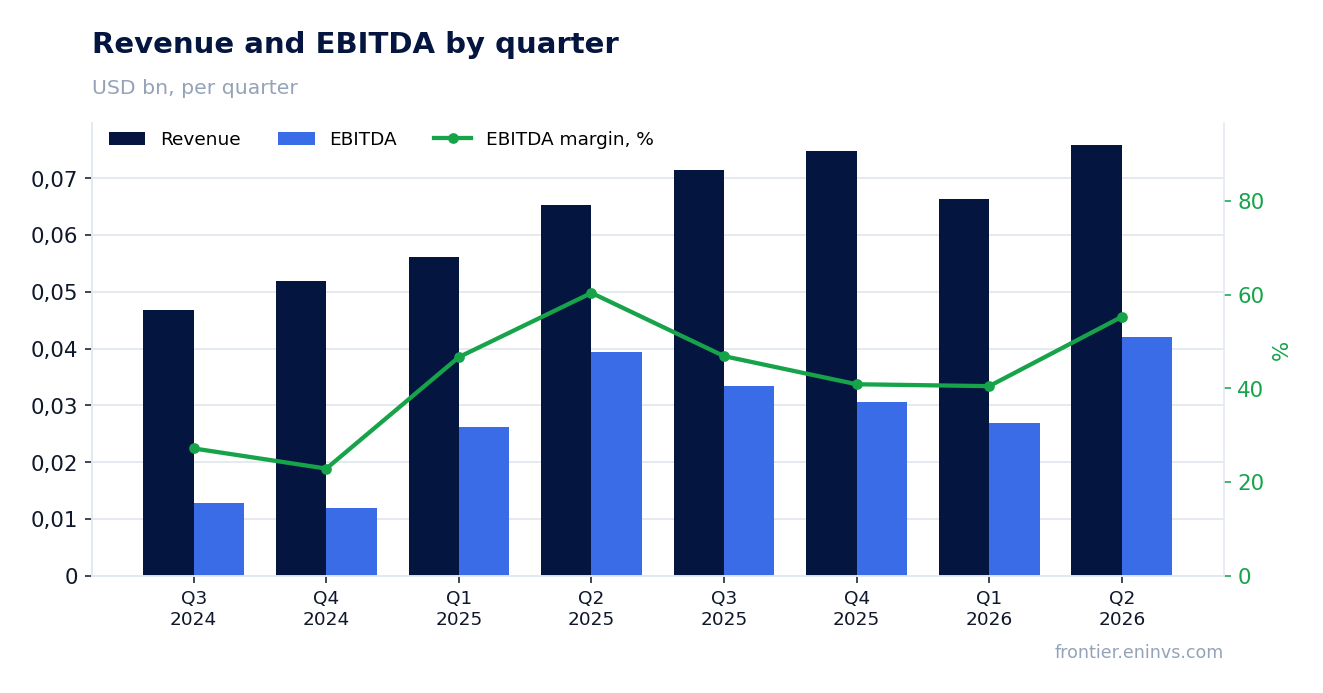
EBITDA added 6.0% to USD 42.0 million, while its margin fell to 55.3% from 60.6% a year earlier
EBITDA in the second quarter of 2026 was USD 42.0 million, up 6.0% year on year. However, the EBITDA margin fell to 55.3% from 60.6% in the second quarter of 2025. This means costs grew faster than revenue, putting pressure on operating efficiency.
The margin decline could be due to higher production costs or a change in the sales mix, but the exact reason is not specified in the provided data. Nevertheless, the absolute EBITDA level remains high, and a margin above 50% indicates the business remains highly profitable.
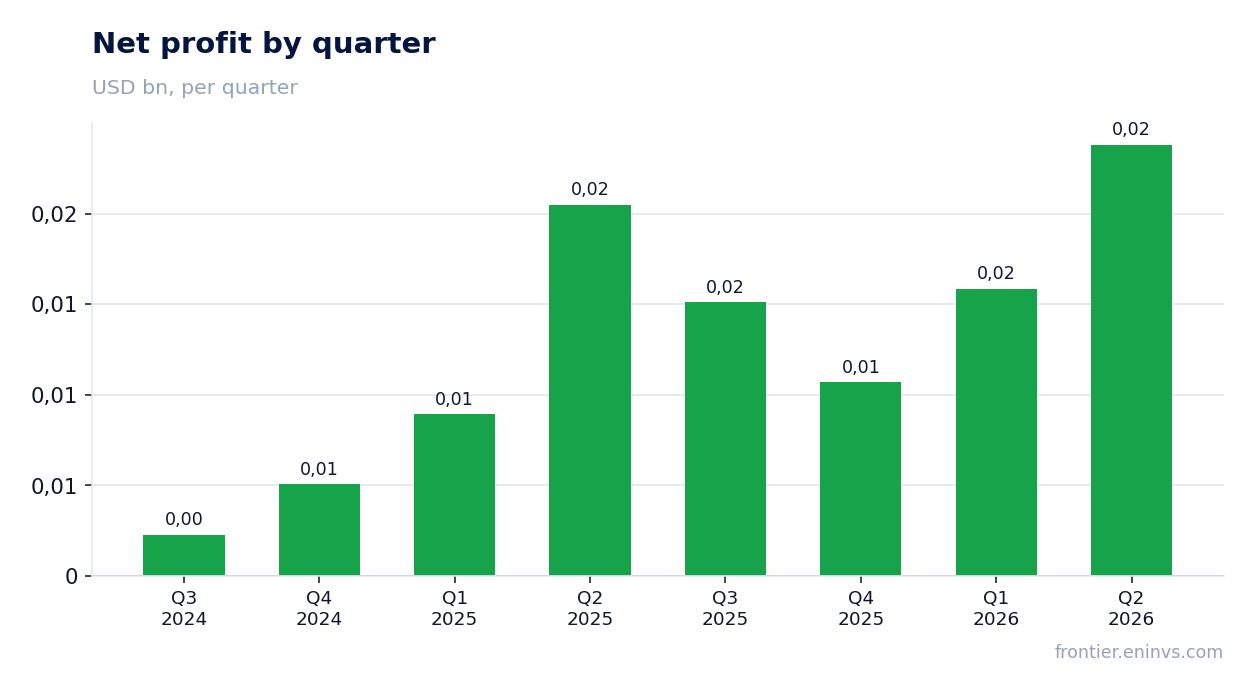
Net profit increased 16.2% to USD 23.8 million, with the net margin unchanged at 31.4%
Net profit in the second quarter of 2026 was USD 23.8 million, up 16.2% year on year. The net margin remained at 31.4%, the same as in the second quarter of 2025. This suggests that profit growth matched revenue growth, and pressure on the operating margin was offset by other factors, possibly lower taxes or interest expenses.
Over the trailing 12 months, net profit amounted to USD 65.5 million. This figure reflects the cumulative result over four quarters and should not be interpreted as profit for the reporting period. The quarterly profit growth is in line with revenue growth, indicating no significant one-off items in profit.
Operating cash flow for the quarter was USD 28.9 million, while capital expenditure was USD 11.0 million
Operating cash flow in the second quarter of 2026 was USD 28.9 million, up 3.0% from USD 28.1 million in the second quarter of 2025. This is somewhat below revenue growth, which may indicate an increase in working capital or other changes in settlements with suppliers and customers.
Capital expenditure rose to USD 11.0 million from USD 12.3 million a year earlier, a decrease of 10.5%. Free cash flow was therefore about USD 17.9 million. The ratio of capital expenditure to revenue fell to 14.6% from 18.9%, which may indicate more efficient use of investments.
Net debt is negative at USD 55.9 million, and net debt to LTM EBITDA stands at 0.13
At the end of the second quarter of 2026, the company's net debt is negative at USD -55.9 million, meaning cash exceeds debt obligations. This is a significant improvement from the end of the first quarter of 2026, when net debt was also negative at USD -55.2 million. A year earlier, net debt was positive at USD 8.1 million.
The ratio of net debt to trailing 12-month EBITDA is 0.13. This is a very low level, indicating high financial stability. However, the provided data does not include an earlier value for this ratio, so it cannot be stated that leverage has fallen or risen – only the current level can be noted.
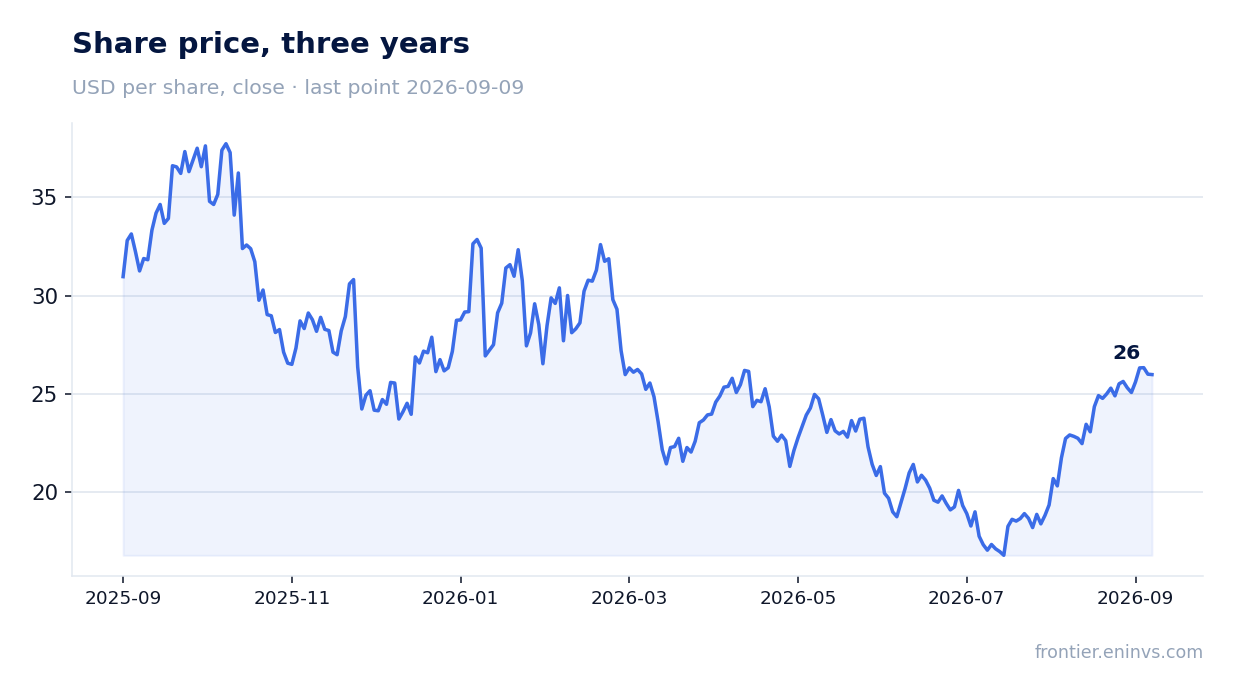
The trailing 12-month dividend yield is 1.08%, below the key rate and historical levels
The trailing 12-month dividend yield is 1.08%. This is a low figure, significantly below the key rate and the company's historical yield levels. At the current share price and profit level, the company pays out a small share of profit as dividends, which may be due to a priority on investment in development.
The provided data does not include information on the dividend for 2025 or the expected dividend for 2026. Our estimate for the 2026 dividend is absent, as there is no data on dividend policy or payout ratio. A yield of 1.08% does not look attractive for income-oriented investors, especially against high interest rates.
EV/EBITDA LTM of 3.35 and P/E LTM of 7.66 mean the share trades below its historical averages, but the portal's model implies 49% downside
The trailing 12-month EV/EBITDA multiple is 3.35, and the P/E is 7.66. These levels appear low both in absolute terms and relative to the company's own three-year historical averages. The low valuation may reflect market concerns about the sustainability of high gold prices or a slowdown in revenue growth.
According to the portal's model, which re-prices EBITDA at current commodity prices and a target EV/EBITDA, the downside to fair value is -49%. This means that even with low multiples, the share could be overvalued if gold prices correct. The company's market capitalisation is USD 501.5 million.
Valuation on the latest reported figures
| Metric | Value |
|---|---|
| Market cap | 0.50 bn USD |
| P/E (LTM) | 7.7 |
| EV/EBITDA (LTM) | 3.4 |
| P/B | 2.34 |
| Net debt / EBITDA (LTM) | 0.13 |
| Operating cash flow (LTM) | 0.08 bn |
| ROE | 33.7% |
| Dividend yield (12m) | 1.1% |
Bottom line
Caledonia Mining delivered record revenue and EBITDA in the second quarter of 2026, but growth slowed and the margin declined. Net profit rose 16.2%, and net debt remains negative, providing financial stability. The dividend yield of 1.08% is low, and the portal's model points to significant downside. The verdict is neutral: strong operating results and low multiples are balanced by slowing growth, margin pressure, and the risks reflected in the model.
Open the company's financial profile CMCL →
See also: market overview · valuation map · stock screeners