CVR Energy: revenue up 55.5%, but one-offs and fertilizer carried the entire quarter

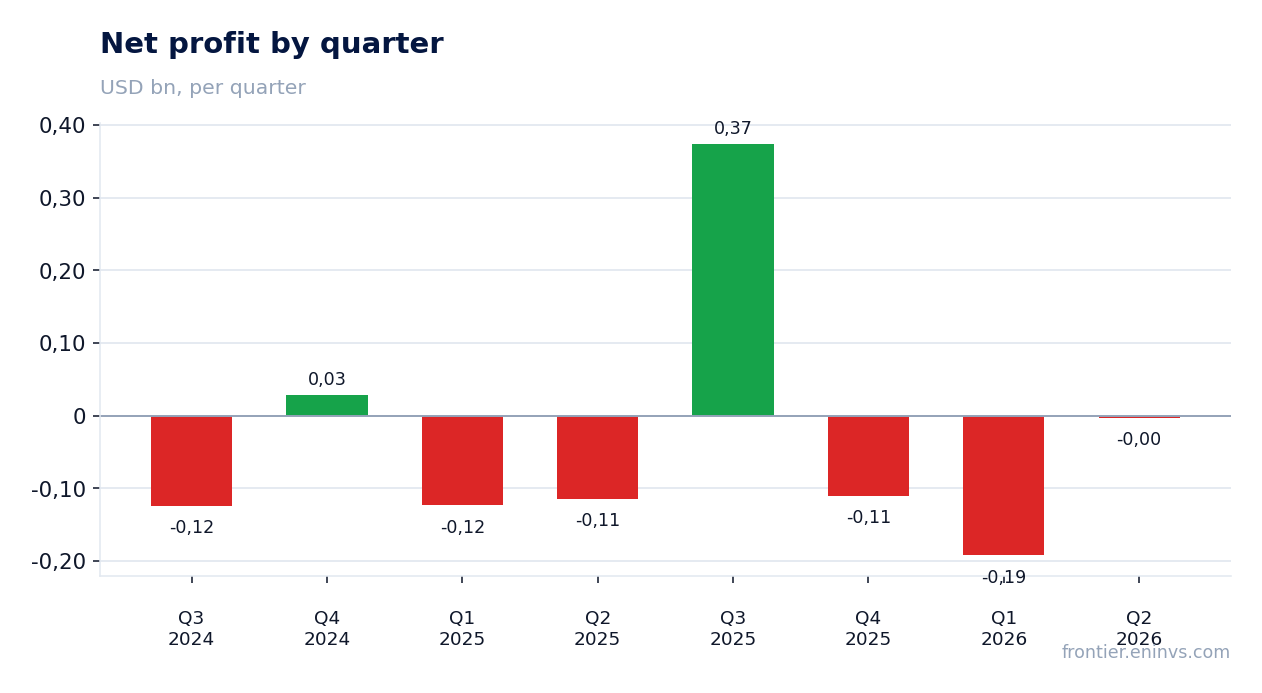
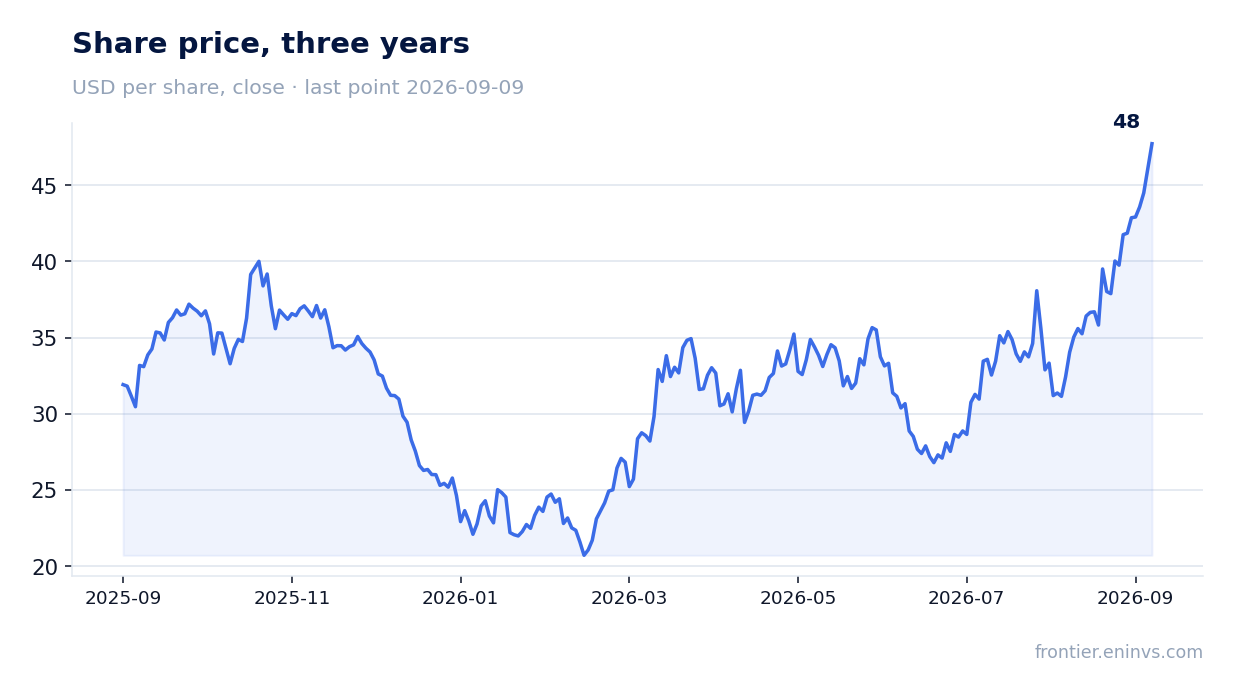
On July 29 CVR Energy reported second-quarter 2026 results. Revenue rose 55.5% year on year to $2,738 million, adjusted EBITDA came in at $209 million versus $99 million a year earlier, and the net loss narrowed to $3 million from $114 million. Refining remains loss-making for the half-year, and the entire positive result rests on the nitrogen segment and one-off items. At $33.74 and an EV/EBITDA of 7.17 against its own three-year average of 5.76, the share looks rather unattractive.
Key takeaways
— Revenue rose 55.5% year on year, but almost all of the gain came from refining on throughput and prices, not sustainable margin
— Adjusted EBITDA of $209 million includes $73 million of one-offs: RFS obligation changes and inventory revaluation
— The nitrogen segment earned $107 million EBITDA and $78 million net income – the only sustainably profitable business in the group
— Refining posted a $182 million half-year loss, and even the $12 million quarterly profit rests on one-off adjustments
— Free cash flow of $264 million for the quarter was funded by liability growth and one-offs, not operating efficiency
— The 10-cent dividend yields 0.42% – a token payment, not a return of capital
— EV/EBITDA of 7.17 against a three-year average of 5.76 and the portal model's minus 24% upside leave no room for appreciation
Attractiveness
Key figures, USD bn
| Metric | Q2 2025 | Q2 2026 | Change |
|---|---|---|---|
| Revenue | 1.76 | 2.74 | +55.5% |
| EBITDA | -0.03 | 0.21 | to profit |
| Operating profit | -0.10 | 0.08 | to profit |
| Net profit | -0.11 | -0.00 | — |
| Operating cash flow | 0.18 | 0.31 | +74.4% |
| Capex | 0.04 | 0.04 | +7.3% |
| EBITDA margin | -1.4% | 7.6% | +9.0 pp |
| Net margin | -6.5% | -0.1% | +6.4 pp |
Revenue rose 55.5% year on year, but almost all of the gain came from refining on throughput and prices, not sustainable margin
Second-quarter 2026 revenue was $2,738 million, up 55.5% year on year. The petroleum segment contributed $2,540 million of that, nitrogen $202 million. The gain came from both higher throughput – 212,965 barrels per day versus 172,149 a year earlier – and higher oil prices: WTI averaged $92.70 per barrel versus $63.74.
Refining capacity utilization reached 98.4% versus 76.9% a year earlier. That explains the revenue surge: a year ago part of the capacity was down for maintenance. But the increase in physical volumes is not matched by an adequate margin increase – the refining margin was $9.94 per barrel versus $2.21 a year earlier, yet the adjusted refining margin rose only from $9.95 to $12.43.
The nitrogen segment posted revenue of $202 million versus $169 million a year earlier. Higher ammonia prices – $791 per ton versus $593 – and 99% capacity utilization versus 91% drove that gain. But the segment's scale is not comparable to refining: it accounts for only 7% of consolidated revenue.
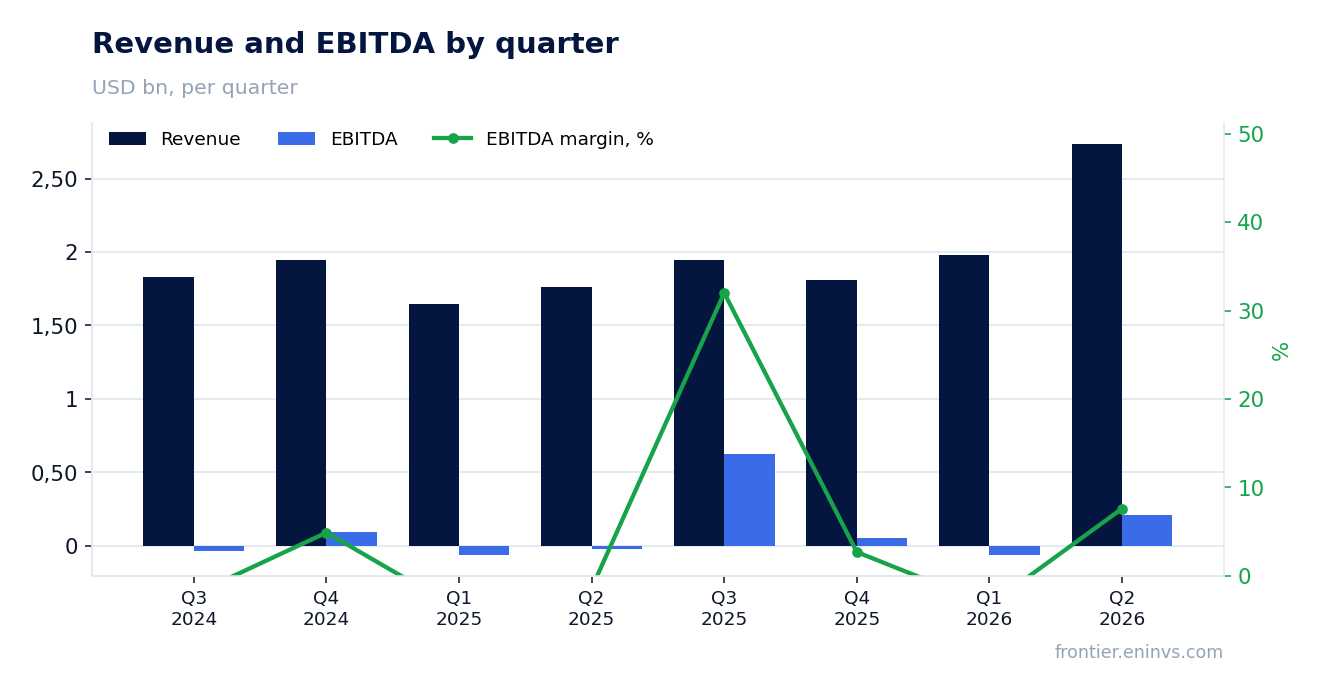
Adjusted EBITDA of $209 million includes $73 million of one-offs: RFS obligation changes and inventory revaluation
Adjusted EBITDA for the second quarter was $209 million versus $99 million a year earlier. However, $73 million of that came from an unfavorable change in the Renewable Fuel Standard obligation, and another $19 million from a favorable inventory revaluation. Without these items the result would have been considerably more modest.
The RFS obligation change is a non-cash expense, an accounting adjustment reflecting higher renewable fuel liability costs. It is added back to EBITDA but brings no cash. The inventory revaluation, by contrast, reduces EBITDA as it reflects higher inventory costs when oil prices rise.
Thus the quality of quarterly EBITDA is low: it was shaped not by operating efficiency but by volatility in regulatory obligations and commodity prices. This makes the metric unsuitable for assessing sustainable earnings power.
The nitrogen segment earned $107 million EBITDA and $78 million net income – the only sustainably profitable business in the group
The nitrogen segment posted EBITDA of $107 million and net income of $78 million in the second quarter. This is the only division that consistently generates profit: for the half-year the segment earned $127 million net income versus $66 million a year earlier.
The gain was driven by fertilizer prices. Ammonia in the southern plains cost $868 per ton versus $576 a year earlier, UAN in the corn belt $534 versus $403. Ammonia capacity utilization reached 99% versus 91%, while ammonia sales volumes were 54 thousand tons versus 57 thousand.
CVR Partners, the operating subsidiary, declared a distribution of $6.08 per unit. CVR Energy owns approximately 37% of the units, providing cash flow to the parent. However, the scale of this business cannot offset refining losses.
Refining posted a $182 million half-year loss, and even the $12 million quarterly profit rests on one-off adjustments
The petroleum segment posted net income of $12 million in the second quarter versus a $137 million loss a year earlier. However, for the half-year the loss was $182 million versus $297 million a year earlier. The quarterly result looks positive only against a weak prior year.
Refining adjusted EBITDA was $106 million, but excluding one-off items – a $73 million RFS obligation change and $19 million inventory revaluation – it would have been significantly lower. The segment's operating income was just $5 million.
The refining margin of $9.94 per barrel remains low. Crack spreads rose – the PADD II Group 3 2-1-1 was $44.91 versus $24.02 a year earlier – but higher feedstock costs and RFS obligations consume most of that improvement.
Free cash flow of $264 million for the quarter was funded by liability growth and one-offs, not operating efficiency
Operating cash flow for the second quarter was $307 million, free cash flow $264 million. However, these figures include liability growth and one-off items, not sustainable operating profit. For the half-year operating cash flow was $371 million, but capital expenditure and turnaround costs consumed most of it.
Capital expenditure for the quarter was $44 million, with another $148 million spent on capitalized turnaround works. These are substantial investments that do not generate immediate returns. Free cash flow of $264 million looks attractive, but it was partly formed by growth in accounts payable and liabilities.
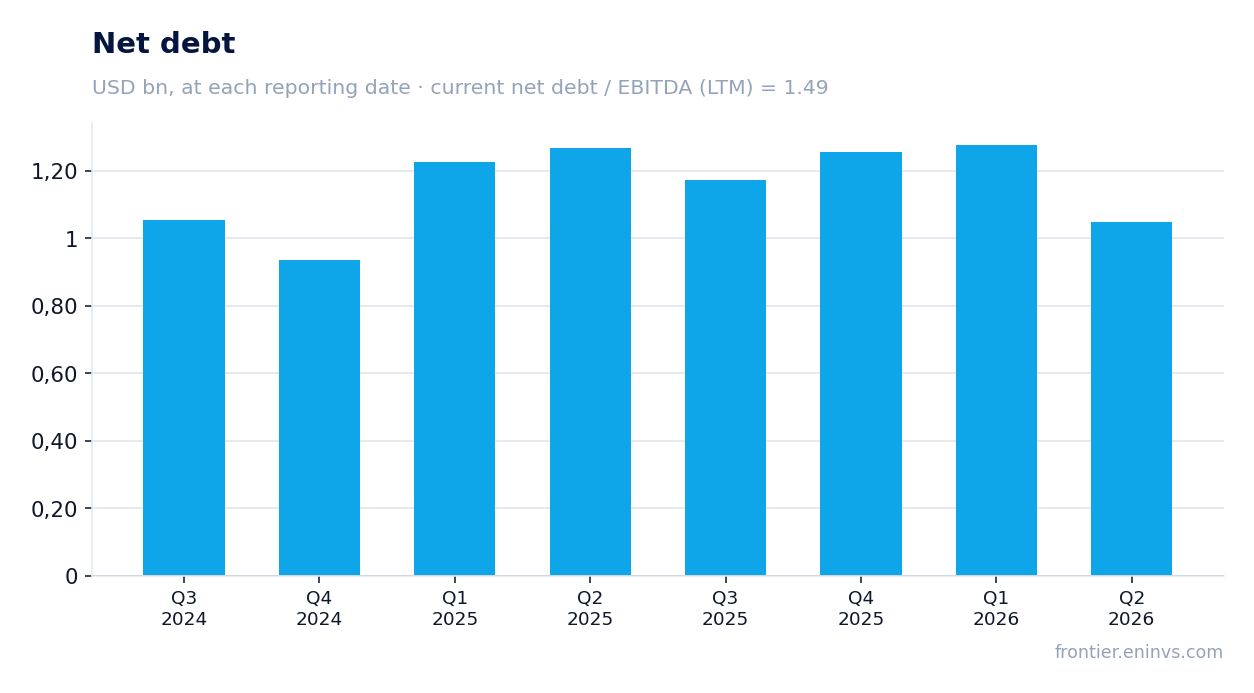
Net debt at quarter-end was $1,050 million, down from $1,278 million at the end of the first quarter. However, the net debt to EBITDA ratio for the trailing twelve months is 1.49 – a moderate level, but calculated on EBITDA that includes one-off items.
The 10-cent dividend yields 0.42% – a token payment, not a return of capital
CVR Energy declared a dividend of 10 cents per share for the second quarter of 2026. At $33.74 that yields 0.42% – a token amount that does not even cover inflation. A year earlier the company paid no dividends.
Our estimate of the annual dividend is based on the quarterly payment of 10 cents, giving 40 cents per share. This corresponds to a payout ratio of about 58% of adjusted earnings per share of $0.34 for the quarter, but with a net loss of $3 million the payment is funded from cash flow, not profit.
The 0.42% yield is not comparable to the key rate and is not a factor of investment appeal. The payment signals an intention to maintain dividend history rather than a real return of capital to shareholders.
EV/EBITDA of 7.17 against a three-year average of 5.76 and the portal model's minus 24% upside leave no room for appreciation
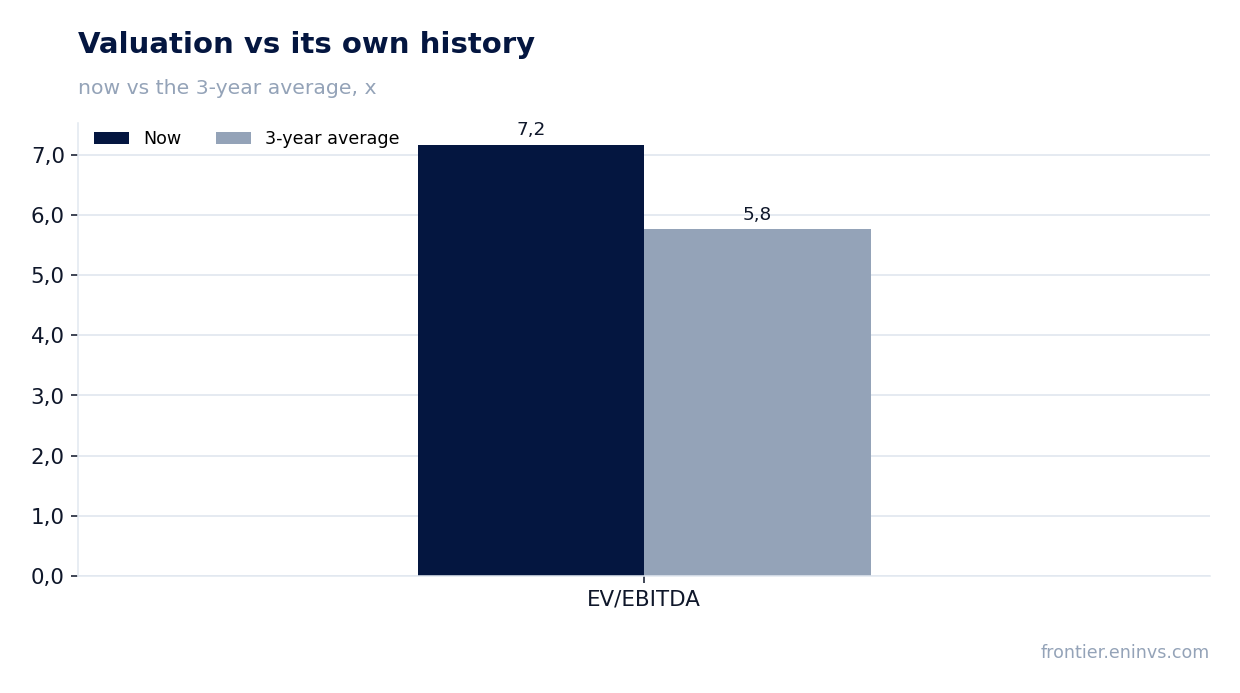
The current EV/EBITDA for the trailing twelve months is 7.17. This is above its own three-year average of 5.76 – the stock trades at a premium to its history. The trailing P/E is 69.5, reflecting extremely low earnings for the period.
According to the portal's model, which re-prices EBITDA at current commodity prices at the target EV/EBITDA, the upside to fair value is minus 24%. This is our own estimate, not a market consensus. It indicates that the current price is inflated relative to fundamental value.
Market capitalization is $4,797 million. With net debt of $1,050 million and trailing twelve-month EBITDA of $845 million, the valuation looks stretched. Justifying the current price would require sustainable EBITDA growth, which is not yet visible.
Valuation on the latest reported figures
| Metric | Value |
|---|---|
| Market cap | 4.80 bn USD |
| P/E (LTM) | 69.5 |
| EV/EBITDA (LTM) | 7.2 |
| P/B | 6.57 |
| Net debt / EBITDA (LTM) | 1.49 |
| Operating cash flow (LTM) | 0.14 bn |
| ROE | -2.3% |
| Dividend yield (12m) | 0.4% |
| EV/EBITDA, 3-year average | 5.8 |
Bottom line
CVR Energy showed strong revenue growth of 55.5% and a narrower loss, but the quality of these results is low. Adjusted EBITDA of $209 million includes $73 million of one-offs, and refining remains loss-making for the half-year. The only sustainably profitable business – the nitrogen segment – is too small to offset the losses. The 10-cent dividend yields 0.42%, which is of no interest to investors. EV/EBITDA of 7.17 against a three-year average of 5.76 and the portal model's minus 24% upside point to overvaluation. Verdict: the share is rather unattractive at current levels.
Open the company's financial profile CVI →
See also: market overview · valuation map · stock screeners