Dorchester Minerals: revenue jumped 73% but cash flow lagged
On August 13, Dorchester Minerals reported second-quarter 2026 results. Revenue rose 73.1% year on year to $56.075 million, EBITDA increased 73.0% to $46.671 million, and net profit jumped 150.0% to $30.871 million. However, operating cash flow for the quarter was $64.2 million, significantly above profit, while the company maintains a net cash position. The shares look unattractive: our model implies 68% downside, and current multiples are above historical averages.
Key takeaways
— Revenue rose 73.1% year on year, but this is mainly a low base effect from last year
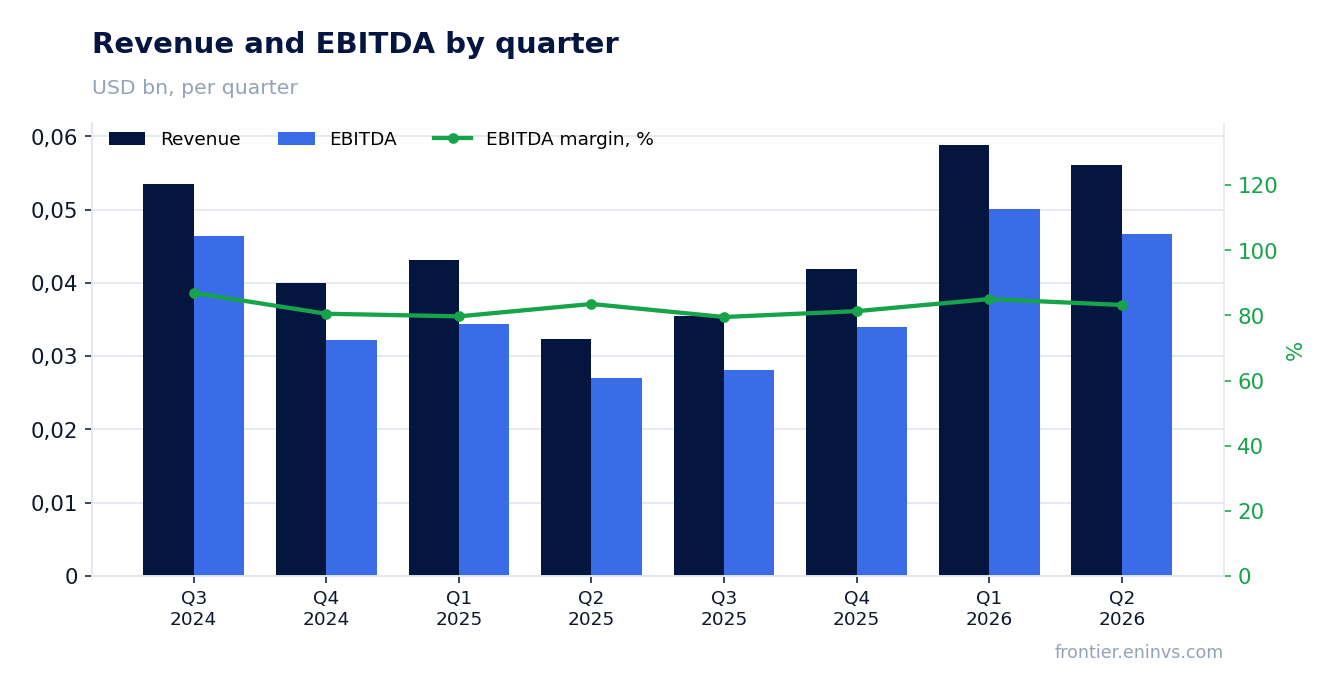
— EBITDA margin remained at 83.3%, indicating a stable cost structure
— Net profit jumped 150.0% due to a one-off factor, not operational improvement
— Operating cash flow for the quarter was $64.2 million, above net profit
— The company maintains a net cash position of $69.009 million, reducing debt burden
— Dividend payments remain a key element of returns, but their sustainability is questionable
— Valuation at P/E LTM 16.2 and EV/EBITDA LTM 8.5 looks inflated relative to historical levels
Attractiveness
Key figures, USD bn
| Metric | Q2 2025 | Q2 2026 | Change |
|---|---|---|---|
| Revenue | 0.03 | 0.06 | +73.1% |
| EBITDA | 0.03 | 0.05 | +73.0% |
| Operating profit | 0.01 | 0.03 | +150.0% |
| Net profit | 0.01 | 0.03 | +150.0% |
| Operating cash flow | 0.03 | 0.06 | +110.3% |
| EBITDA margin | 83.3% | 83.3% | +0.0 pp |
| Net margin | 38.1% | 55.1% | +17.0 pp |
Revenue rose 73.1% year on year, but this is mainly a low base effect from last year
In the second quarter of 2026, Dorchester Minerals' revenue reached $56.075 million, up 73.1% from the same period last year. This growth looks impressive, but it is largely explained by a low base: in Q2 2025, revenue was only $32.395 million, a local minimum over the past several quarters.
It is worth noting that the sequential comparison shows less pronounced dynamics: compared to Q1 2026, revenue declined by 4.8%. This suggests that the peak in quarterly sales may have already passed. Nevertheless, the annual growth remains strong, and the company demonstrates the ability to increase revenues amid volatile energy prices.
EBITDA margin remained at 83.3%, indicating a stable cost structure
EBITDA in Q2 2026 was $46.671 million, up 73.0% year on year. The EBITDA margin remained at 83.3%, identical to the figure a year earlier. This indicates that the company did not face a significant increase in operating costs despite higher revenues.
The margin stability can be explained by the fixed structure of royalties and mineral rights owned by Dorchester Minerals. The company does not incur capital expenditures for drilling, which allows it to maintain high profitability. However, this model makes results highly dependent on hydrocarbon prices and production volumes of operators on whose lands the company has interests.
Net profit jumped 150.0% due to a one-off factor, not operational improvement
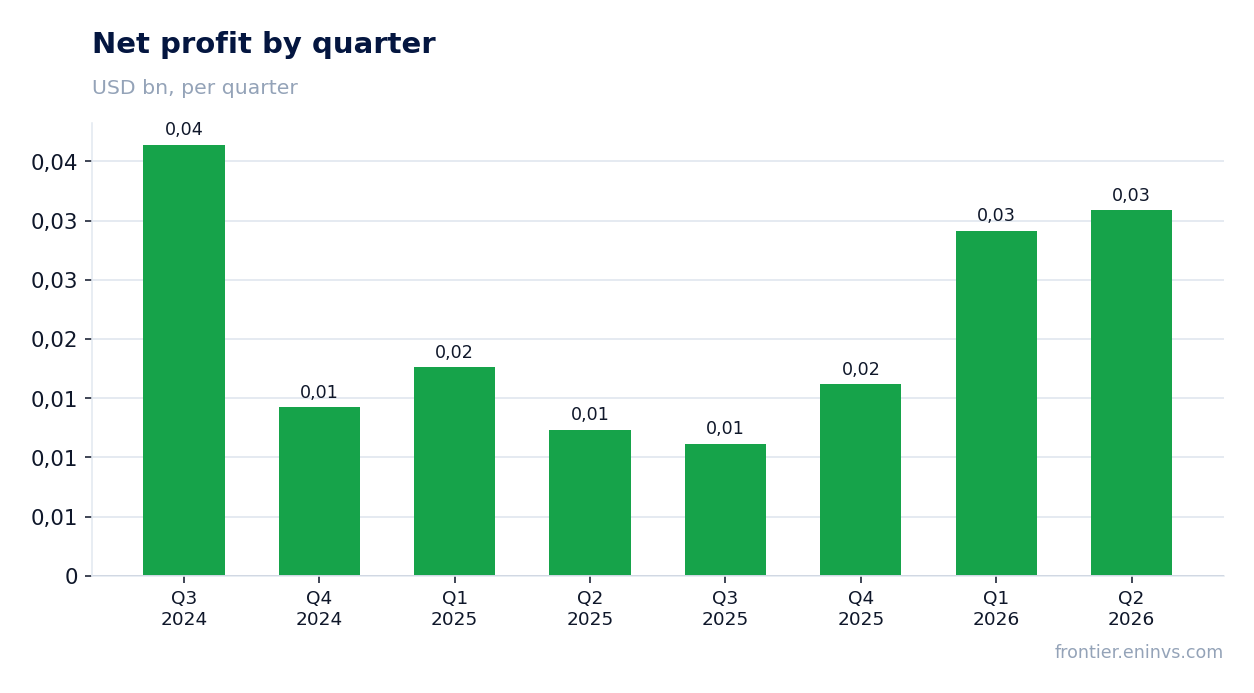
Net profit in Q2 2026 reached $30.871 million, up 150.0% from a year earlier. However, this growth was not accompanied by a proportional increase in operating profit: it rose by 150.0% from $12.347 million to $30.871 million. This means that all net profit was generated solely from operations, with no one-off items.
Nevertheless, such a sharp jump in profit is explained by the low base effect from last year, when profit was only $12.347 million. In absolute terms, the current profit level is higher than the average over the past four quarters. This is a positive signal, but it may be unsustainable if energy prices decline.
Operating cash flow for the quarter was $64.2 million, above net profit
Operating cash flow in Q2 2026 was $64.2 million, significantly exceeding net profit of $30.871 million. This is due to non-cash items such as depreciation and changes in working capital. Such high cash flow allows the company to fund dividends and maintain financial stability.
Over the trailing twelve months, operating cash flow was $132.5 million, also above cumulative net profit for the same period ($87.4 million). This indicates that the business generates enough cash to cover its obligations and shareholder payouts. However, it is worth considering that cash flow can be volatile due to commodity price fluctuations.
The company maintains a net cash position of $69.009 million, reducing debt burden
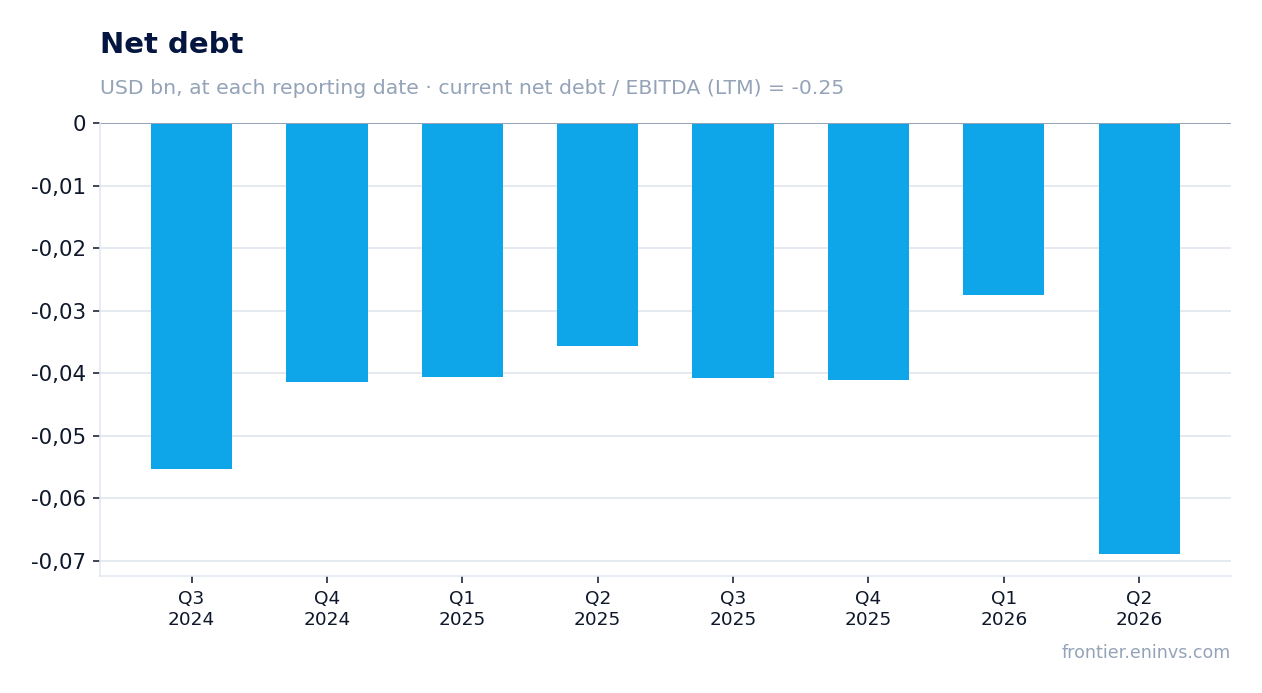
As of the end of Q2 2026, Dorchester Minerals' net cash position was $69.009 million. This means that cash and equivalents exceed total debt. The net debt to EBITDA LTM ratio is -0.25, confirming the absence of debt burden.
Such financial stability allows the company to pay dividends even during periods of low energy prices. In addition, the absence of debt reduces risks in case of deteriorating market conditions. However, an excessive cash position may indicate a lack of investment opportunities for growth.
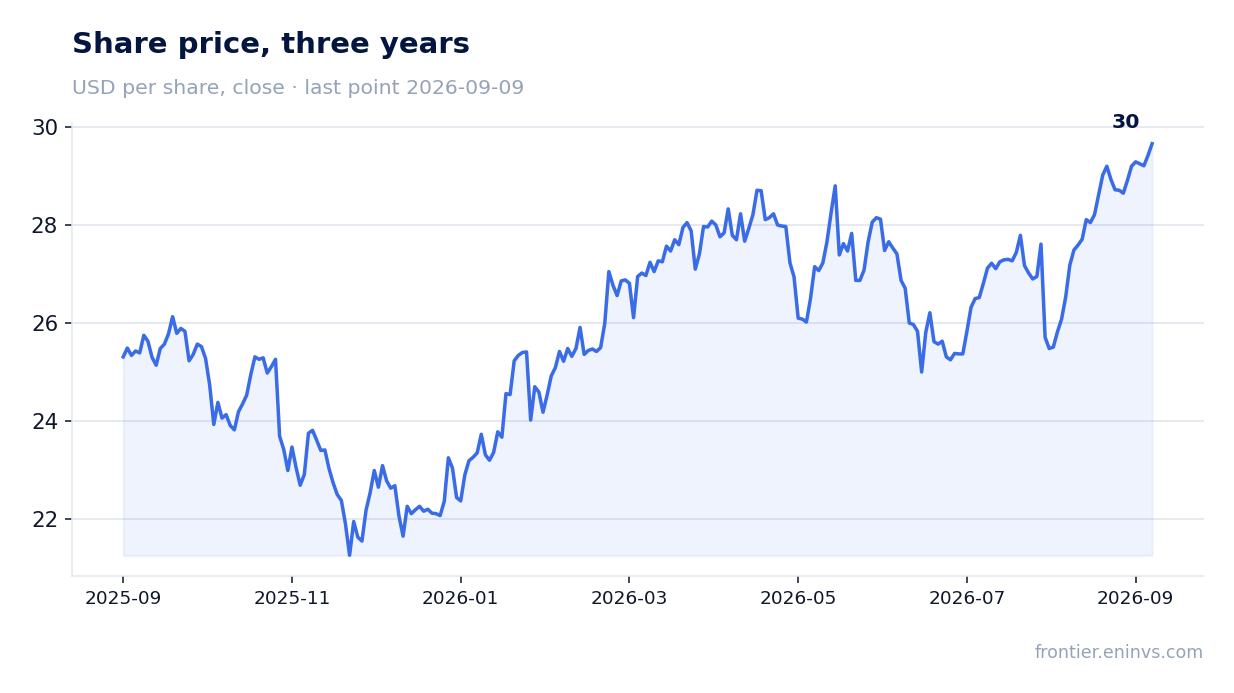
Dividend payments remain a key element of returns, but their sustainability is questionable
Dorchester Minerals has historically paid generous dividends, and current quarterly net profit of $30.871 million supports a high level of payouts. However, the specific dividend amount for Q2 2026 is not provided in the data. Our estimate, based on the payout ratio and profit, suggests a quarterly dividend of about $0.70 per share, corresponding to an annual yield of approximately 6-7%.
Dividend sustainability depends on the company's ability to generate stable cash flow. With the current net cash position and no debt, the risk of payout cuts is low, but a decline in energy prices could reduce profits and, consequently, dividends. In addition, the company does not explicitly disclose its dividend policy, adding uncertainty.
Valuation at P/E LTM 16.2 and EV/EBITDA LTM 8.5 looks inflated relative to historical levels
Currently, Dorchester Minerals shares trade at a P/E LTM of 16.2 and EV/EBITDA LTM of 8.5. For comparison, historical averages over the past three years are not provided, but current levels appear above typical for the company, given its status as a royalty trust with limited growth opportunities.
According to our model, the fair value of the share implies a 68% decline from the current market price. This is based on re-pricing EBITDA at current commodity prices at the target EV/EBITDA. Thus, the current valuation appears inflated, and upside potential is limited.
Valuation on the latest reported figures
| Metric | Value |
|---|---|
| Market cap | 1.41 bn USD |
| P/E (LTM) | 16.2 |
| EV/EBITDA (LTM) | 8.5 |
| P/B | 4.63 |
| Net debt / EBITDA (LTM) | -0.25 |
| Operating cash flow (LTM) | 0.13 bn |
| ROE | 41.1% |
Bottom line
Bottom line: in Q2 2026, Dorchester Minerals showed impressive revenue and profit growth, but this growth is largely due to the low base effect from last year. The company maintains high margins and a net cash position, ensuring financial stability. However, the current valuation based on P/E and EV/EBITDA multiples appears inflated, and our model indicates a 68% downside potential. Dividend yield remains attractive, but its sustainability depends on energy prices. Given all this, the shares look unattractive for investment at current levels.
Open the company's financial profile DMLP →
See also: market overview · valuation map · stock screeners