Evolution Petroleum: the $8.9m loss is mostly unrealised hedges, not a collapsing business
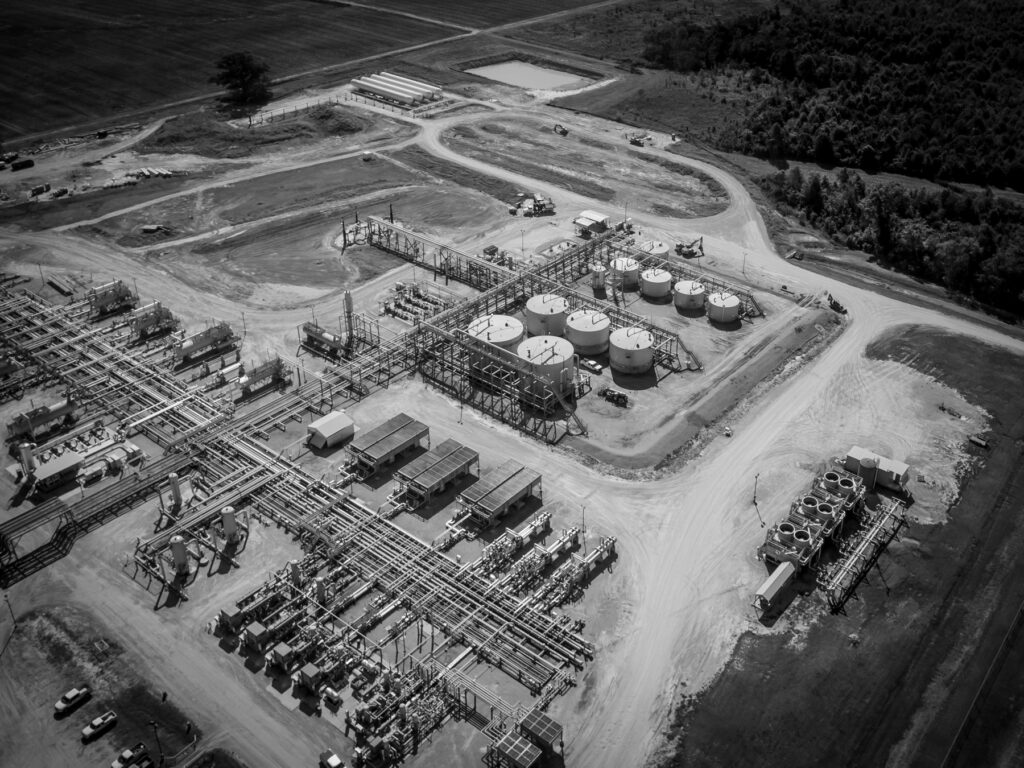
On 12 May Evolution Petroleum released results for its fiscal third quarter of 2026, ended 31 March. Revenue fell 10.6% year on year to $20.2m, reported-period EBITDA dropped 28.2% to $4.7m, and the net loss reached $8.9m against $2.2m a year earlier. Of that loss, $7.6m came from an unrealised mark-to-market charge on hedges, while adjusted EBITDA was $3.1m and operating cash flow stayed positive at $3.5m. With EV/EBITDA at 7.3 against its own three-year average of 6.4 and a 13% dividend yield, the share looks rather unattractive: the market is already pricing a recovery the report does not yet show.
Key takeaways
— Revenue fell 10.6% on prices, not volumes: production actually rose to 6,700 barrels of oil equivalent per day
— Of the $8.9m loss, $7.6m is an unrealised hedge mark-to-market, not cash losses
— Adjusted EBITDA of $3.1m is four times below last year's $7.4m, hit by one-off charges and weak gas differentials
— Debt at 1.62x LTM EBITDA with $56.5m borrowed and only $10.4m of liquidity leaves a thin cushion
— The $0.12 per share dividend has run for 51 consecutive quarters, but $4.3m of quarterly payouts exceed adjusted earnings
— EV/EBITDA of 7.3 against its own three-year average of 6.4 means the market is paying up for a recovery not yet confirmed
Attractiveness
Key figures, USD bn
| Metric | Q3 2025 | Q3 2026 | Change |
|---|---|---|---|
| Revenue | 0.02 | 0.02 | -10.6% |
| EBITDA | 0.01 | 0.00 | -28.2% |
| Operating profit | 0.00 | -0.00 | -135.2% |
| Net profit | -0.00 | -0.01 | — |
| Operating cash flow | 0.01 | 0.00 | -52.0% |
| Capex | 0.00 | 0.01 | +33.9% |
| EBITDA margin | 29.3% | 23.5% | -5.8 pp |
| Net margin | -9.7% | -44.3% | -34.6 pp |
Revenue fell 10.6% on prices, not volumes: production actually rose to 6,700 barrels of oil equivalent per day
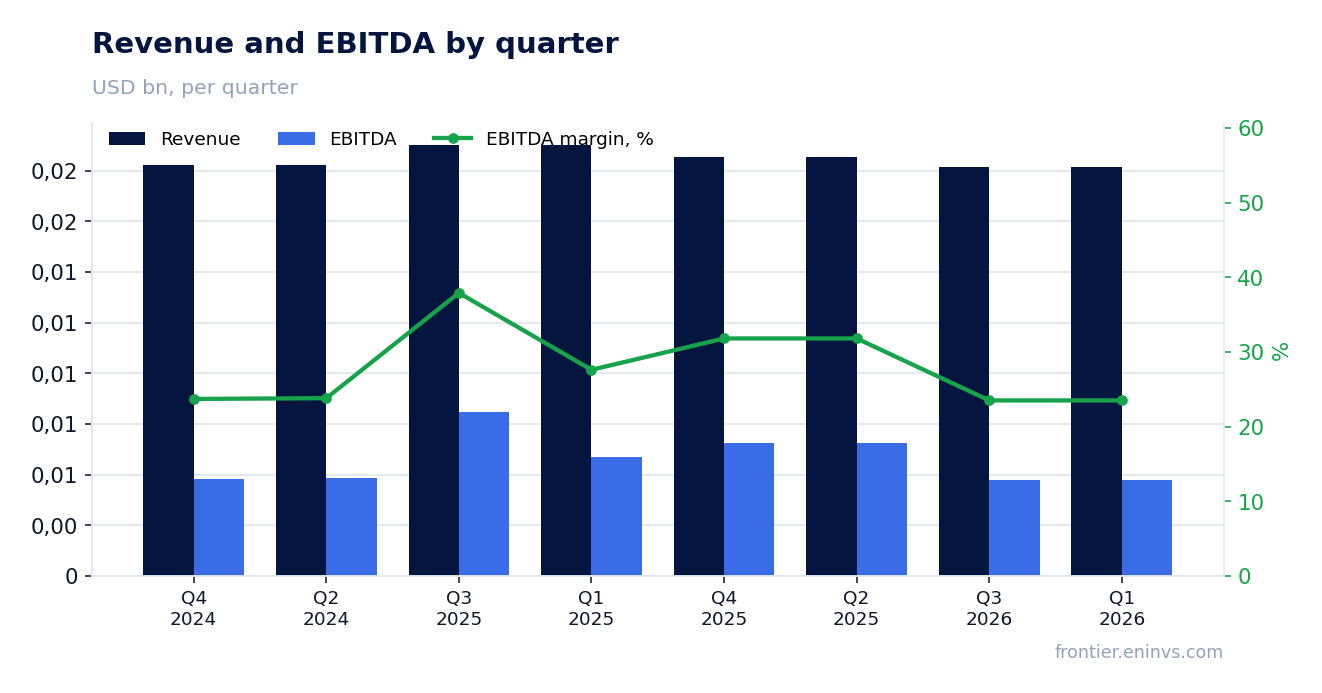
Revenue in the fiscal third quarter of 2026 was $20.2m against $22.6m a year earlier, a 10.6% decline. Production did not fall but edged up: 6,700 barrels of oil equivalent per day versus 6,667 a year earlier. The entire drop came from price: average realisations fell 11% to $33.45 per barrel of oil equivalent.
Within the price, gas differentials drove two-thirds of the decline. A warm winter on the West Coast crushed Jonah Field prices by $1.96 per thousand cubic feet, and Barnett lost another $0.90. Together they stripped about $3.39 per barrel of oil equivalent from revenue.
A further $1.2m of revenue was consumed by a one-time prior-period adjustment for transportation charges at Delhi Field: the operator changed its marketing contract in December 2024 and did not inform the company until this quarter. Without it, the revenue adjustment would have been noticeably milder. The company says it is reviewing alternative marketing options.
Volumes were supported by recent acquisitions — SCOOP/STACK in August 2025 and TexMex in April 2025. They offset losses from January ice storms that shut in several fields for days. By the company's estimate, weather and downtime removed more than 300 barrels of oil equivalent per day.
Of the $8.9m loss, $7.6m is an unrealised hedge mark-to-market, not cash losses
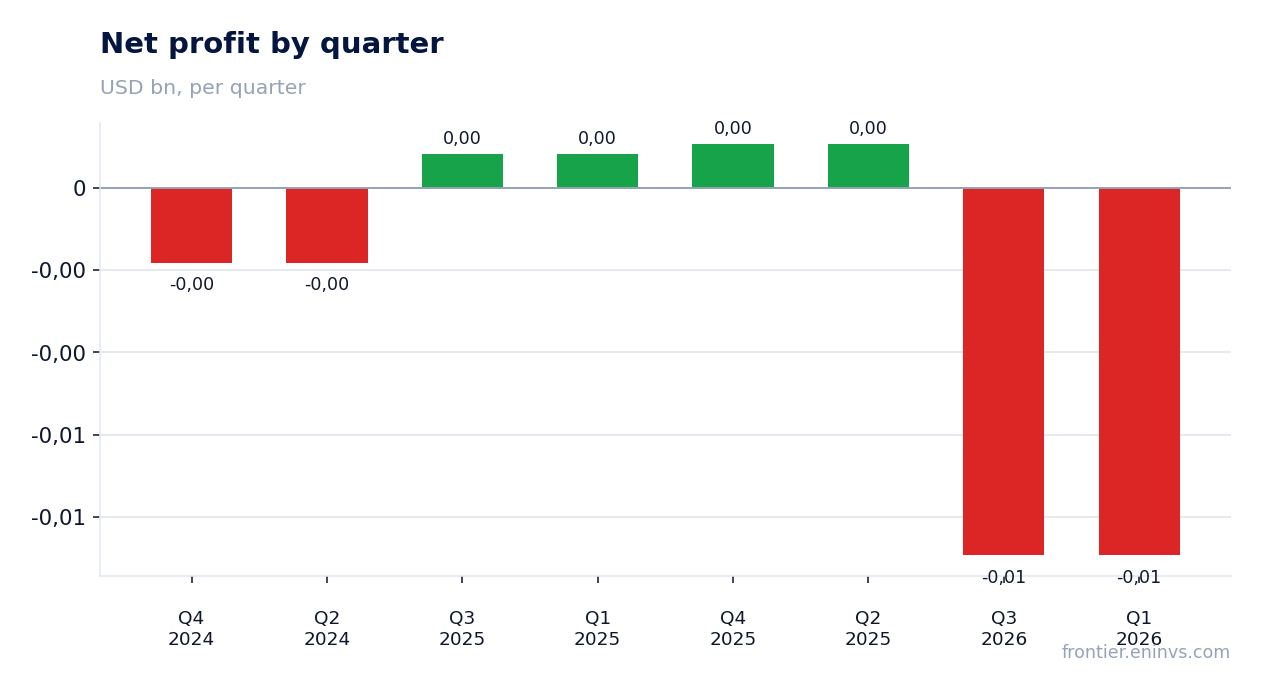
The net loss in the fiscal third quarter of 2026 was $8.9m against $2.2m a year earlier. The gap is almost entirely explained by an unrealised loss on derivative contracts of $7.6m. That is an accounting mark-to-market on future hedges extending into calendar 2027, not actual cash losses.
Excluding that mark, adjusted net loss was $2.9m against adjusted net income of $0.8m a year earlier. The difference is still material, but an order of magnitude smaller than the headline loss. Adjusted EBITDA was $3.1m against $7.4m a year earlier, a 58% decline.
Adjusted EBITDA also contains real cash losses: $2.2m of realised hedge losses. These are not marks but actual settlements on contracts the company signed at higher prices. Add $3.2m of unfavourable differentials, including the one-time Delhi adjustment.
Operating cash flow remained positive at $3.5m for the quarter. That matters: the business generates cash even while reporting a loss. But $3.5m does not cover $4.3m of dividends, $1.6m of capex, or $4.7m of acquisitions.
Adjusted EBITDA of $3.1m is four times below last year's $7.4m, hit by one-off charges and weak gas differentials
Adjusted EBITDA fell to $3.1m from $7.4m a year earlier. The 58% decline is not purely a price effect. Three one-off blows converged in the quarter: the $1.2m Delhi transportation adjustment, $2.2m of realised hedge losses, and abnormal gas differentials.
The reported-period EBITDA margin was 23.5% against 29.3% a year earlier. The 5.8 percentage point decline is a direct consequence of revenue falling faster than operating costs could be cut. Revenue dropped 10.6% while total operating costs fell only 1.2%, to $20.7m.
The company partially offset cost pressure. Lease operating costs declined to $13.0m from $13.4m a year earlier, helped by ceasing CO2 purchases at Delhi Field. Per barrel of oil equivalent, costs fell to $21.49 from $22.32. The new Oklahoma and Louisiana acquisitions carry no lifting costs, improving the structure.
General and administrative expenses stayed flat at $1.9m excluding stock-based compensation. Per barrel they even declined to $3.11 from $3.22. This shows the company controls fixed costs but cannot offset falling prices and one-off charges.
Debt at 1.62x LTM EBITDA with $56.5m borrowed and only $10.4m of liquidity leaves a thin cushion
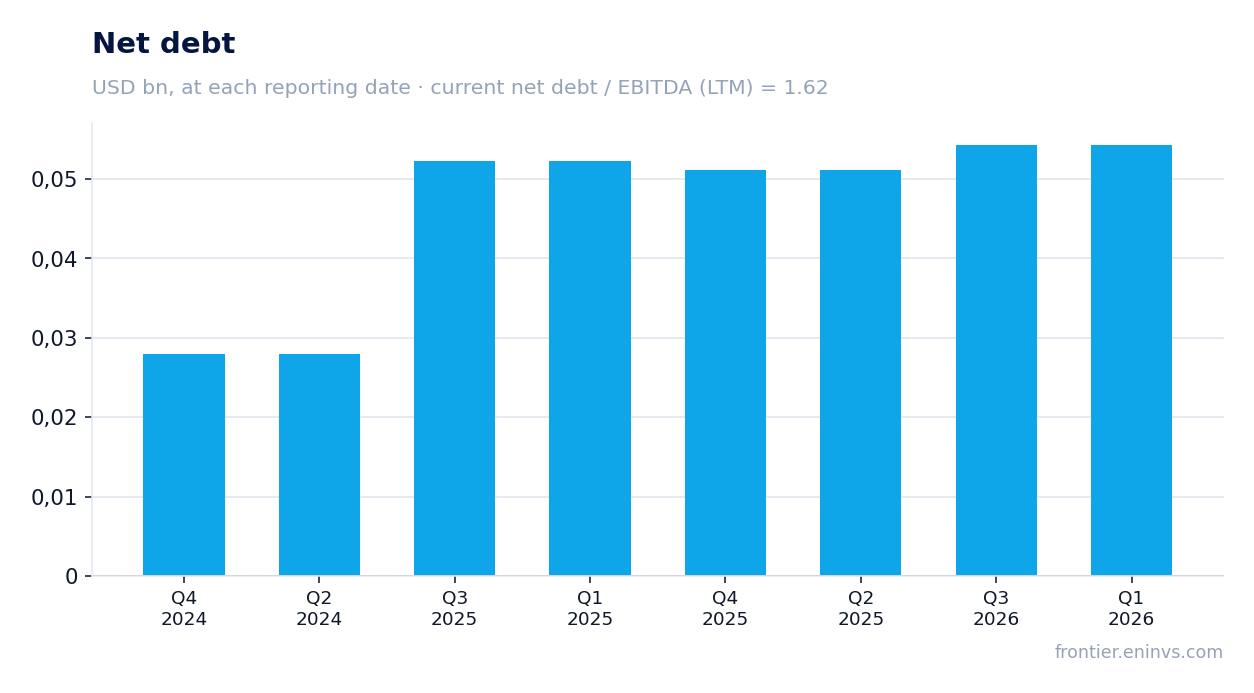
As of 31 March 2026, net debt stood at $35.1m and the ratio of net debt to trailing twelve-month EBITDA was 1.62. That is a moderate level in itself, but the cushion is limited: total borrowings under the credit facility are $56.5m, while available liquidity is only $10.4m, including $2.6m of cash and $7.7m of undrawn capacity.
During the quarter the company drew $2.0m of new borrowings and repaid nothing. The weighted average interest rate is 6.78%. Interest expense was $0.96m for the quarter, which at current EBITDA consumes a significant portion of operating profit. The annual cost of the facility exceeds the yield on many of the company's assets.
The company also raised $3.6m net from selling shares under its At-The-Market programme. That helped support liquidity but diluted shareholders: shares outstanding rose to 35.8m from 34.3m at the end of June 2025. Issuing equity below book value is not the cheapest form of financing.
Total assets rose to $169.8m, but shareholders' equity fell to $58.4m from $71.8m at the end of June 2025. The cause is losses and dividend payments that together exceeded the inflow from equity issuance. The balance sheet is getting thinner, which limits the ability to make further acquisitions without additional debt.
The $0.12 per share dividend has run for 51 consecutive quarters, but $4.3m of quarterly payouts exceed adjusted earnings
The board declared another quarterly dividend of $0.12 per share, payable on 30 June 2026. This is the 51st consecutive quarterly dividend since December 2013 and the 16th in a row at $0.12. In total the company has returned about $147.4m, or $4.41 per share, to shareholders.
At the current price of $4.78, the trailing twelve-month dividend yield is 13.0%. That is well above the policy rate and the yield of most energy companies. But the $4.3m quarterly payout exceeds adjusted EBITDA of $3.1m and adjusted net loss of $2.9m.
Our estimate: the $0.12 dividend will be maintained this year, as the company reaffirms its policy commitment and has access to the credit facility. However, the sustainability of the payout depends on a recovery in prices and volumes. If EBITDA stays at around $3m per quarter, the company will fund dividends from debt or asset sales.
What could reduce the payout: a further fall in gas prices, higher interest costs upon refinancing, or the need to direct more funds to capex. The company has already sold some non-core SCOOP/STACK assets for $3.3m after the reporting date, indicating a search for funding sources.
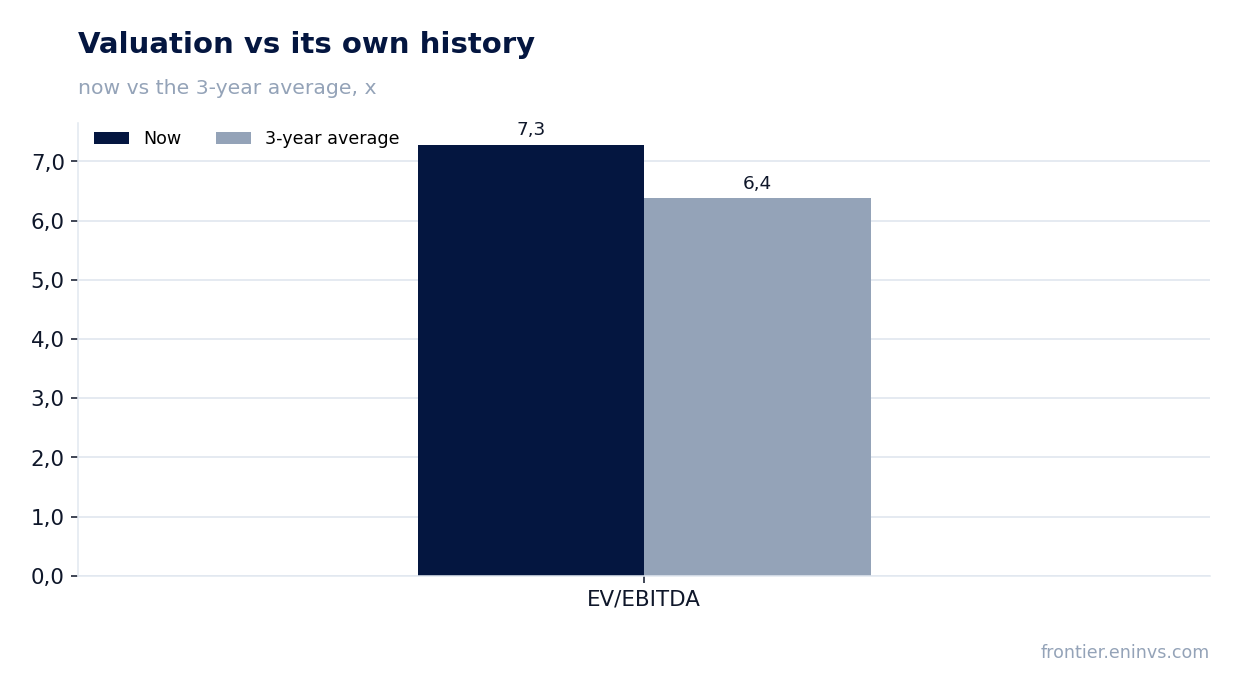
EV/EBITDA of 7.3 against its own three-year average of 6.4 means the market is paying up for a recovery not yet confirmed
The trailing twelve-month EV/EBITDA multiple is 7.3. The company's own three-year average is 6.4. The share trades above its historical norm despite falling revenue and a compressed margin. This means the market is already pricing in an earnings recovery that the report does not yet show.
The trailing twelve-month P/E is 83.5 — a nearly meaningless figure given net profit of $1.5m for the year. Return on equity is negative at -20.4%. The company is burning book value by paying out more in dividends than it earns.
Our portal model estimates fair value 15% below the current price. The model re-prices EBITDA at current commodity prices and a target EV/EBITDA. This is not a market consensus but our own estimate, and it points to limited upside.
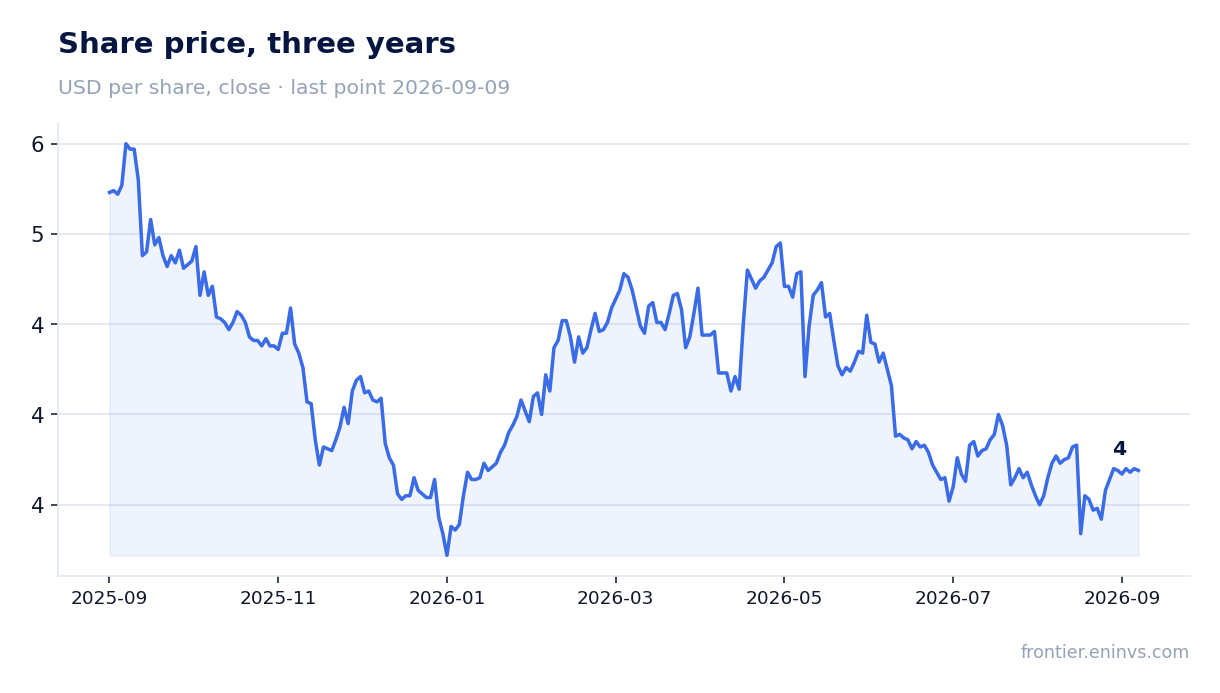
Since the report was published, the share has lost 22.8%. On the day of release it gained 0.2%, but a sell-off followed. The market realised that one-off factors will not vanish instantly, and debt at current EBITDA limits room for manoeuvre.
Valuation on the latest reported figures
| Metric | Value |
|---|---|
| Market cap | 0.12 bn USD |
| P/E (LTM) | 83.5 |
| EV/EBITDA (LTM) | 7.3 |
| P/B | 1.71 |
| Net debt / EBITDA (LTM) | 1.62 |
| Operating cash flow (LTM) | 0.03 bn |
| ROE | -20.4% |
| Dividend yield (12m) | 13.0% |
| EV/EBITDA, 3-year average | 6.4 |
Bottom line
The report's strengths are production growth to 6,700 barrels of oil equivalent per day and positive operating cash flow of $3.5m. The weaknesses are a 10.6% revenue decline on prices, an EBITDA margin compressed to 23.5%, and a loss only partly explained by one-off factors. The real question for a holder is whether the company can restore EBITDA to a level covering dividends and capex without further diluting shareholders. With a multiple above its own history and negative return on equity, the share looks rather unattractive until signs of a sustainable recovery appear.
Open the company's financial profile EPM →
See also: market overview · valuation map · stock screeners