Expand Energy: buybacks and debt redemption exceeded operating cash flow
28 июля Expand Energy раскрыла результаты за второй квартал 2026 года. Выручка упала на 19,8% год к году, до 2 960 млн долларов, EBITDA – на 29,5%, до 1 443 млн, чистая прибыль – на 46,1%, до 522 млн. На текущей цене акция выглядит скорее привлекательно: мультипликаторы ниже собственной истории, долговая нагрузка умеренная, а дивидендная доходность выше 2%, но модель портала оценивает потенциал роста всего в -1%.
Key takeaways
— Revenue in Q2 fell 19.8% YoY to $2,960 million, following natural gas prices
— EBITDA margin contracted from 55.2% to 48.5% due to lower realized prices and higher transportation costs
— Net income declined 46.1% to $522 million, but adjusted figures show a smaller drop
— Operating cash flow was $1,096 million, while share buybacks and debt redemption totaled $1,801 million
— The company announced the acquisition of Twin Eagle, creating North America's leading integrated natural gas company
— Quarterly dividend of $0.575 per share, annual yield around 2.4%
— Shares rose 6.8% after the release, but the portal's model sees only -1% upside
Attractiveness
Key figures, USD bn
| Metric | Q2 2025 | Q2 2026 | Change |
|---|---|---|---|
| Revenue | 3.69 | 2.96 | -19.8% |
| EBITDA | 2.04 | 1.44 | -29.5% |
| Operating profit | 1.27 | 0.72 | -43.2% |
| Net profit | 0.97 | 0.52 | -46.1% |
| Operating cash flow | 1.32 | 1.10 | -17.1% |
| Capex | 0.66 | 0.76 | +15.1% |
| EBITDA margin | 55.2% | 48.5% | -6.7 pp |
| Net margin | 26.2% | 17.6% | -8.6 pp |
Revenue in Q2 fell 19.8% YoY to $2,960 million, following natural gas prices
In Q2 2026, Expand Energy's revenue totaled $2,960 million, down 19.8% YoY. The main driver was lower natural gas prices: the average NYMEX price fell from $3.44 to $2.90 per Mcf, and the average realized price (including derivatives) declined from $3.14 to $3.12 per Mcfe. Production, however, increased from 7,202 to 7,482 MMcfe per day.
The revenue mix also changed: natural gas, oil and NGL sales fell from $2,021 to $1,830 million, and marketing revenue from $788 to $681 million. Derivative gains contributed positively at $449 million versus $877 million a year earlier, but that was not enough to offset lower prices.
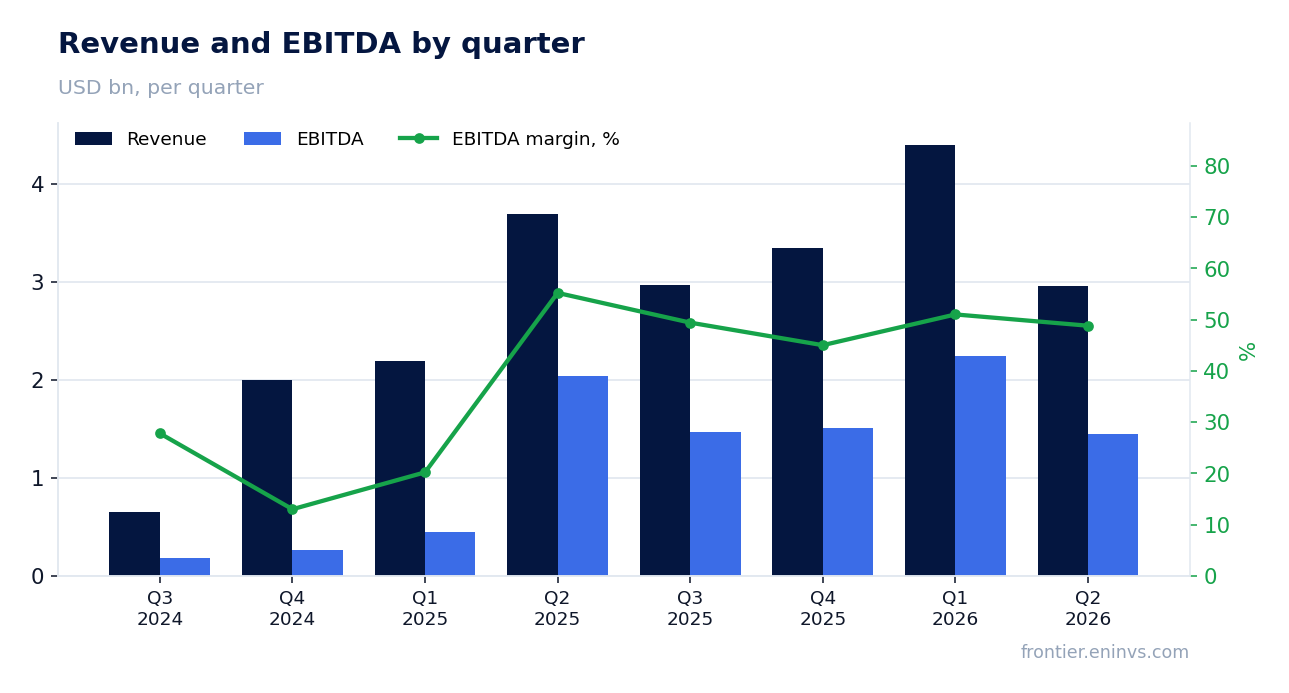
EBITDA margin contracted from 55.2% to 48.5% due to lower realized prices and higher transportation costs
EBITDA in Q2 2026 was $1,443 million versus $2,038 million a year earlier, with margin down from 55.2% to 48.5%. Pressure came not only from prices but also from operating costs: gathering, processing and transportation expenses rose from $563 to $634 million, and production costs from $151 to $168 million.
The margin contraction also reflects higher unit costs: while volumes grew 3.9%, transportation costs rose 12.6%. The company partially offset the effect by cutting marketing expenses (from $791 to $649 million) and G&A (from $40 to $50 million, but as a percentage of revenue they increased).
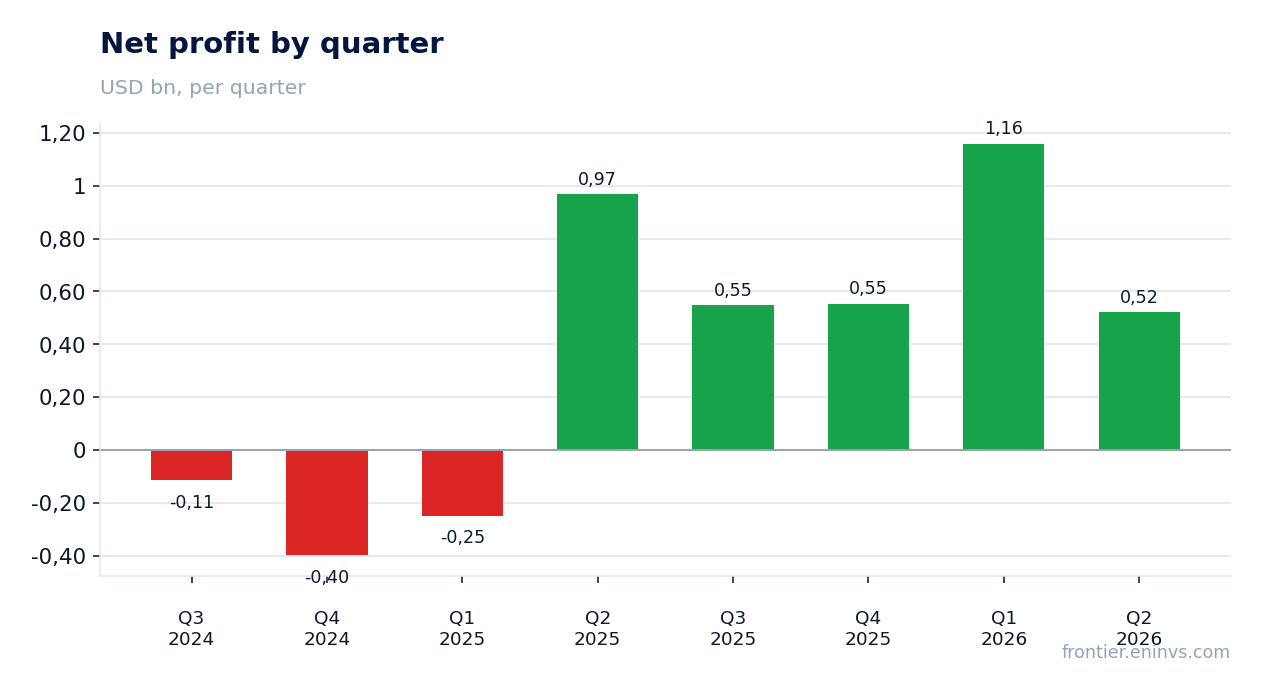
Net income declined 46.1% to $522 million, but adjusted figures show a smaller drop
Net income in Q2 2026 was $522 million versus $968 million a year earlier. Key drivers were lower operating income (from $1,269 to $721 million) and a higher effective tax rate: income tax expense fell from $260 to $150 million, but as a percentage of pre-tax income it rose from 21% to 22%.
Adjusted net income was $317 million, or $1.33 per share, versus $265 million and $1.10 a year earlier. The difference from GAAP net income is mainly due to unrealized derivative gains ($153 million) and gains on debt extinguishment ($37 million).
Operating cash flow was $1,096 million, while share buybacks and debt redemption totaled $1,801 million
In Q2 2026, operating cash flow was $1,096 million, down 17% YoY from $1,322 million. Capital expenditures rose from $657 to $756 million, so free cash flow fell from $665 to $343 million.
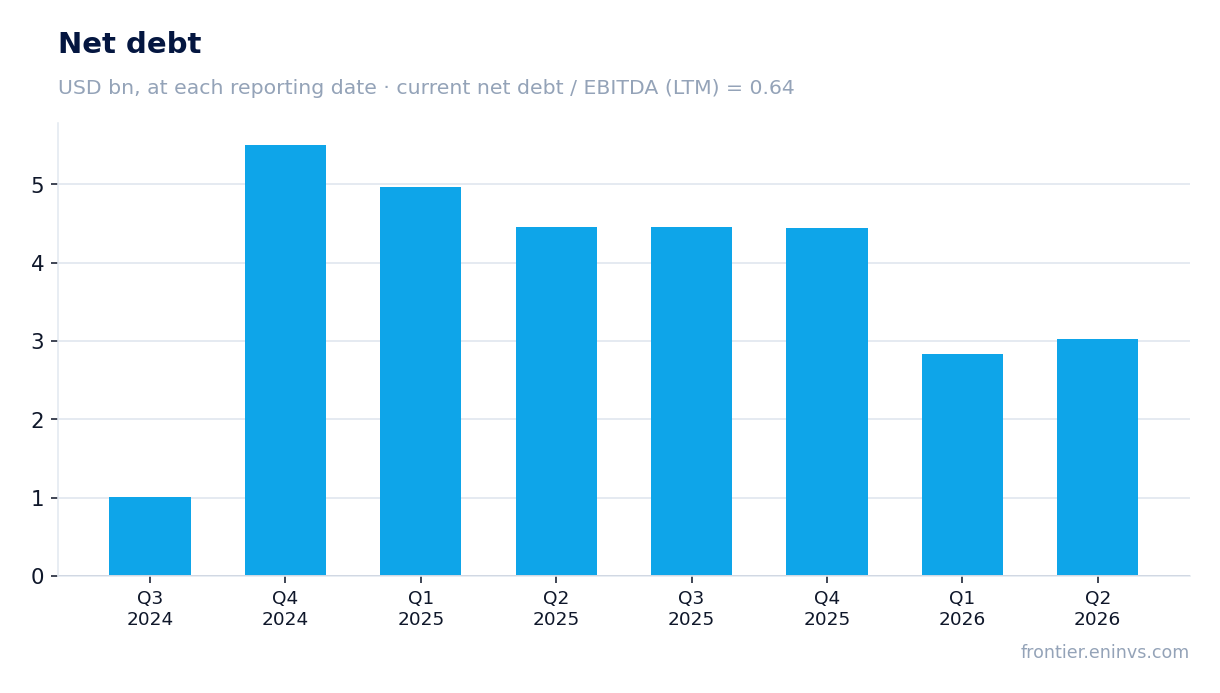
At the same time, the company spent $514 million on share repurchases and $1,287 million on debt redemption. Total outflows of $1,801 million exceeded operating cash flow by more than 1.6 times; the gap was covered by cash on hand and possibly new borrowings. As a result, net debt increased by $0.2 billion from the previous reporting date to $3,022 million, although it declined by $1.4 billion over the last 12 months.
The company also announced an additional $1 billion buyback authorization, which will increase cash flow pressure in coming quarters.
The company announced the acquisition of Twin Eagle, creating North America's leading integrated natural gas company
In its Q2 report, Expand Energy announced the acquisition of Twin Eagle Holdings. According to management, the deal 'immediately establishes Expand as the leading integrated natural gas company,' extends access to demand markets from coast to coast, and accelerates the company's strategy. Financial terms were not disclosed.
The acquisition adds uncertainty about future cash flow and debt levels, but could strengthen the marketing segment, which generated $681 million in revenue in Q2 against operating expenses of $649 million.
Quarterly dividend of $0.575 per share, annual yield around 2.4%
Expand Energy maintains a quarterly dividend of $0.575 per share. The next payment is September 3, 2026, to shareholders of record on August 13. Over the last 12 months, the dividend yield was 2.38% – notably higher than many sector peers, but below the current key rate.
Our estimated annual dividend per share is $2.30 (four quarterly payments of $0.575). At a share price of about $90.5, that implies a yield of 2.5%. The payout looks sustainable: quarterly free cash flow of $343 million covers dividend payments (roughly $138 million per quarter) more than twice over. The risk to the dividend is higher capex or large acquisitions, such as Twin Eagle, which could require capital reallocation.
Shares rose 6.8% after the release, but the portal's model sees only -1% upside
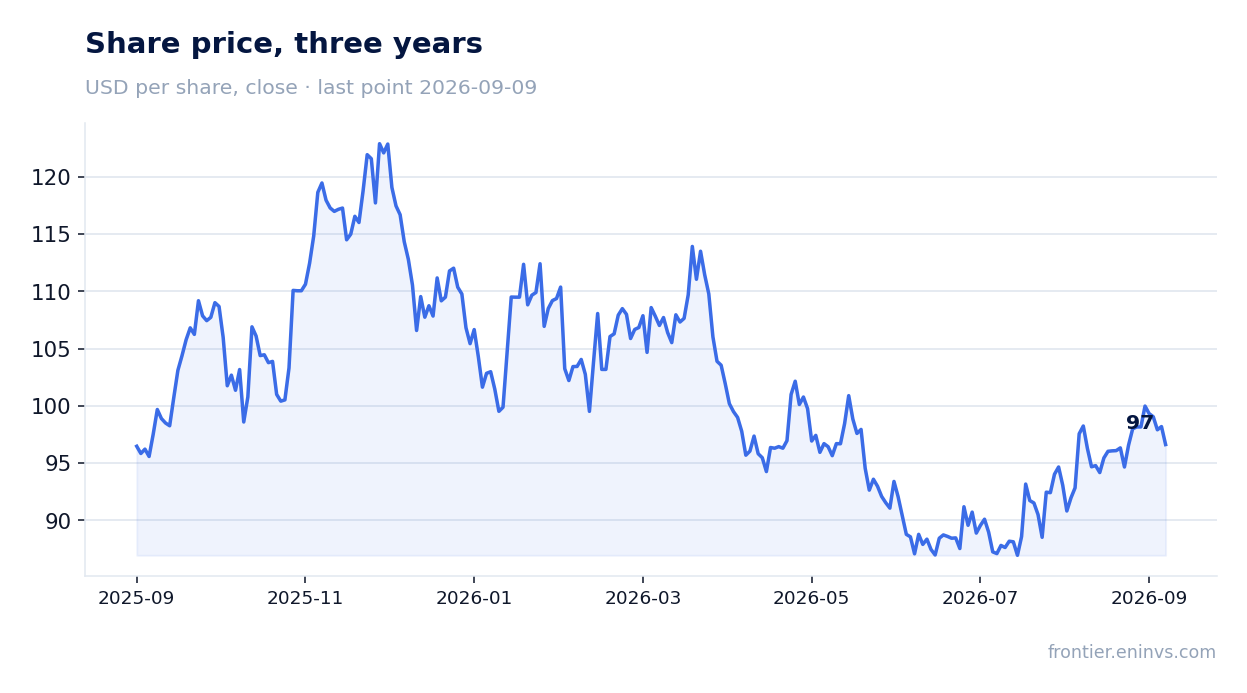
The share price before the release was $90.51; it fell 2.2% on the release day but rose 6.8% by September 9 relative to the post-release price. Current market cap is $23,116 million.
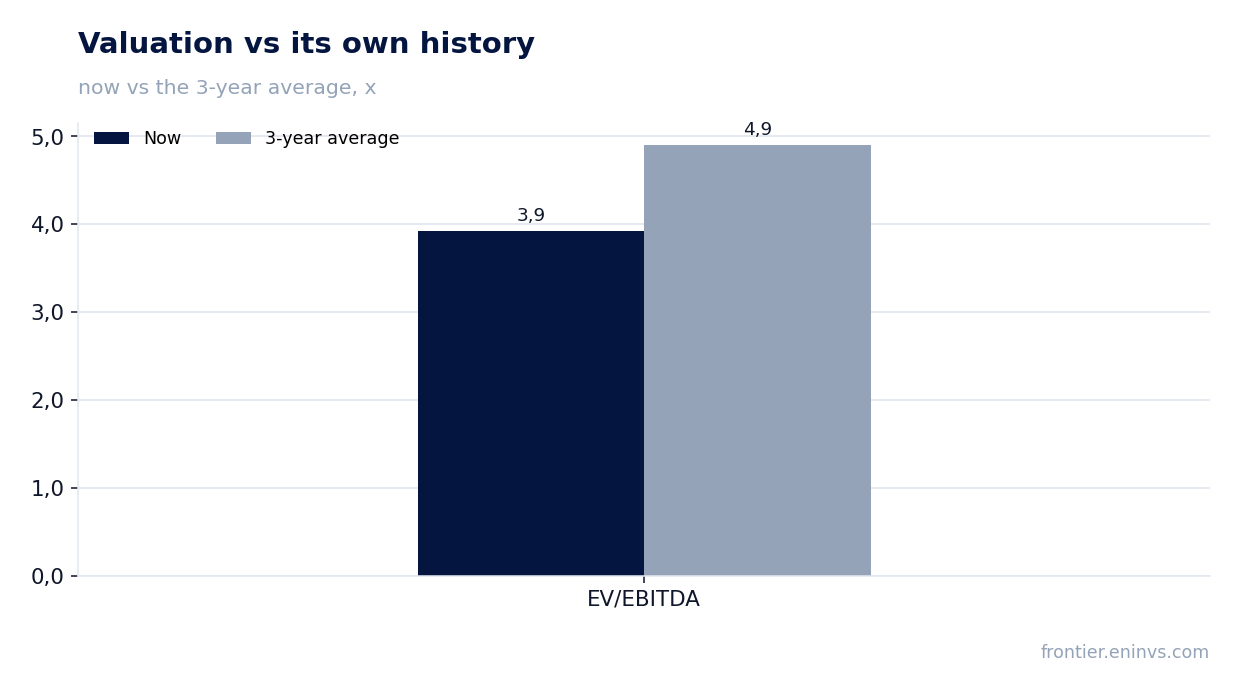
Valuation multiples look moderate: P/E LTM is 8.3, EV/EBITDA LTM is 3.9, below the three-year average of 4.9. Net debt at quarter-end was $4,492 million, with net debt / EBITDA LTM at 0.64 – a low level. However, the portal's model, which re-prices EBITDA at current gas prices and applies a target EV/EBITDA, shows only -1% upside to the current price. This suggests the market has already priced in the expected recovery in gas prices.
Valuation on the latest reported figures
| Metric | Value |
|---|---|
| Market cap | 23.1 bn USD |
| P/E (LTM) | 8.3 |
| EV/EBITDA (LTM) | 3.9 |
| P/B | 1.24 |
| Net debt / EBITDA (LTM) | 0.64 |
| Operating cash flow (LTM) | 4.60 bn |
| ROE | 10.7% |
| Dividend yield (12m) | 2.4% |
| EV/EBITDA, 3-year average | 4.9 |
Bottom line
In Q2, Expand Energy showed solid operational performance: production grew and adjusted EPS even increased thanks to cost control and debt extinguishment gains. However, free cash flow halved, and aggressive buybacks and debt redemption led to higher net debt. The dividend is covered by free cash flow, but the Twin Eagle acquisition and an additional $1 billion buyback will strain future cash flows. At the current price, the stock trades below its own history on EV/EBITDA, but the portal's model sees no upside, making the verdict 'rather attractive' with a caveat about dependence on gas prices.
Open the company's financial profile EXE →
See also: market overview · valuation map · stock screeners