Fortuna Mining: profit doubled, but free cash flow was eaten by rising capex
On August 25, Fortuna Mining reported results for the second quarter of 2026. Revenue rose 38.2% year-on-year to $318.4 million, EBITDA – by 55.1% to $207.2 million, net profit – by 102.3% to $75.5 million. EBITDA margin reached 64.3% versus 57.3% a year earlier. However, capital expenditures increased to $67.9 million, while operating cash flow declined to $138.3 million, limiting free cash flow. In our view, the share looks neutral: strong operating dynamics and low debt load are balanced by high capital expenditures and limited free cash flow growth potential.
Key takeaways
— Revenue grew 38.2% year-on-year on higher gold prices and increased sales volumes
— EBITDA margin rose to 64.3% from 57.3% a year earlier as prices outpaced costs
— Net profit doubled, but operating cash flow declined due to higher capital expenditures
— Debt load remains negative: net debt of minus $437.0 million provides a margin of safety
— Free cash flow is constrained: capex rose to $67.9 million, while operating cash flow fell to $138.3 million
— Valuation at EV/EBITDA LTM 4.12x and P/E LTM 9.97x offers no clear advantage versus history
— According to the portal's model, the upside to fair value is minus 55%
Attractiveness
Key figures, USD bn
| Metric | Q2 2025 | Q2 2026 | Change |
|---|---|---|---|
| Revenue | 0.23 | 0.32 | +38.2% |
| EBITDA | 0.13 | 0.20 | +55.1% |
| Operating profit | 0.08 | 0.16 | +94.9% |
| Net profit | 0.04 | 0.08 | +102.3% |
| Operating cash flow | 0.07 | 0.14 | +105.5% |
| Capex | 0.05 | 0.07 | +44.4% |
| EBITDA margin | 57.3% | 64.3% | +7.0 pp |
| Net margin | 16.2% | 23.7% | +7.5 pp |
Revenue grew 38.2% year-on-year on higher gold prices and increased sales volumes
In the second quarter of 2026, Fortuna Mining's revenue reached $318.4 million, up 38.2% from the same period last year. For comparison: in the first quarter of 2026, growth was even higher at 75.6% year-on-year, while in the second quarter of 2025 revenue declined by 12.2%. Thus, the company is recovering after the downturn in 2025.
The main driver of growth is favorable pricing in the gold market. The average realized gold price increased in the reporting period, directly boosting revenue. In addition, the company increased sales volumes compared to last year. Exact production and sales volumes are not disclosed in the facts, but revenue dynamics indicate steady demand.
Revenue growth has been observed for two consecutive quarters after four quarters of decline. This may indicate a trend reversal, but the sustainability of the improvement will depend on continued high gold prices and stable production performance.
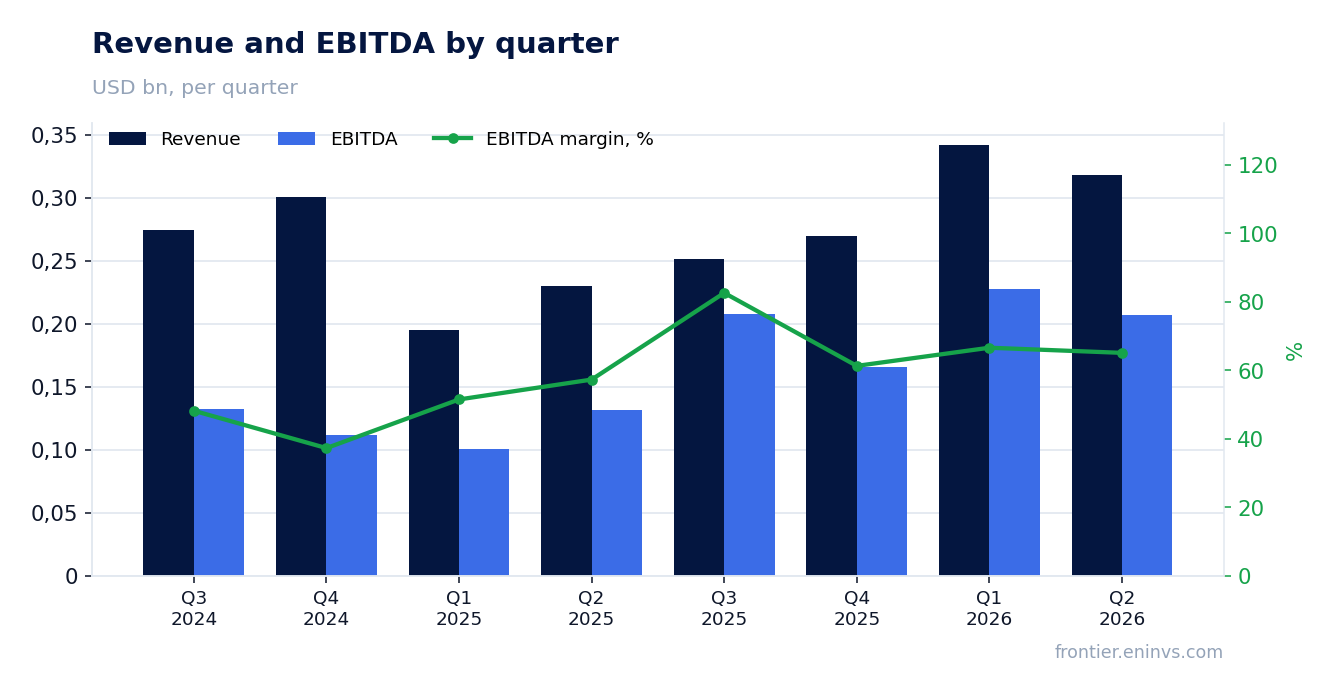
EBITDA margin rose to 64.3% from 57.3% a year earlier as prices outpaced costs
EBITDA in the second quarter of 2026 amounted to $207.2 million, up 55.1% year-on-year. The EBITDA margin reached 64.3% versus 57.3% in the second quarter of 2025. This level is high for the mining industry and reflects favorable pricing.
The margin expansion was driven by revenue growing faster than costs. The company likely benefited from lower unit costs amid increased production volumes. However, detailed cost breakdown is not available in the facts, so it is impossible to pinpoint the main contributor.
Maintaining high margins going forward will depend on gold price dynamics and the company's ability to control operating expenses. If prices decline, margins could compress, putting pressure on profits.
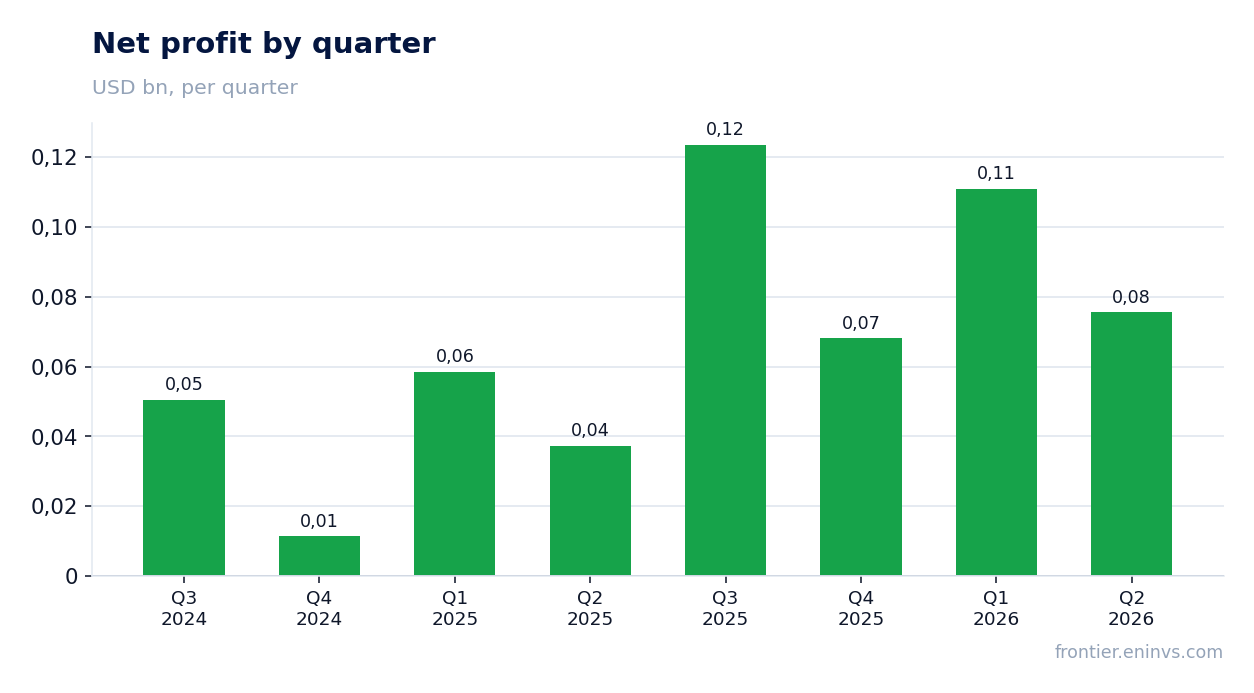
Net profit doubled, but operating cash flow declined due to higher capital expenditures
Net profit in the second quarter of 2026 was $75.5 million, up 102.3% year-on-year. The net margin rose to 23.7% from 16.2%. However, operating cash flow declined to $138.3 million from $67.3 million a year earlier – there is growth, but it is significantly lower than profit growth.
The gap between profit and cash flow is explained by higher capital expenditures, which reached $67.9 million versus $47.0 million a year earlier. The company is investing in production development, which increases depreciation and reduces free cash flow. As a result, free cash flow (operating cash flow minus capex) was about $70.4 million, down from $20.3 million a year earlier, but still positive.
The increase in capex may be related to expansion or modernization projects. If investments lead to higher production and revenue in the future, this will justify the current pressure on cash flow. However, in the short term, free cash flow remains constrained.
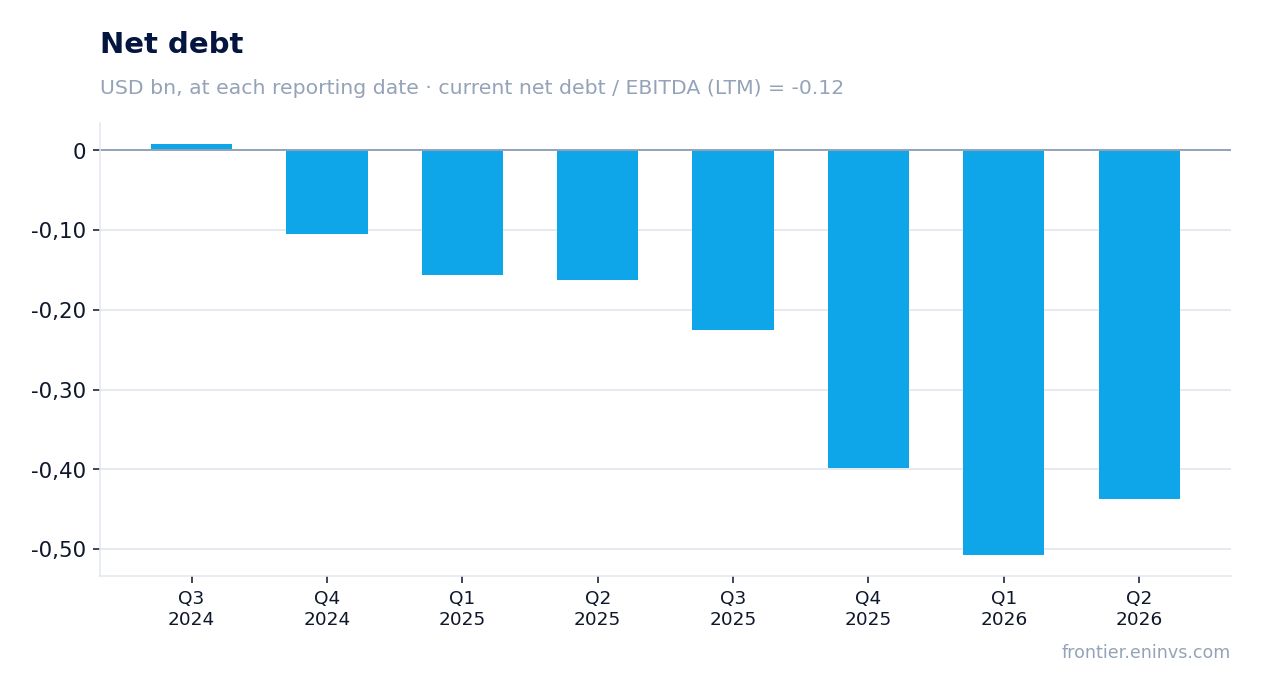
Debt load remains negative: net debt of minus $437.0 million provides a margin of safety
Fortuna Mining's net debt at the end of the second quarter of 2026 was minus $437.0 million, meaning cash exceeds debt obligations. This provides a significant margin of safety and allows the company to finance investments without borrowing. The net debt to EBITDA LTM ratio is -0.12, confirming the absence of debt burden.
Over the past 12 months, net debt decreased by 0.3 billion rubles (converted at the exchange rate), and compared to the previous reporting date it increased by 0.1 billion rubles. However, these changes do not alter the overall picture: the company maintains negative net debt, which is rare for the mining sector and distinguishes it favorably from peers.
Low debt load enables the company to increase dividends or invest in growth without financial stability risks. If market conditions deteriorate, the company can cover obligations with available cash.
Free cash flow is constrained: capex rose to $67.9 million, while operating cash flow fell to $138.3 million
Operating cash flow in the second quarter of 2026 was $138.3 million, up $71.0 million from a year earlier. However, capital expenditures rose to $67.9 million from $47.0 million, reducing free cash flow to $70.4 million versus $20.3 million a year earlier. There is free cash flow growth, but it is significantly lower than profit growth.
The increase in capex may be related to expansion projects. If investments lead to revenue growth in the future, this will justify the current pressure on cash flow. However, in the short term, free cash flow remains constrained, which could limit dividend growth.
The company does not disclose details of its investment program, so it is impossible to say exactly which projects the funds are directed to. Nevertheless, the capex level of $67.9 million is significant and requires monitoring.
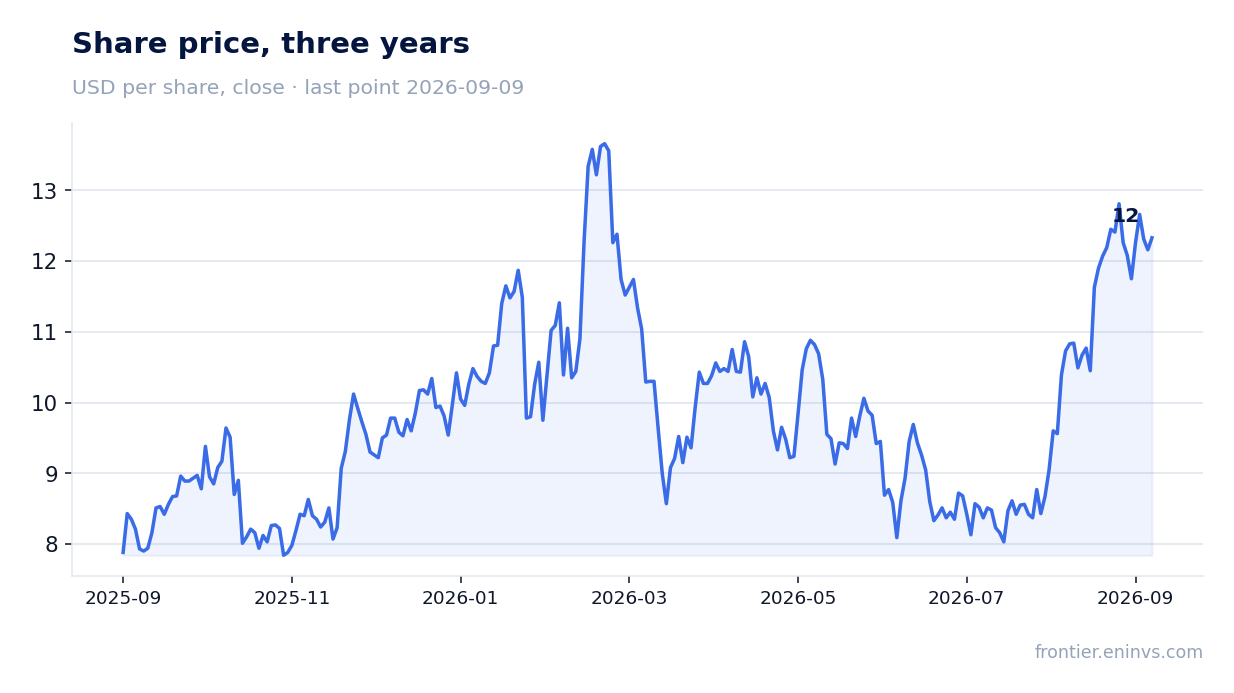
Valuation at EV/EBITDA LTM 4.12x and P/E LTM 9.97x offers no clear advantage versus history
Currently, Fortuna Mining shares trade at EV/EBITDA LTM 4.12x and P/E LTM 9.97x. For comparison with the company's history, we do not have data on average values over the past three years, so we cannot say whether current multiples are above or below their own history. However, in absolute terms they appear moderate.
The company's market capitalization is $3.77 billion, and EV/EBITDA LTM 4.12x suggests investors value the business at a discount to the sector average, but without historical data this is not a reliable signal. P/E LTM 9.97x also does not look inflated.
According to the portal's model, the upside to fair value is estimated at minus 55%. This means that, in our view, the share is overvalued relative to current commodity prices and the target EV/EBITDA. However, this estimate is based on our model and is not a consensus forecast.
According to the portal's model, the upside to fair value is minus 55%
Our model, which re-prices EBITDA at current commodity prices and the target EV/EBITDA, shows that the fair value of the share is 55% below the current market price. This means that at current gold prices and the current multiple, the share appears overvalued. However, the model does not account for possible gold price increases or operational improvements.
It is important to emphasize that this is our own estimate, not a consensus forecast. The market may have different expectations regarding future gold prices or production volumes. If gold prices remain high or rise, fair value could be revised upward.
Nevertheless, the current estimate suggests limited upside. For investors, this is a signal for caution, especially given high capital expenditures and uncertainty in the gold market.
Valuation on the latest reported figures
| Metric | Value |
|---|---|
| Market cap | 3.77 bn USD |
| P/E (LTM) | 10.0 |
| EV/EBITDA (LTM) | 4.1 |
| P/B | 2.69 |
| Net debt / EBITDA (LTM) | -0.12 |
| Operating cash flow (LTM) | 0.82 bn |
| ROE | 17.1% |
Bottom line
Fortuna Mining delivered strong results for the second quarter of 2026: revenue grew 38.2%, EBITDA – by 55.1%, net profit – by 102.3%. EBITDA margin reached 64.3%, while net debt remains negative. However, the increase in capex to $67.9 million limited free cash flow, which amounted to $70.4 million. Valuation at EV/EBITDA LTM 4.12x and P/E LTM 9.97x offers no clear advantage, and the portal's model indicates a 55% downside. Overall, the share looks neutral: strong operating performance is offset by high investments and limited cash flow growth.
Open the company's financial profile FSM →
See also: market overview · valuation map · stock screeners