Gold Resource Corporation: quarterly revenue up 88%, but a $6.1m loss wiped out the entire operating result
Gold Resource Corporation reported second-quarter 2026 results. Revenue rose 88.0% year on year to $21.1m, EBITDA came in at $3.0m, and net profit was negative at –$6.1m. The EBITDA margin reached 14.1% versus –79.2% a year earlier, but the loss and a return on equity of –112.7% keep the stock from looking attractive at the current price.
Key takeaways
— Second-quarter revenue rose 88.0% year on year to $21.1m, but that is half the level of the first quarter
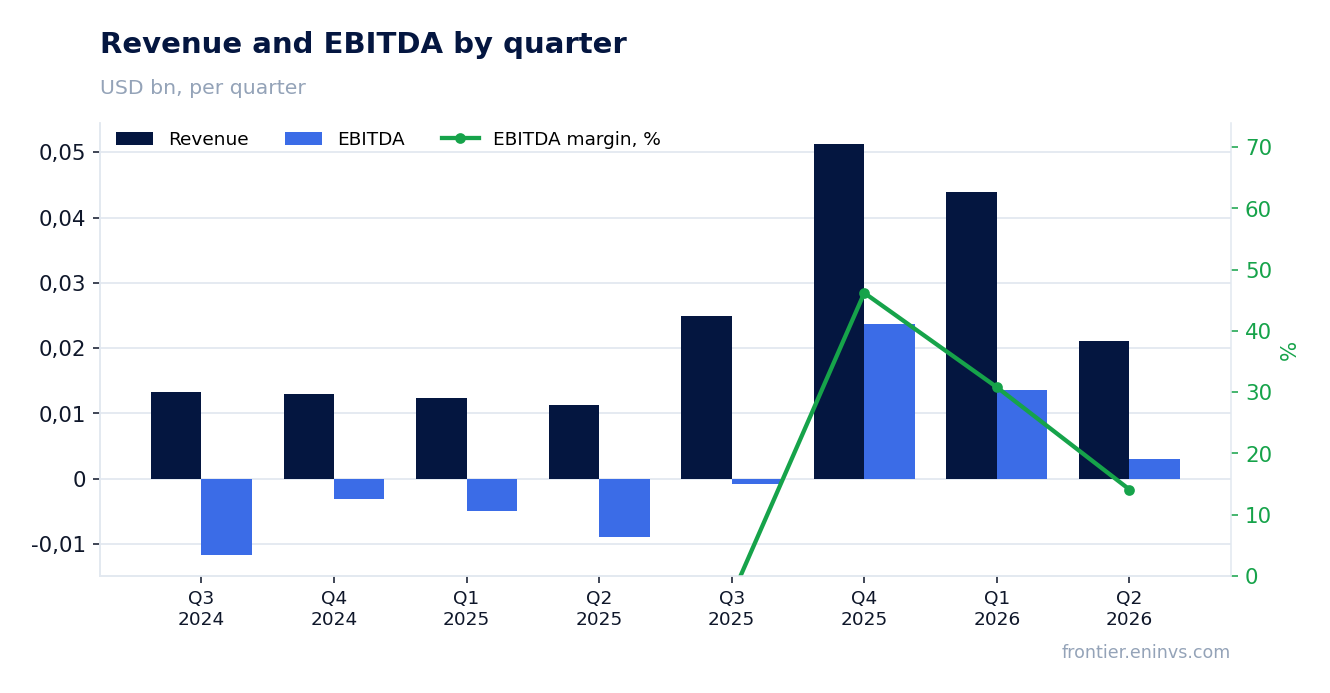
— Q2 EBITDA was $3.0m, with a 14.1% margin versus –79.2% a year earlier
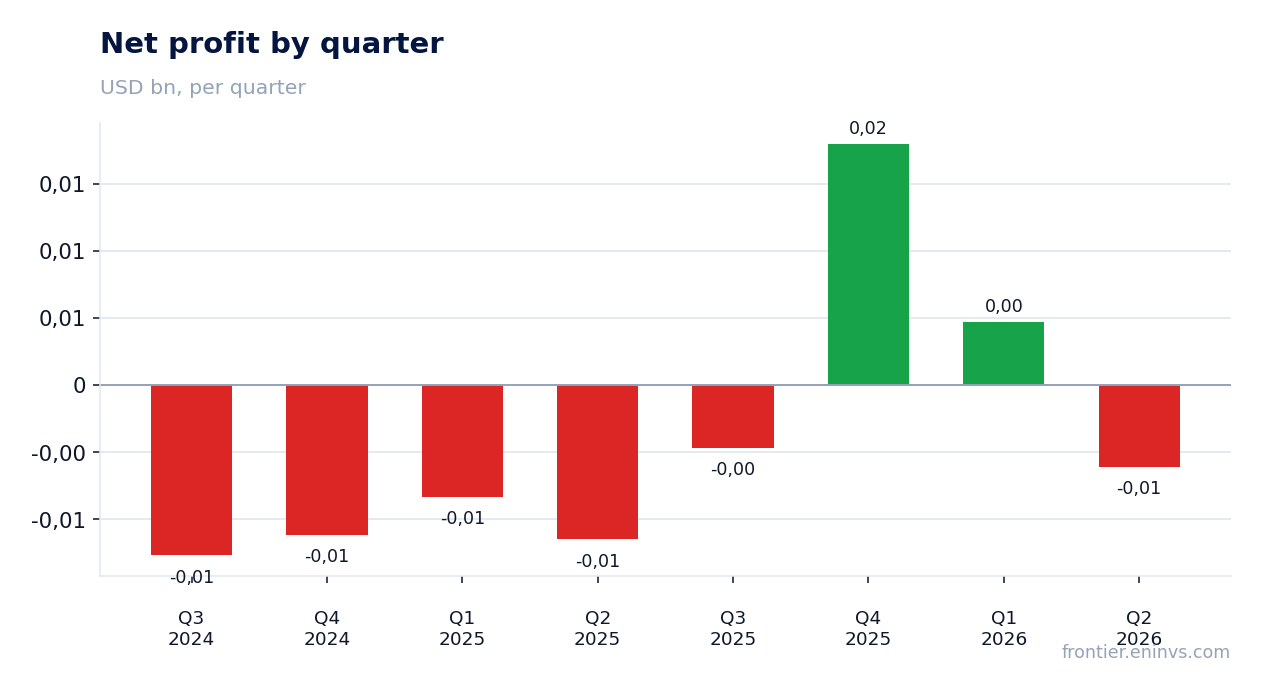
— A $6.1m net loss against $2.6m of operating profit means non-operating items, not operating costs, drove the loss
— Operating cash flow remains positive at $1.4m, but capital expenditure almost exhausted it
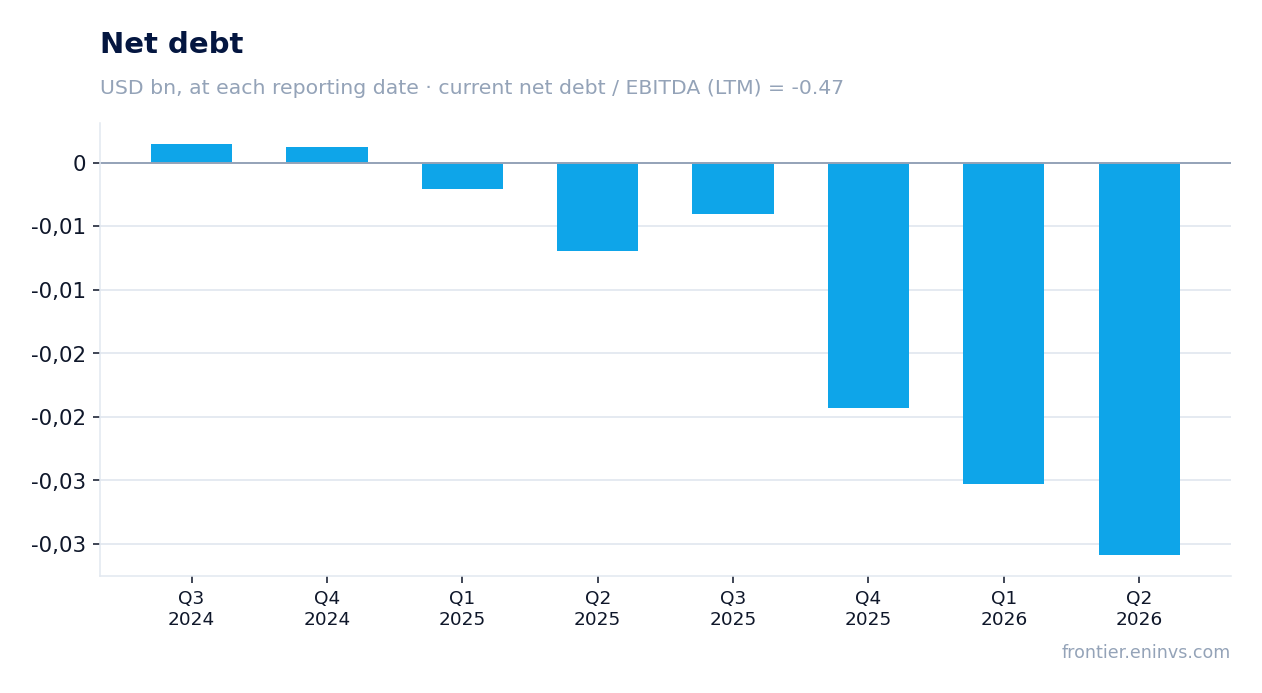
— Net debt is negative at –$30.9m, the only stable support in the accounts
— Over the last twelve months the company earned $12.0m of net profit on $141.2m of revenue, and the market values it at 5.9 EV/EBITDA
— The portal's model implies 6% downside to the current price, meaning the stock trades above its fair value
Attractiveness
Key figures, USD bn
| Metric | Q2 2025 | Q2 2026 | Change |
|---|---|---|---|
| Revenue | 0.01 | 0.02 | +88.0% |
| EBITDA | -0.01 | 0.00 | to profit |
| Operating profit | -0.01 | 0.00 | to profit |
| Net profit | -0.01 | -0.01 | — |
| Operating cash flow | -0.00 | 0.00 | to profit |
| Capex | 0.00 | 0.00 | -50.7% |
| EBITDA margin | -79.2% | 14.1% | +93.3 pp |
| Net margin | -102.3% | -28.8% | +73.5 pp |
Second-quarter revenue rose 88.0% year on year to $21.1m, but that is half the level of the first quarter
In the second quarter of 2026, revenue reached $21.1m, up 88.0% from the same quarter a year earlier. The year-on-year growth looks impressive, but it mainly reflects a low base: in Q2 2025 revenue was only $11.2m.
The sequential picture is worse: in Q1 2026 revenue reached $43.9m, meaning it more than halved quarter on quarter. This suggests that high gold and silver prices, which supported the start of the year, had a smaller effect in Q2, or sales volumes declined.
For scale: over the last twelve months revenue totalled $141.2m. That is well above the levels of previous periods when the company posted losses, but still short of what is needed for sustainable profit.
Q2 EBITDA was $3.0m, with a 14.1% margin versus –79.2% a year earlier
EBITDA in Q2 2026 was $3.0m, with a margin of 14.1%. A year earlier EBITDA was negative at –$8.9m, with a margin of –79.2%. The swing into positive territory is the main positive of the report.
Operating profit was also positive at $2.6m, against a loss of $11.5m a year earlier. This means the core business became profitable at the operating level.
However, a 14.1% margin is still low for a gold miner, and it is well below the first quarter of 2026, when EBITDA was $13.5m on revenue of $43.9m. The quarter-on-quarter margin decline needs an explanation that the report does not provide.
A $6.1m net loss against $2.6m of operating profit means non-operating items, not operating costs, drove the loss
The net loss in Q2 2026 was $6.1m against an operating profit of $2.6m. The $8.7m gap between operating and net results points to significant non-operating expenses – likely interest, taxes, or one-off write-offs.
For comparison: a year earlier the net loss was $11.5m, so the loss narrowed, but it remains substantial. The net margin in Q2 2026 was –28.8% versus –102.3% a year earlier.
Over the last twelve months, net profit was $12.0m, suggesting the company can generate profit in certain periods. However, the quarterly loss shows that the sustainability of that result is in question.
Operating cash flow remains positive at $1.4m, but capital expenditure almost exhausted it
In Q2 2026, operating cash flow was $1.4m, while capital expenditure was $1.3m. As a result, free cash flow was close to zero, and the company did not accumulate a significant cash buffer.
Over the last twelve months, operating cash flow totalled $21.7m. That is well above previous periods when the flow was negative, indicating improved cash generation.
However, capital expenditure remains significant: in Q4 2025 it reached $8.9m, and in Q3 2025 it was $7.5m. The company continues to invest, which limits free cash.
Net debt is negative at –$30.9m, the only stable support in the accounts
At the end of Q2 2026, the company's net debt was negative at –$30.9m. This means cash and equivalents exceed debt obligations, and the company has a net cash position.
The net debt to EBITDA ratio over the last twelve months is –0.47. The negative value confirms the absence of debt burden, and the company does not depend on borrowed funds.
This is an important stability factor: even with a quarterly loss, the company faces no debt pressure. However, negative net debt alone does not generate profit, and without operational improvement it only buys time.
Over the last twelve months the company earned $12.0m of net profit on $141.2m of revenue, and the market values it at 5.9 EV/EBITDA
Over the last twelve months, revenue was $141.2m, EBITDA was $41.4m, and net profit was $12.0m. These figures cover the period from Q3 2024 to Q2 2026 and reflect a significant improvement over previous periods.
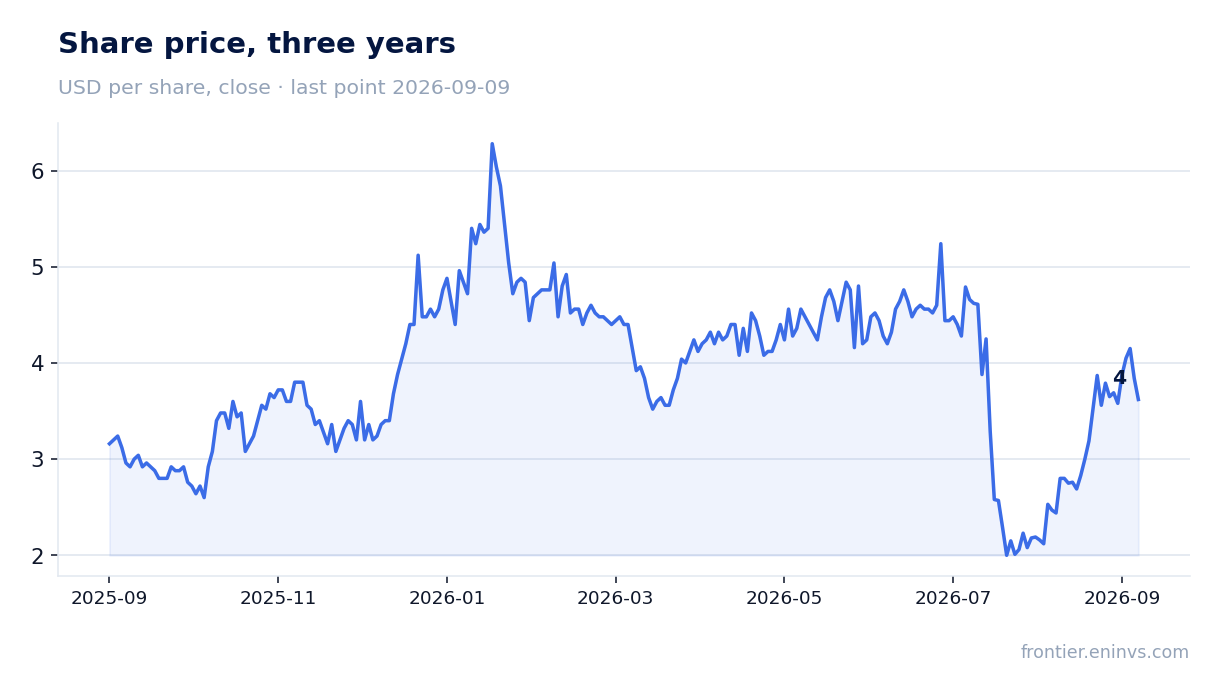
The company's market capitalisation is $264.7m, and the EV/EBITDA for the last twelve months is 5.9. This is a moderate valuation, but it does not account for the volatility of quarterly results.
The price-to-earnings ratio for the last twelve months is 22.1. With net profit of $12.0m and a market capitalisation of $264.7m, this means the market values the company fairly highly relative to its current profit.
The portal's model implies 6% downside to the current price, meaning the stock trades above its fair value
According to the portal's model, which reprices EBITDA at current commodity prices and a target EV/EBITDA, the fair value of the share is 6% below the current price. This means the market has already priced in a significant portion of the expected improvement.
The model is not a market consensus or a target price – it is our own calculation. It shows that at current gold and silver prices and the current debt level, the stock does not look undervalued.
For the company's value to rise, either metal prices need to increase further, or costs need to fall sustainably, lifting EBITDA above the current level.
Valuation on the latest reported figures
| Metric | Value |
|---|---|
| Market cap | 0.26 bn USD |
| P/E (LTM) | 22.1 |
| EV/EBITDA (LTM) | 5.9 |
| P/B | 6.01 |
| Net debt / EBITDA (LTM) | -0.47 |
| Operating cash flow (LTM) | 0.02 bn |
| ROE | -112.7% |
Bottom line
In Q2 2026, Gold Resource Corporation showed 88.0% year-on-year revenue growth and positive EBITDA of $3.0m, but a $6.1m net loss and a return on equity of –112.7% outweigh these improvements. The company maintains a net cash position of $30.9m, which provides a cushion, but operating profit is too small to cover non-operating expenses. The valuation at 5.9 EV/EBITDA and 22.1 P/E for the last twelve months does not look cheap given quarterly volatility, and the portal's model implies 6% downside. At the current price, the stock is not attractive for an investor focused on sustainable profit and dividends.
Open the company's financial profile GORO →
See also: market overview · valuation map · stock screeners