GeoPark: revenue up 54% but EBITDA halved as margin collapsed from 60.2% to 21.1%
On 26 August GeoPark reported second-quarter 2026 results. Revenue rose 54.0% year on year to $184.5m, but EBITDA fell 46.0% to $84.0m and the EBITDA margin compressed from 60.2% to 21.1%. Net profit was $14.0m against a $10.3m loss a year earlier, with operating cash flow of $108.4m. In our view the share looks unattractive: the EV/EBITDA multiple of 3.21x is above its own three-year average of 2.59x, and the portal's model implies 59% downside to fair value.
Key takeaways
— Revenue rose 54.0% year on year to $184.5m, but EBITDA fell 46.0% to $84.0m — top-line growth did not convert into profit
— EBITDA margin compressed from 60.2% to 21.1% — the revenue increase cost more than it brought in
— Net profit of $14.0m against a $10.3m loss a year earlier — a turnaround, but profit is thin relative to revenue
— Operating cash flow of $108.4m is strong, but capital expenditure for Q2 is not disclosed
— Net debt of $479.2m with a net debt/EBITDA of 1.41x on LTM basis — moderate leverage, but absolute debt rose
— EV/EBITDA of 3.21x versus its own three-year average of 2.59x — the stock trades above its history
— The portal's model implies 59% downside to fair value at current commodity prices
Attractiveness
Key figures, USD bn
| Metric | Q2 2025 | Q2 2026 | Change |
|---|---|---|---|
| Revenue | 0.12 | 0.18 | +54.0% |
| EBITDA | 0.07 | 0.04 | -46.0% |
| Operating profit | 0.04 | 0.08 | +101.1% |
| Net profit | -0.01 | 0.01 | to profit |
| Operating cash flow | -0.01 | 0.11 | to profit |
| Capex | 0.02 | — | — |
| EBITDA margin | 60.2% | 21.1% | -39.1 pp |
| Net margin | -8.6% | 7.6% | +16.2 pp |
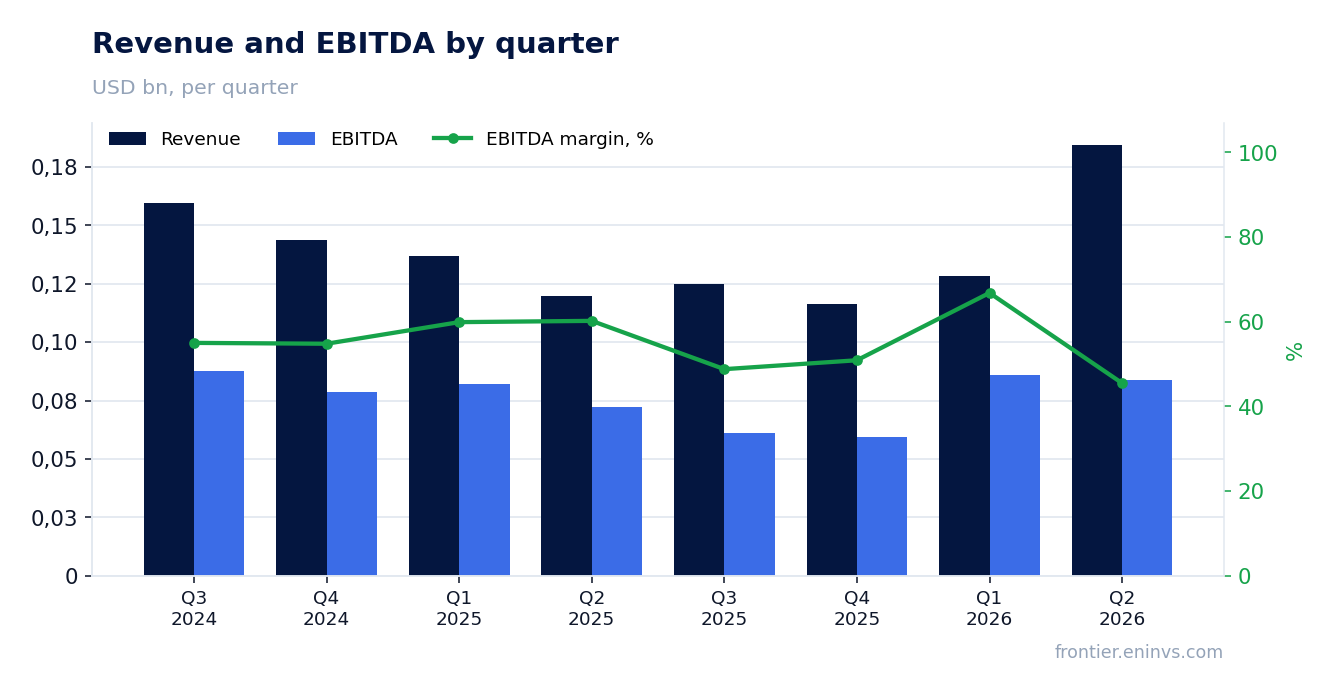
Revenue rose 54.0% year on year to $184.5m, but EBITDA fell 46.0% to $84.0m — top-line growth did not convert into profit
In Q2 2026 GeoPark's revenue reached $184.5m, up 54.0% year on year. This is the highest quarterly figure in at least five quarters: Q1 2026 revenue was $128.4m, Q4 2025 was $116.5m. Year-on-year growth accelerated after several quarters of decline: in Q1 2026 revenue fell 6.3%, in Q2 2025 it fell 37.0%.
However, EBITDA for the same period fell 46.0% to $84.0m. This means revenue growth was not accompanied by improved profitability: operating costs or cost of sales grew faster than turnover. In Q1 2026 EBITDA was $85.7m, so in Q2 it even declined slightly despite revenue rising by $56.1m.
The gap between revenue and EBITDA dynamics suggests that the main contribution to turnover growth came not from organic production growth but from other factors — possibly one-off sales or changes in sales mix. Without these details in the report, we record the fact: revenue grew, but operating profit shrank.
EBITDA margin compressed from 60.2% to 21.1% — the revenue increase cost more than it brought in
The EBITDA margin in Q2 2026 was 21.1% against 60.2% a year earlier. The 39.1 percentage point decline is the key event of the report. With revenue of $184.5m, EBITDA of $84.0m means only 21.1 cents of EBITDA per dollar of revenue.
For comparison: in Q1 2026, with revenue of $128.4m, EBITDA was $85.7m, implying a margin of about 66.8%. In Q2, revenue rose by $56.1m but EBITDA fell by $1.7m. This means the additional $56.1m of revenue was accompanied by cost increases of more than $57.8m.
Such a sharp margin compression could be due to one-off write-offs, higher depreciation or asset impairment, but the provided facts do not disclose the cause. We record the fact: profitability collapsed, and this is the main negative of the report.
Net profit of $14.0m against a $10.3m loss a year earlier — a turnaround, but profit is thin relative to revenue
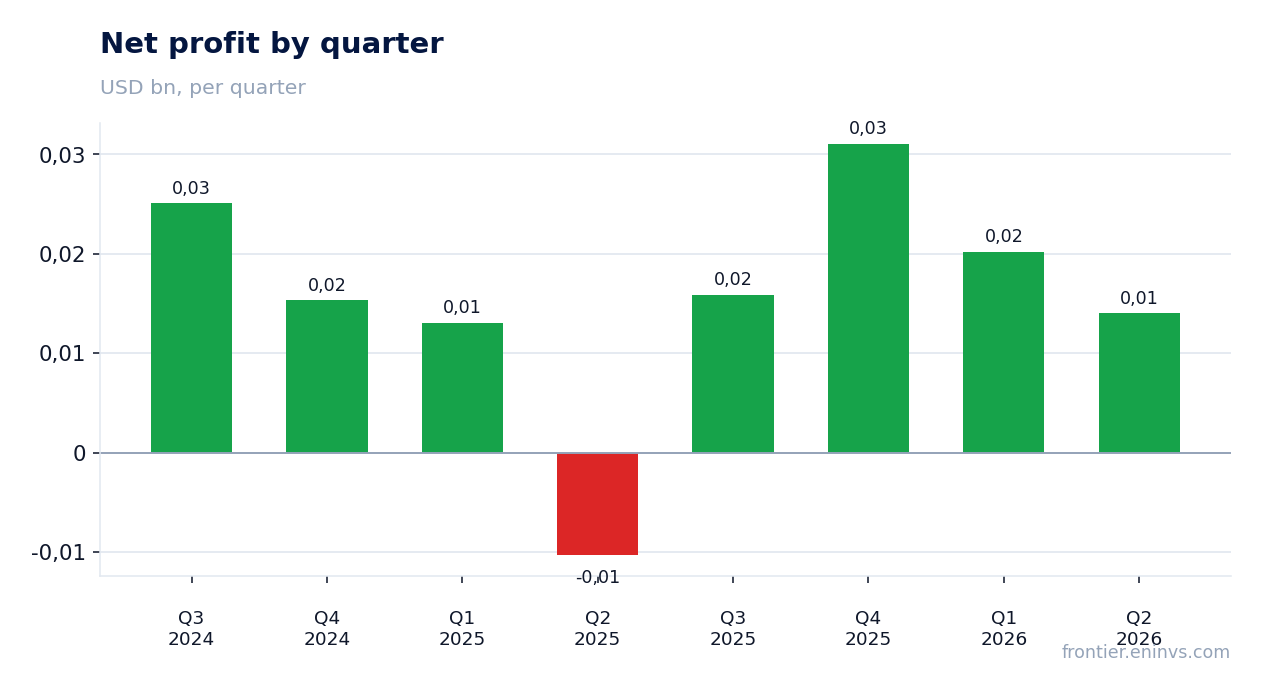
Net profit in Q2 2026 was $14.0m against a loss of $10.3m in Q2 2025. The swing into positive territory occurred, but the net margin was only 7.6% versus a negative margin of -8.6% a year earlier.
Profit of $14.0m on revenue of $184.5m means 7.6 cents of net profit per dollar of revenue. This is significantly lower than in Q1 2026, when with revenue of $128.4m net profit was $20.2m, implying a margin of about 15.7%. So in Q2 profitability fell both in absolute and relative terms.
Over the last 12 months GeoPark's net profit was $81.1m. This is a moderate result for a company with a market capitalisation of $613.7m. Return on equity (ROE) over the last 12 months was 17.0%, which is decent but largely reflects a low equity base.
Operating cash flow of $108.4m is strong, but capital expenditure for Q2 is not disclosed
Operating cash flow in Q2 2026 was $108.4m. This is significantly higher than in Q1 2026 ($50.0m) and Q2 2025 (-$8.6m). Over the last 12 months operating cash flow was $14.7m, well below the quarterly figure — meaning cash flow was weak or negative in the preceding three quarters.
The strong operating flow in Q2 could be due to one-off receipts or working capital changes. Without capex data, free cash flow cannot be assessed. In Q1 2026 capex was $22.0m, in Q4 2025 data is missing, in Q3 2025 it was $17.5m.
Assuming Q2 capex was in line with Q1 (about $22m), free cash flow could have been around $86m. However, this is only an estimate, and without actual data we cannot claim the company generates sustainable free cash flow.
Net debt of $479.2m with a net debt/EBITDA of 1.41x on LTM basis — moderate leverage, but absolute debt rose
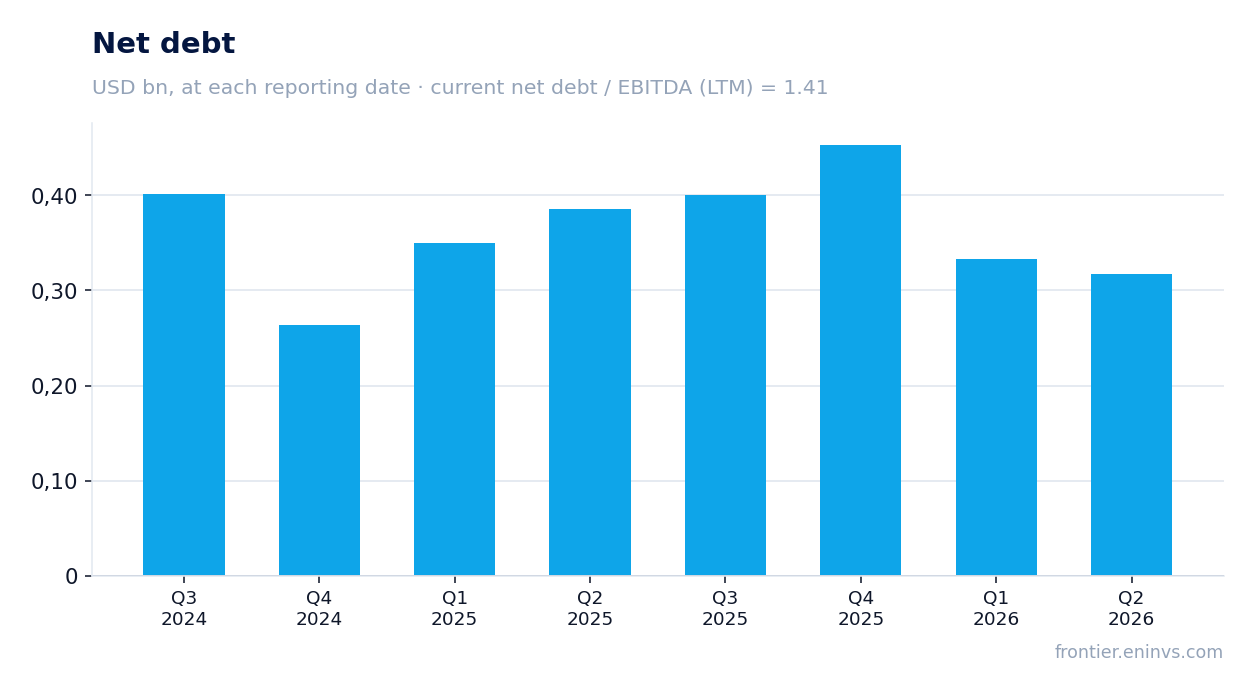
GeoPark's net debt at the latest reporting date was $479.2m. The net debt/EBITDA ratio over the last 12 months is 1.41x. This is a moderate level: the company can service its debt but has little headroom. For comparison, in Q1 2026 net debt was $333.1m, in Q2 2025 it was $385.7m.
Absolute net debt rose both quarter on quarter (by $146.1m) and year on year (by $93.5m). However, we cannot claim that leverage increased, as the facts do not contain prior-period net debt/EBITDA values. We only record the current level of 1.41x.
Over the last 12 months EBITDA was $340.4m, covering net debt 1.41 times. At the current market capitalisation of $613.7m and net debt of $479.2m, enterprise value (EV) is about $1,092.9m.
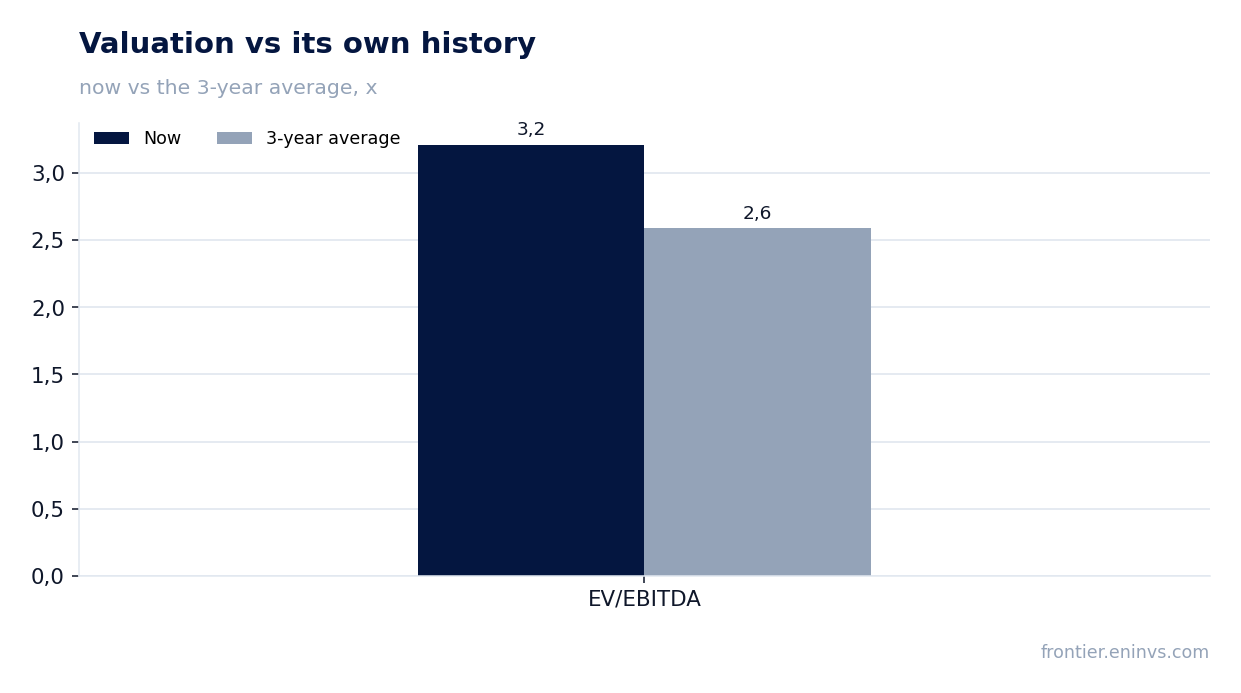
EV/EBITDA of 3.21x versus its own three-year average of 2.59x — the stock trades above its history
GeoPark's EV/EBITDA multiple currently stands at 3.21x. This is above its own three-year average of 2.59x. So the stock trades at a premium to its historical valuation. The P/E over the last 12 months is 7.57x, which also does not look cheap for a company with falling EBITDA.
Market capitalisation of $613.7m with net debt of $479.2m gives an EV of about $1,092.9m. With LTM EBITDA of $340.4m, the EV/EBITDA multiple is 3.21x. If EBITDA continues to decline, the multiple will rise even if the share price stays unchanged.
Dividend yield over the last 12 months is 0.64%. This is a low level that does not compensate for the risks associated with falling EBITDA and a valuation above historical levels.
The portal's model implies 59% downside to fair value at current commodity prices
According to the portal's model, which re-prices EBITDA at current commodity prices and a target EV/EBITDA, GeoPark's fair value is 59% below the current market price. This is our own estimate, not a market consensus or a target price.
The model takes into account current commodity prices and a target EV/EBITDA multiple. With LTM EBITDA of $340.4m and EV of $1,092.9m, the market values the company at 3.21x EBITDA. If commodity prices remain at current levels, the model suggests fair value should be lower.
This result is consistent with a multiple above its own three-year average and falling EBITDA. The 59% downside is a strong argument that the stock is overvalued relative to fundamental value.
Valuation on the latest reported figures
| Metric | Value |
|---|---|
| Market cap | 0.61 bn USD |
| P/E (LTM) | 7.6 |
| EV/EBITDA (LTM) | 3.2 |
| P/B | 2.50 |
| Net debt / EBITDA (LTM) | 1.41 |
| Operating cash flow (LTM) | 0.01 bn |
| ROE | 17.0% |
| Dividend yield (12m) | 0.6% |
| EV/EBITDA, 3-year average | 2.6 |
Bottom line
The strong points of the report are revenue growth of 54.0% and operating cash flow of $108.4m. However, these achievements are overshadowed by a 46.0% fall in EBITDA and margin compression from 60.2% to 21.1%. Net profit of $14.0m looks positive against a loss a year earlier, but it is thin and does not offset the weakness in operating profitability. The EV/EBITDA multiple of 3.21x is above its own three-year average of 2.59x, and the portal's model implies 59% downside. The key question for a holder is whether the company can restore its margin and halt the decline in EBITDA.
Open the company's financial profile GPRK →
See also: market overview · valuation map · stock screeners