Hallador Energy: Q2 loss wiped out a year of profit, but $2.4bn of contracts and an $800m project change the bet
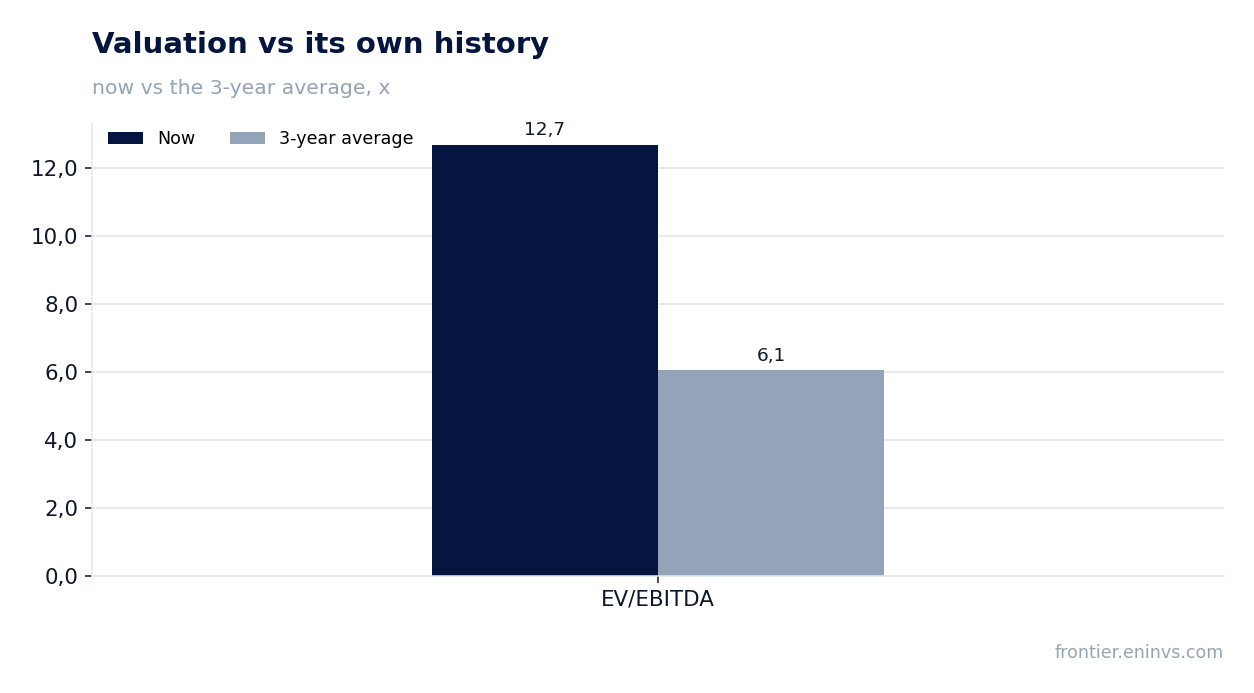
On 10 August Hallador Energy reported second-quarter 2026 results. Revenue fell 1.3% year on year to $101.5m, adjusted EBITDA turned negative at $2.9m against $3.4m a year earlier, and the net loss was $15.2m versus $8.2m of profit. Over the trailing twelve months the company earned $41.9m of net profit and $59.4m of EBITDA on $452.2m of revenue, with net debt of $29.0m equal to 0.49 EBITDA. Yet the stock trades at 12.7 EV/EBITDA against a three-year average of 6.1, and the portal's own model puts fair value 90% below the market price. At the current price the share looks unattractive: the market is paying a premium to history for a project that has not yet reached a final investment decision.
Key takeaways
— A $15.2m second-quarter loss wiped out all profit earned over the trailing twelve months
— Revenue rests on accredited capacity and third-party coal, not on delivered energy
— The EBITDA collapse came from a planned outage and expensive purchased power
— Net debt of $29.0m equals 0.49 EBITDA, but liquidity fell to $84.2m
— Capex rose to $26.3m and is flowing into the $800m Turtle Creek project
— A $2.4bn contract book provides revenue visibility through 2040
— At 12.7 EV/EBITDA the stock is double its own history, and the portal's model sees 90% downside
Attractiveness
Key figures, USD bn
| Metric | Q2 2025 | Q2 2026 | Change |
|---|---|---|---|
| Revenue | 0.10 | 0.10 | -1.3% |
| EBITDA | 0.02 | -0.00 | -116.4% |
| Operating profit | 0.01 | -0.01 | -206.6% |
| Net profit | 0.01 | -0.02 | -284.7% |
| Operating cash flow | 0.01 | -0.02 | -310.3% |
| Capex | 0.01 | 0.03 | +101.6% |
| EBITDA margin | 16.9% | -2.8% | -19.7 pp |
| Net margin | 8.0% | -15.0% | -23.0 pp |
A $15.2m second-quarter loss wiped out all profit earned over the trailing twelve months
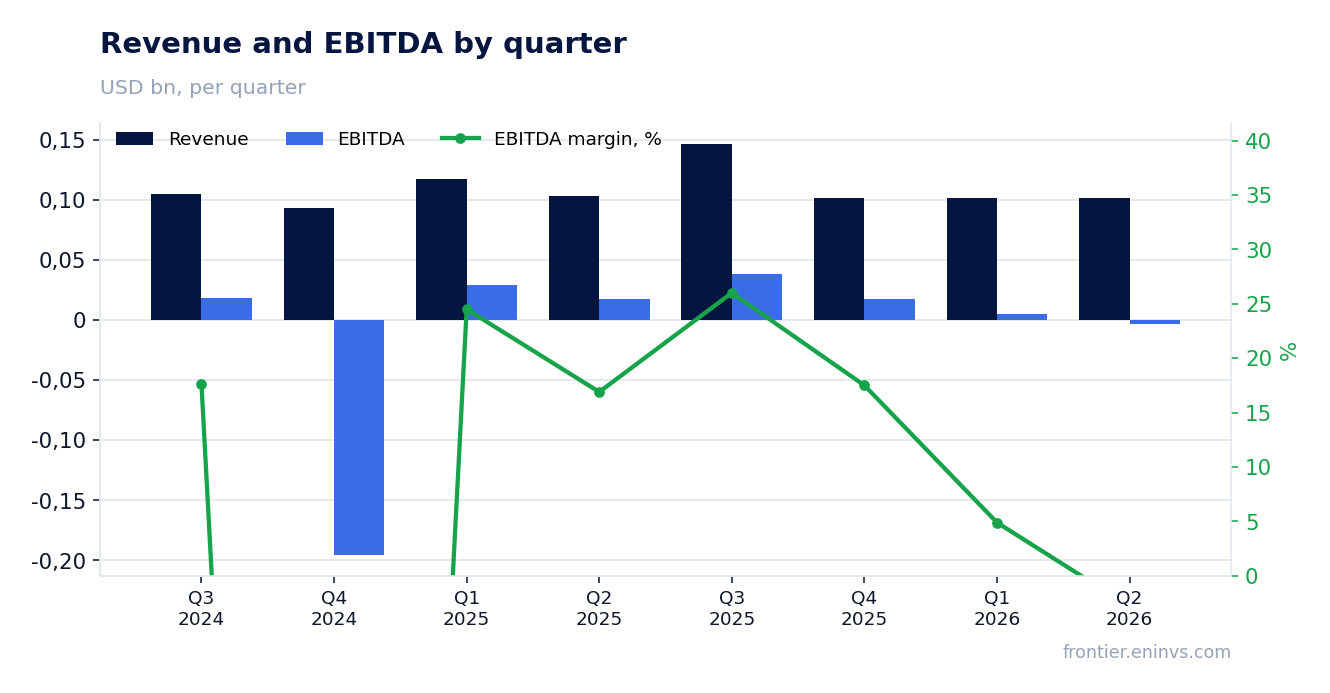
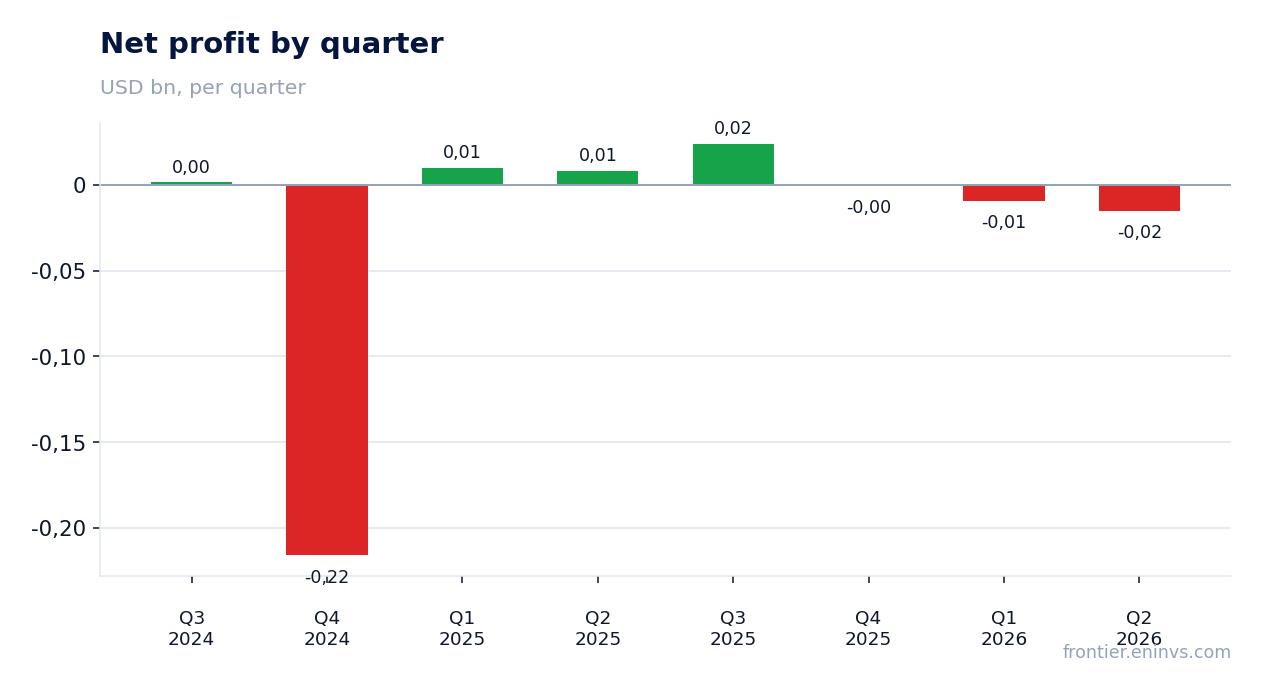
In the second quarter of 2026 Hallador posted a net loss of $15.2m against $8.2m of profit a year earlier. Revenue fell 1.3% to $101.5m, the operating loss was $12.7m, and EBITDA turned negative at $2.9m. This is not a seasonal trough but the direct result of two factors named in the release: a planned 60-day outage at Merom Unit 1 and the purchase of power at high prices to meet delivery obligations.
Over the trailing twelve months the company still earned $41.9m of net profit and $59.4m of EBITDA on $452.2m of revenue. But that entire result was generated in three quarters – from Q3 2025 through Q1 2026 – and Q2 2026 partly erased it. The EBITDA margin in the quarter was minus 2.8% against 16.9% a year earlier, and the net margin was minus 15.0% against plus 8.0%.
For a holder this means the annual profit underpinning the 17.3 P/E no longer reflects current earnings power. If the third quarter does not restore positive EBITDA, the full-year result will be under pressure and the multiples will need to be revised.
Revenue rests on accredited capacity and third-party coal, not on delivered energy
Total revenue in the second quarter was $101.5m, of which electric sales contributed $59.5m, third-party coal $40.6m, and other revenue $1.4m. A year earlier the mix was different: electric sales $60.0m, coal $38.1m, other $4.7m. The 1.3% decline in total revenue was driven by lower delivered energy sales, partly offset by higher accredited capacity revenue and third-party coal sales.
The revenue structure shows the company increasingly depends on capacity payments rather than actual generation. That is more resilient to energy price swings but also caps upside when the market is hot. The release states directly that higher accredited capacity and third-party coal partly offset the decline in delivered energy sales.
For the first half of 2026 revenue was $206.0m against $220.5m a year earlier. Electric sales for the half fell to $127.3m from $145.9m, while coal rose to $75.7m from $68.3m. This confirms a shift toward the coal segment, which is less profitable than generation.
The EBITDA collapse came from a planned outage and expensive purchased power
EBITDA in the second quarter was minus $2.9m against plus $3.4m a year earlier. The release names two causes: higher maintenance costs during the planned outage at Merom Unit 1 and higher purchased power costs from unplanned downtime at Unit 2 that coincided with periods of elevated market prices. The company had to buy power at high prices to meet delivery obligations.
The cost lines show this: other operating and maintenance costs rose to $39.1m from $29.0m, and the cost of purchased power rose to $8.6m from $2.2m. These two factors added about $16.5m to costs and fully explain the negative EBITDA. They were partly offset by higher accredited capacity revenue and third-party coal sales.
Management says these factors do not reflect the plant's earning power and expects generation volumes to improve sequentially in the third quarter. For now that is a statement, not a result: EBITDA was negative in the quarter, and the market will wait for confirmation in the next report.
Net debt of $29.0m equals 0.49 EBITDA, but liquidity fell to $84.2m
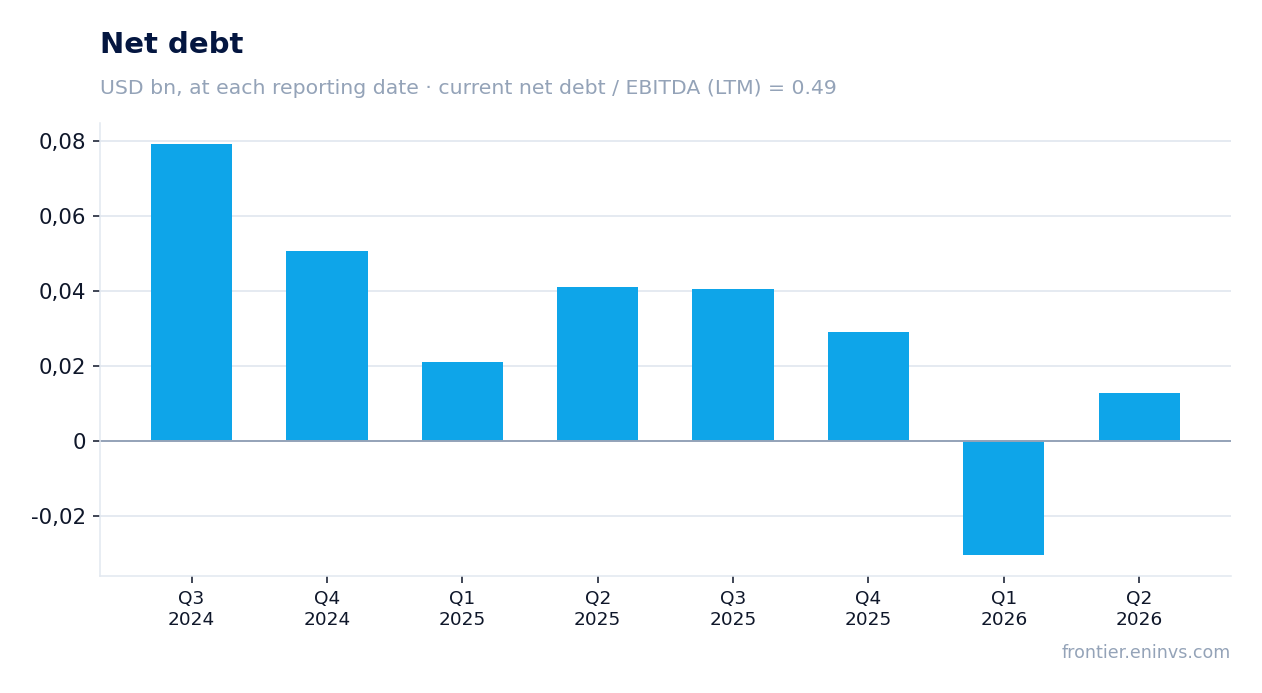
Net debt at the end of the second quarter was $29.0m, equal to 0.49 trailing-twelve-month EBITDA. That is a moderate level: the company services its debt without strain, with quarterly interest expense of $3.8m, of which $1.0m was interest on bank debt. However, total liquidity fell to $84.2m from $97.5m at 31 March 2026, though it was $42.0m a year earlier.
On 15 May 2026 the company drew $45.0m under its delayed draw term loan and used part of the proceeds to repay $8.0m on its revolver. As a result, total bank debt at 30 June 2026 was $45.0m against zero at 31 March 2026 and $30.0m at 31 December 2025. This is a deliberate increase in debt to fund the Turtle Creek project.
Operating cash flow in the second quarter was negative at minus $23.9m against plus $11.4m a year earlier. For the half-year the outflow was $3.4m. This means current operations do not generate enough cash to cover capital expenditure, and the company is funding the project through debt and equity issuance.
Capex rose to $26.3m and is flowing into the $800m Turtle Creek project
Capital expenditure in the second quarter was $26.3m against $13.1m a year earlier. The increase reflects reliability upgrades completed during the planned outage and spending on the Turtle Creek project. For the half-year capex reached $33.9m against $24.7m a year earlier.
The Turtle Creek project is a 460 MW peaking plant targeting commercial operation in the second half of 2028. The company reduced the expected project cost to below $800m, or about $1,700/kW, and accelerated the timeline. A final investment decision is expected in September 2026 after receiving the results of the MISO ERAS study and executing a generator interconnection agreement.
Project financing is not yet closed. The company is negotiating to minimise equity dilution, but with a cost of $800m and a current market capitalisation of $724m, any large project will require either significant debt or equity issuance. This is a key risk for the current valuation.
A $2.4bn contract book provides revenue visibility through 2040
As of 30 June 2026 Hallador had $1.8bn of contracted revenue from delivered energy, accredited capacity and third-party coal sales, including capacity commitments extending through 2040. Including intercompany coal sales, total contracted revenue at the segment level was $2.4bn. That is a significant amount for a company with annual revenue of about $450m.
The contract structure shows the bulk is accredited capacity: $1.2bn through 2040, of which $825m covers 2031–2040. The average contracted capacity price rises from $249 per MW-day in 2026 to $480 in 2031–2040. This provides long-term visibility but also means the company is locking in prices for decades.
Some of these contracts still require approval by the Indiana Utility Regulatory Commission, expected on or before 15 November 2026. If approval is not obtained, part of the contracted revenue could disappear. This is an important risk that the market, judging by the valuation, appears to ignore.
At 12.7 EV/EBITDA the stock is double its own history, and the portal's model sees 90% downside
At the current price the stock trades at 12.7 EV/EBITDA on trailing twelve months against a three-year average of 6.1. That is more than a twofold premium to its own history. The trailing P/E is 17.3, also above historical levels. The market is valuing the company on the future Turtle Creek project, not on current earnings.
The portal's own model, which reprices EBITDA at current commodity prices and a target EV/EBITDA, puts fair value 90% below the current market capitalisation. This is not a consensus or a target price but an estimate on the portal's model, and it points to significant downside. The model sits on its clamp, so it is a bound rather than a precise estimate.
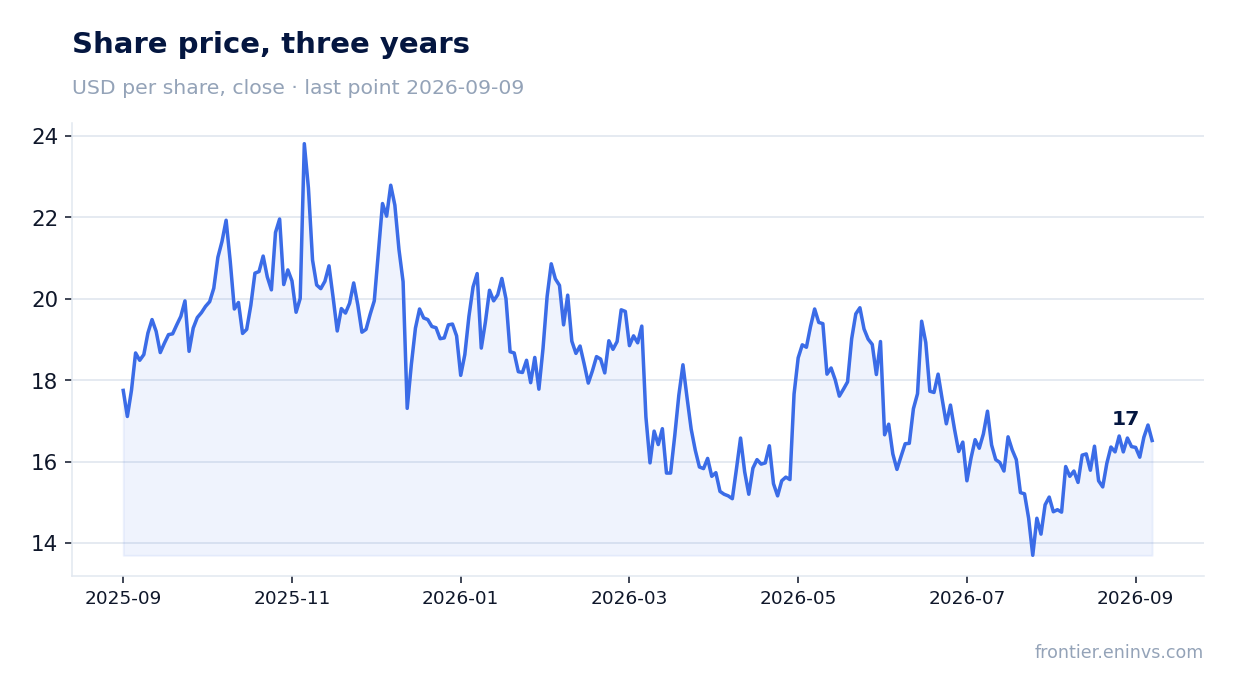
Since the release the stock has risen 11.9%, and on the release day it gained 7.6%. The market reacted positively to the lower project cost and accelerated timeline but ignored the weak quarterly results. That reaction creates correction risk if the project does not receive final approval or requires more capital than expected.
Valuation on the latest reported figures
| Metric | Value |
|---|---|
| Market cap | 0.72 bn USD |
| P/E (LTM) | 17.3 |
| EV/EBITDA (LTM) | 12.7 |
| P/B | 4.53 |
| Net debt / EBITDA (LTM) | 0.49 |
| Operating cash flow (LTM) | 0.08 bn |
| ROE | -30.8% |
| EV/EBITDA, 3-year average | 6.1 |
Bottom line
Bottom line: in the second quarter Hallador posted a loss that erased a significant part of its annual profit, and EBITDA turned negative due to the outage and expensive purchased power. The company has moderate debt at 0.49 EBITDA and a $2.4bn contract book, but capex is rising, operating cash flow is negative, and the $800m Turtle Creek project has not yet reached a final investment decision. At 12.7 EV/EBITDA the stock trades at double its own history, and the portal's model points to 90% downside. At the current price the share looks unattractive: the market has already priced in project success, while quarterly results and financing risks remain significant.
Open the company's financial profile HNRG →
See also: market overview · valuation map · stock screeners