Innovative Industrial Properties: profit jumped 68%, but the gain came from an asset sale and one-off recoveries, not from rent
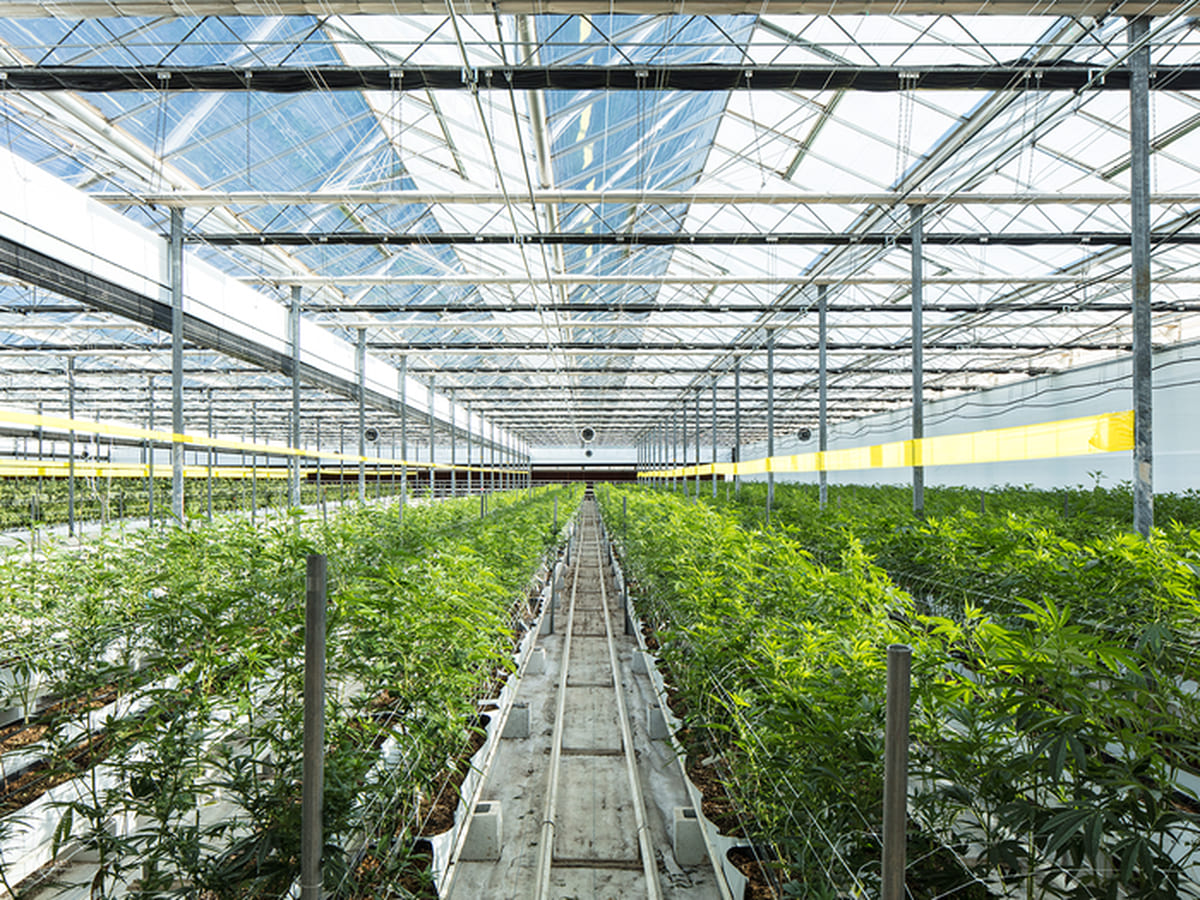
On 3 August Innovative Industrial Properties reported results for the second quarter of 2026. Revenue added just 0.7% year on year, to $63.3 million, while net profit rose 68.5%, to $43.9 million, and EBITDA climbed 49.3%, to $70.8 million. The profit gain did not come from rent: the sale of the Perth, New York property brought $11.8 million, and another $8.5 million came from interest and dividend income on the IQHQ investment. With an EV/EBITDA of 6.7 and a dividend yield near 12.9%, the stock looks attractive, but the durability of that income remains in question.
Key takeaways
— Revenue rose 0.7%, with all the gain coming from new leases and indexation rather than portfolio expansion
— Profit rose 68.5%, but $11.8 million of it was a one-off gain from the Perth asset sale
— The 111.8% EBITDA margin is a result of the asset sale and interest income, not operational improvement
— Leverage at 1.2x LTM EBITDA remains low, but the company is actively raising debt while buying back stock
— The $1.90 dividend yields about 12.9%, but is covered by AFFO only 96%
— EV/EBITDA of 6.7 and P/E of 11.6 are below historical levels, reflecting market doubts about the durability of rental income
— The $270 million IQHQ investment generates interest income, but its contribution to cash flow remains limited
Attractiveness
Key figures, USD bn
| Metric | Q2 2025 | Q2 2026 | Change |
|---|---|---|---|
| Revenue | 0.06 | 0.06 | +0.7% |
| EBITDA | 0.05 | 0.07 | +49.3% |
| Operating profit | 0.03 | 0.04 | +43.4% |
| Net profit | 0.03 | 0.04 | +68.5% |
| Operating cash flow | 0.05 | 0.04 | -7.3% |
| Capex | 0.01 | — | — |
| EBITDA margin | 75.4% | 111.8% | +36.4 pp |
| Net margin | 41.4% | 69.3% | +27.9 pp |
Revenue rose 0.7%, with all the gain coming from new leases and indexation rather than portfolio expansion
Revenue in the second quarter of 2026 was $63.3 million, up 0.7% year on year. The growth is minimal: new leases on existing properties and annual indexation were almost fully offset by lost rental revenue from property sales, tenant defaults and lease terminations.
Rental revenue was virtually flat – $62.9 million versus $62.9 million a year earlier. Other revenue rose to $0.4 million from $0.03 million, but its contribution to the overall result is negligible.
The company continues to work with troubled tenants. During the quarter, $1.2 million of security deposits were applied to pay rent on properties leased to Battle Green and The Cannabist Company. This supports revenue but is not a sustainable source.
Revenue dynamics remain weak: in the first quarter of 2026 it fell 3.8% year on year, and in the second it turned marginally positive. Without new large acquisitions or a significant improvement in the tenant situation, acceleration is unlikely.
Profit rose 68.5%, but $11.8 million of it was a one-off gain from the Perth asset sale
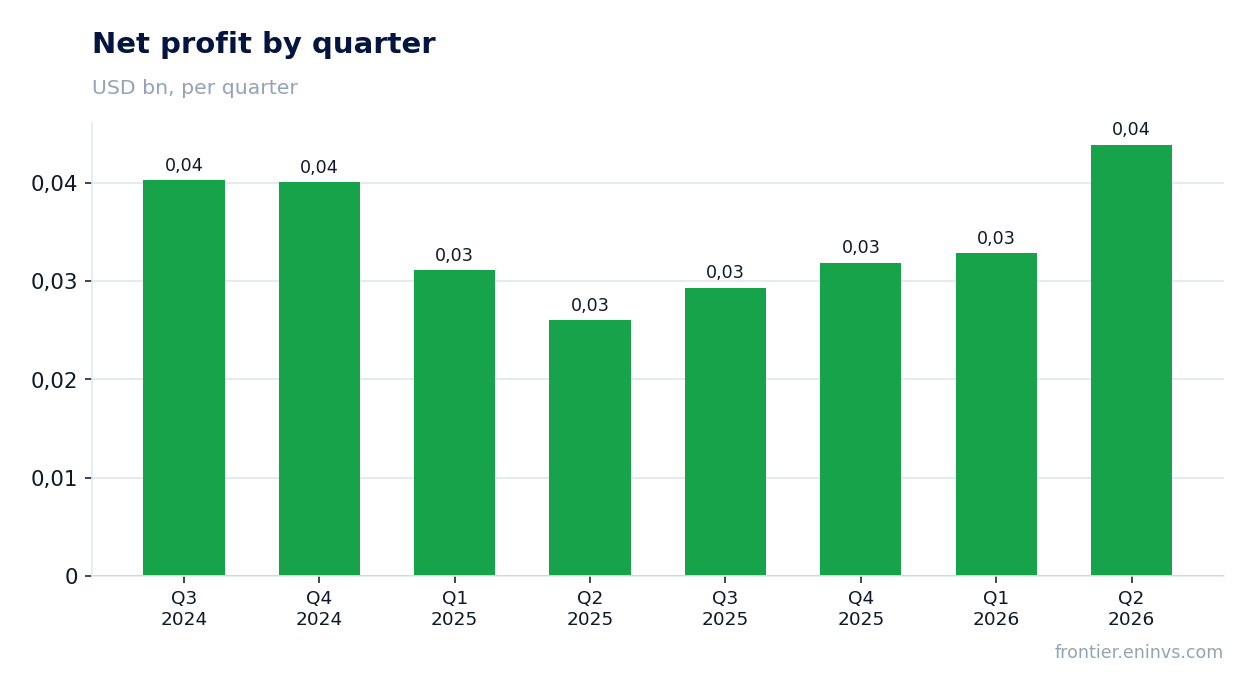
Net profit in the second quarter of 2026 was $43.9 million, up 68.5% year on year. However, this growth is largely driven by one-off factors.
In May 2026, the company sold a property in Perth, New York for $88.5 million and provided $49.0 million of seller financing. A gain on sale of $11.8 million was recognised on this transaction. Without it, profit would have been significantly lower.
In addition, interest and other income rose by $9.2 million, to $10.8 million, mainly due to the recognition of $8.5 million of interest and dividend income on the IQHQ investment. This is also unrelated to core rental operations.
Thus, sustainable rental profit remains under pressure: revenue is barely growing, while depreciation and interest expenses are rising. One-off income masks the weakness of the operating model.
The 111.8% EBITDA margin is a result of the asset sale and interest income, not operational improvement
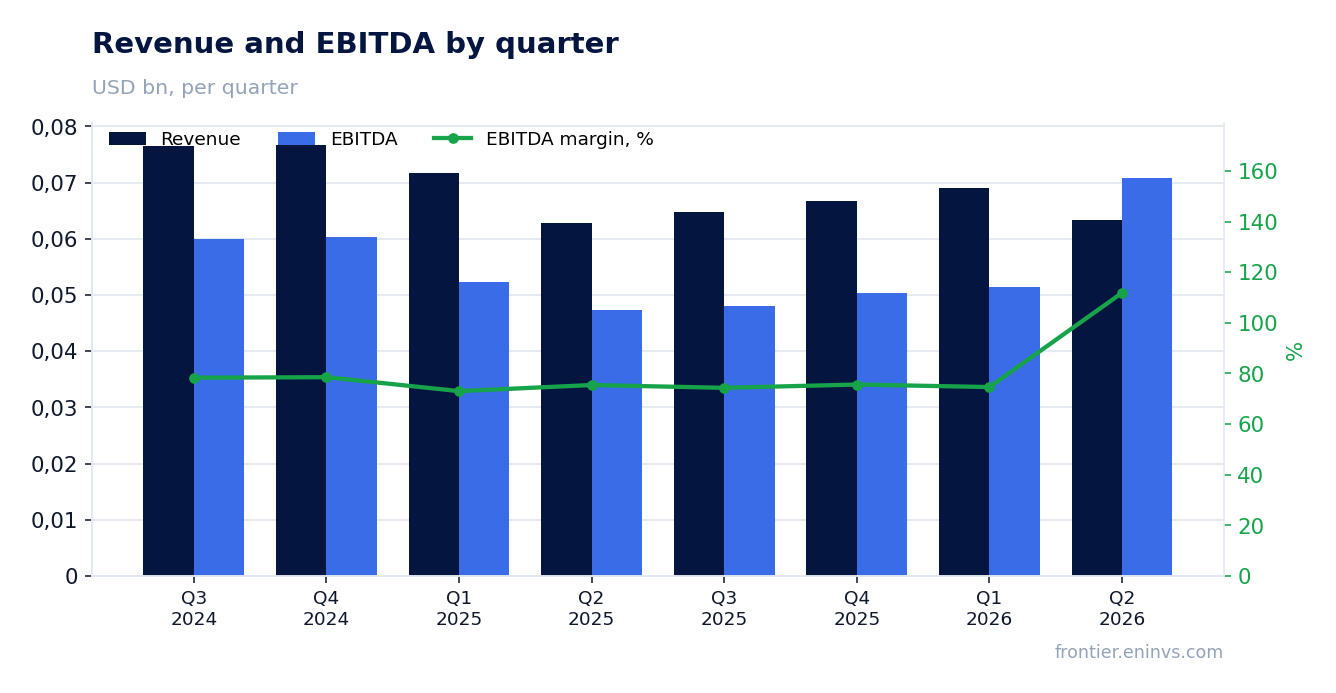
EBITDA in the second quarter of 2026 was $70.8 million, with an EBITDA margin of 111.8%. A year earlier, these figures were $47.4 million and 75.4% respectively. Such a high margin is atypical for a REIT and requires explanation.
The 49.3% increase in EBITDA is mainly due to the gain on the Perth property sale ($11.8 million) and higher interest income ($8.5 million from IQHQ). Without these one-off items, EBITDA would have been significantly lower.
Operating expenses also rose: general and administrative expenses were $7.7 million versus $8.6 million a year earlier, while property expenses were $7.2 million versus $6.9 million. Depreciation increased to $18.8 million from $18.5 million.
The high EBITDA margin does not reflect sustainable operating efficiency. In the coming quarters, absent new large sales, the margin is likely to return to more normal levels.
Leverage at 1.2x LTM EBITDA remains low, but the company is actively raising debt while buying back stock
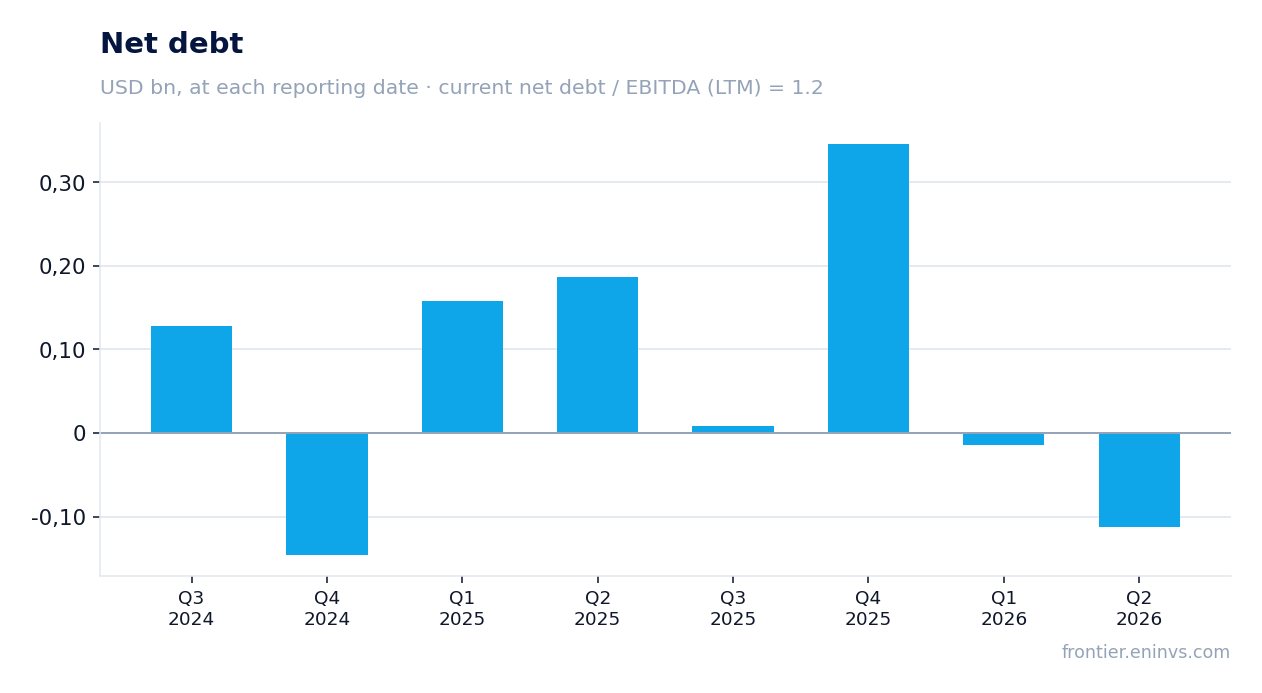
Net debt at the end of the second quarter of 2026 was $346.1 million, and the ratio of net debt to LTM EBITDA was 1.2. This is a low level for a REIT, giving the company room for manoeuvre.
However, during the reporting quarter the company actively raised debt. It issued $402.5 million of exchangeable notes at 6.0% due 2029, as well as several secured term loans totalling about $148.7 million at various rates. At the same time, it fully repaid $291 million of 5.5% notes.
Part of the proceeds from the exchangeable notes – $80.5 million – was used to repurchase shares. In total, the company bought back 1.47 million shares for $89.0 million at an average price of about $60.58 per share.
This policy – raising debt while buying back stock – increases financial risk, especially if operating results remain weak. So far, low leverage allows it, but the margin of safety is not infinite.
The $1.90 dividend yields about 12.9%, but is covered by AFFO only 96%
For the second quarter of 2026, the company declared a dividend of $1.90 per share, equivalent to an annual payout of $7.60. At the share price of $58.81 before the release, the dividend yield is about 12.9%.
Adjusted funds from operations (AFFO) for the quarter were $53.0 million, or $1.83 per share. Thus, the dividend of $1.90 exceeds AFFO per share, with coverage at about 96%. This means the company is paying out more than it earns and must fund the difference from other sources.
Since inception, the company has paid over $1.2 billion in dividends. However, the current payout level can only be sustained if AFFO grows, which in turn depends on a recovery in rental income and successful resolution of troubled tenants.
Our estimate: in 2026, the dividend may remain at $7.60 per share, but its coverage will depend on one-off income. If asset sales and interest income from IQHQ are not repeated, the company may face the need to cut the payout or raise additional capital.
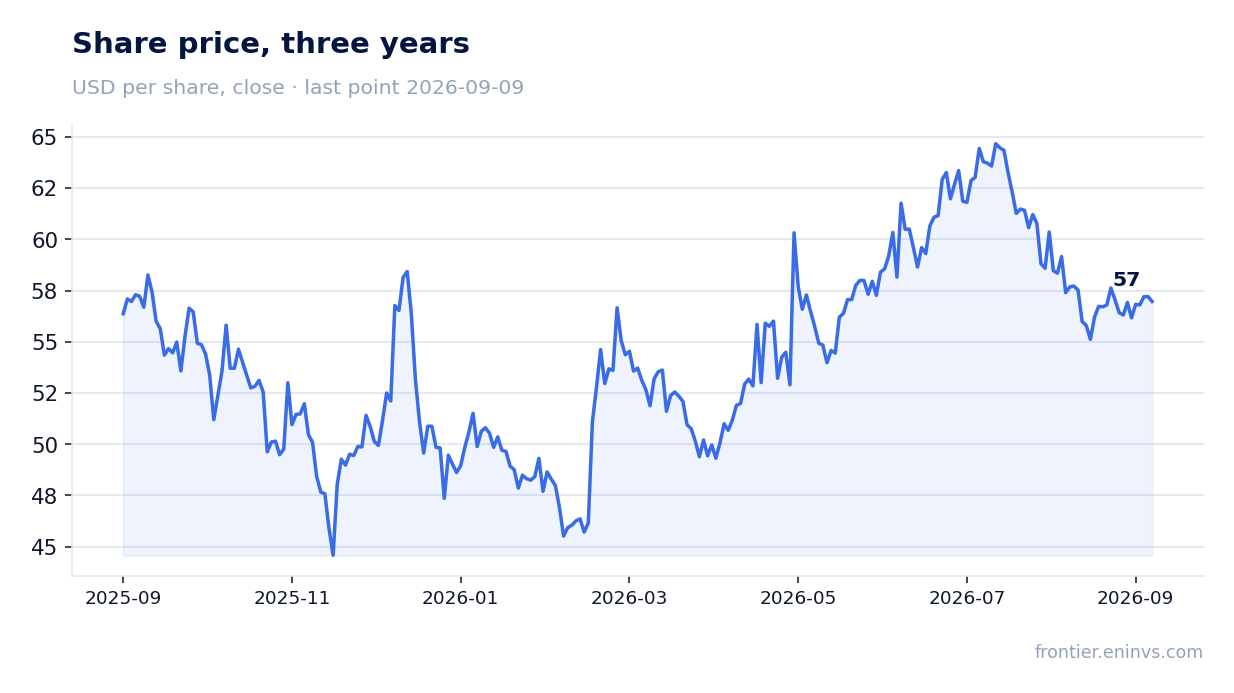
EV/EBITDA of 6.7 and P/E of 11.6 are below historical levels, reflecting market doubts about the durability of rental income
At the time of the release, the company's market capitalisation was $1.60 billion. The LTM EV/EBITDA multiple was 6.7, and P/E was 11.6. These are below the company's historical averages, indicating investor caution.
Such low multiples are explained by weak revenue dynamics, tenant problems and uncertainty around dividend sustainability. The market values the company based on current risks rather than growth potential.
According to the portal's model, which re-prices EBITDA at current prices at the target EV/EBITDA, the upside to fair value is estimated at +31%. This is our own estimate, not a market consensus.
For comparison: the dividend yield of 12.9% significantly exceeds the key rate, making the stock interesting for income investors, but the high risk of a payout cut limits its appeal.
The $270 million IQHQ investment generates interest income, but its contribution to cash flow remains limited
During the second quarter of 2026, the company fully funded its strategic investment in IQHQ, Inc. for a total of $270.0 million, including $100.0 million under a revolving credit facility and $170.0 million in Series G preferred equity.
This generated $8.5 million of interest and dividend income in the reporting quarter, a significant contribution to the increase in interest income. However, these receipts are not related to core rental operations and may be less stable.
The IQHQ investment is reflected on the balance sheet as 'Life science investments' and increased to $275.9 million from $152.7 million at the end of 2025. This is a long-term investment that may generate income in the future but does not yet produce significant cash flow.
The question is how sustainable this income is and how it will be accounted for going forward. If IQHQ continues to pay interest and dividends, it will support profit but will not solve the problem of weak rental revenue growth.
Valuation on the latest reported figures
| Metric | Value |
|---|---|
| Market cap | 1.60 bn USD |
| P/E (LTM) | 11.6 |
| EV/EBITDA (LTM) | 6.7 |
| P/B | 0.86 |
| Net debt / EBITDA (LTM) | 1.20 |
| Operating cash flow (LTM) | 0.20 bn |
| ROE | 9.4% |
Bottom line
The second-quarter 2026 report showed profit growth of 68.5%, but this was largely driven by one-off factors – the Perth asset sale and interest income from IQHQ. Core operations are stagnating: revenue rose only 0.7%, and rental revenue was flat. Leverage remains low (1.2 LTM EBITDA), but the company is actively raising debt and buying back stock, which increases risks. The dividend of $1.90 per share yields about 12.9%, but is covered by AFFO only 96%. With an EV/EBITDA of 6.7 and a portal-model upside of +31%, the stock looks attractive for investors willing to accept the risk of a dividend cut, but the sustainability of current profit is questionable.
Open the company's financial profile IIPR →
See also: market overview · valuation map · stock screeners