Lithium Americas: Q2 loss turned into profit, but it came from derivative revaluation, not the project

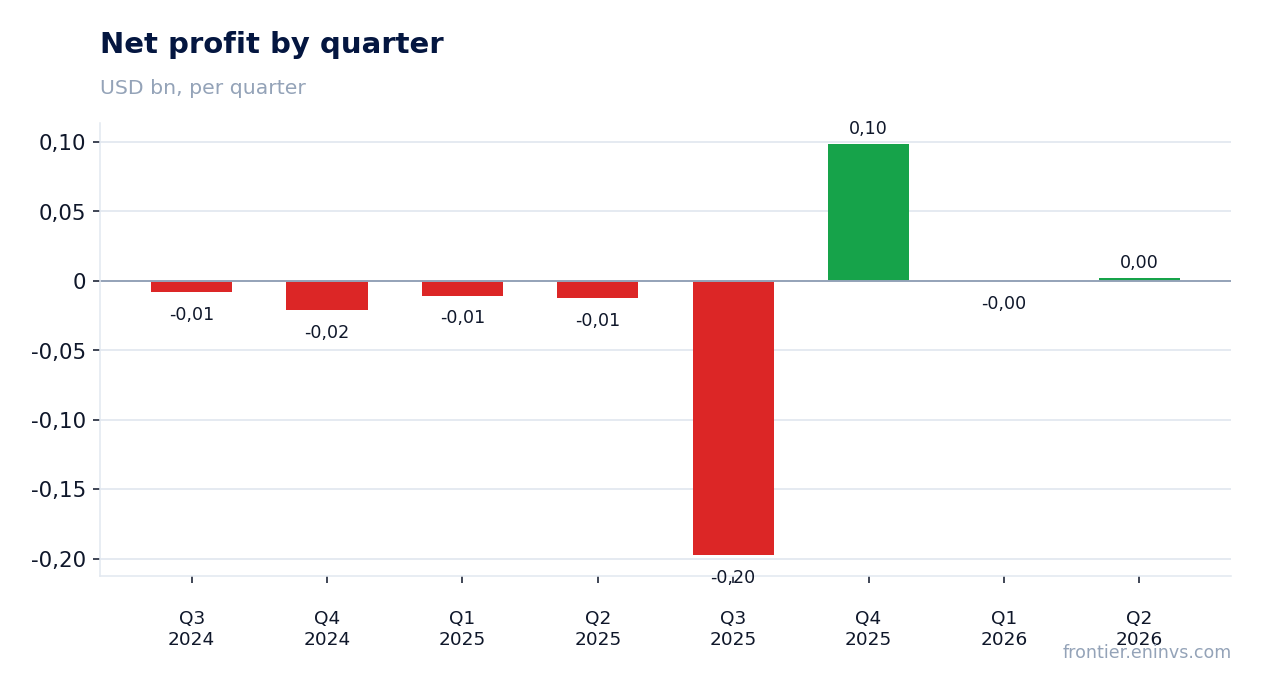
On August 13, Lithium Americas reported Q2 2026 results. The company posted net income of $2.2 million versus a $12.4 million loss a year earlier, but operating loss widened to $15.1 million and capex reached $332.2 million. Profit was driven not by operations but by a $10.2 million gain on derivative revaluation. At the current price the stock is expensive relative to its own history, and the project has not yet reached mechanical completion, so the share looks neutral.
Key takeaways
— Net income of $2.2 million is derivative revaluation, not a project result
— Operating loss widened to $15.1 million on higher personnel and pre-construction costs
— Quarterly capex was $332.2 million, with the annual guidance still $1.3–1.6 billion
— Debt load is rising: net debt reached $316.4 million after drawing the DOE loan
— EV/EBITDA remains negative, making comparison with historical levels impossible
— No lithium is produced yet, revenue is zero, and the project is still under construction
Attractiveness
Key figures, USD bn
| Metric | Q2 2025 | Q2 2026 | Change |
|---|---|---|---|
| Revenue | 0.00 | — | — |
| EBITDA | -0.01 | -0.01 | — |
| Operating profit | -0.01 | -0.02 | — |
| Net profit | -0.01 | 0.00 | to profit |
| Operating cash flow | -0.03 | -0.01 | — |
| Capex | 0.24 | 0.33 | +41.0% |
Net income of $2.2 million is derivative revaluation, not a project result
In Q2 2026, Lithium Americas posted net income of $2.2 million versus a $12.4 million loss a year earlier. However, this profit was not generated by operations: the company recorded a $10.2 million gain on derivative revaluation, including $4.5 million on the JV warrant and $5.7 million on convertible debt. Without these one-off items, the result would have remained negative.
Operating loss widened to $15.1 million from $7.8 million a year earlier. The increase is due to higher personnel costs, share-based compensation, community investment and professional fees. The company has not yet started production, so operating expenses are not covered by revenue.
Earnings per share were $0.01 basic and minus $0.02 diluted. Dilution reflects the potential issuance of shares under warrants and convertible instruments, which at the current share price puts pressure on future metrics.
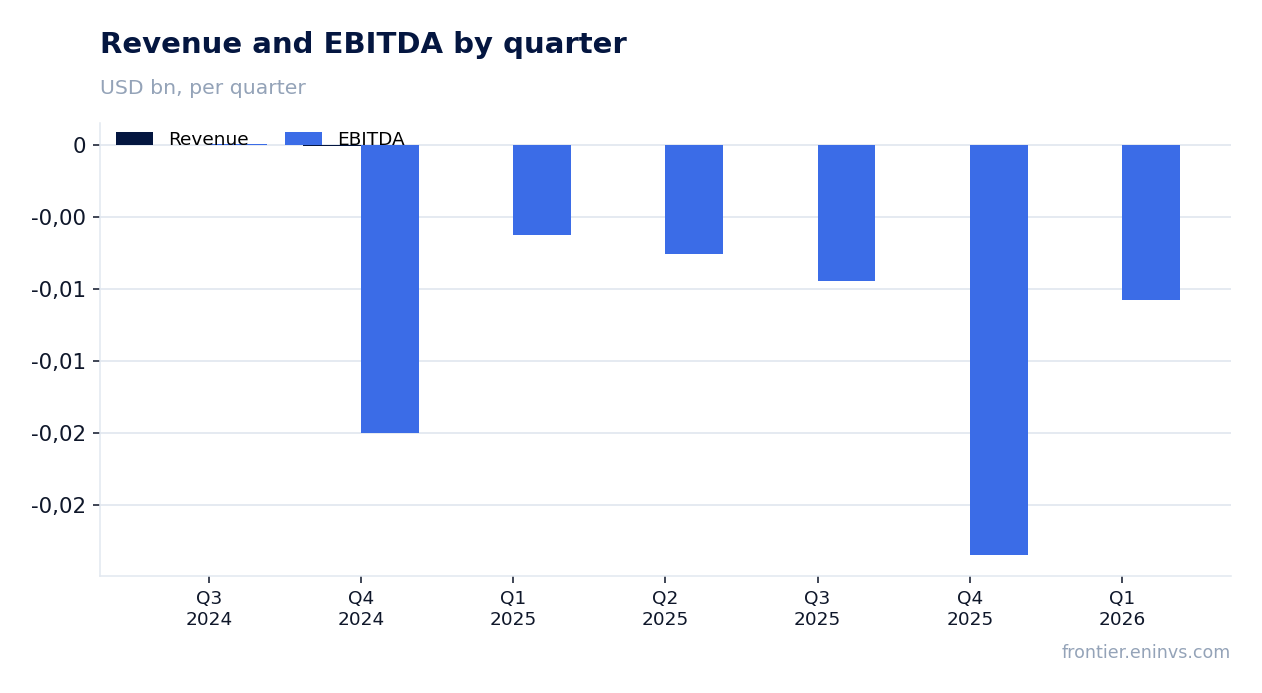
Operating loss widened to $15.1 million on higher personnel and pre-construction costs
Operating loss in Q2 2026 was $15.1 million versus $7.8 million a year earlier. The near-doubling is due to expanded operations: the company increased headcount and is ramping up community investment and professional fees. The report states that higher administrative expenses are driven by hiring, share-based compensation, community investment and regulatory fees.
There was no revenue in the second quarter, as the Thacker Pass project has not yet been commissioned. The company does not sell lithium and has no operating income. All expenses are funded from raised capital.
The rise in operating expenses is the cost of preparing for construction and future production. However, until the project starts generating revenue, losses will accumulate, increasing the need for financing.
Quarterly capex was $332.2 million, with the annual guidance still $1.3–1.6 billion
Capital expenditures in Q2 2026 reached $332.2 million, significantly above $235.6 million a year earlier. The company continues construction at Thacker Pass and is ramping up. For the first half of 2026, capex was $802.4 million, including $759.1 million on Phase 1 construction.
Management confirmed annual capex guidance of $1.3–1.6 billion. As of June 30, 2026, total capitalised project costs reached $1.8 billion, of which $1.6 billion is part of the $2.93 billion estimate per the technical report. The company notes the estimate may be revised due to tariffs, inflation and logistics constraints.
Capex is funded by the U.S. DOE loan, with a third draw of $342 million in June, and the ATM programme. The total DOE loan is $2.23 billion. The company also entered a $175 million convertible debenture agreement with Yorkville, of which $150 million is to be issued initially.
The rise in capex is an investment in future production, but it increases debt load and dilutes shareholder value. Until the project starts generating revenue, cash flow remains negative.
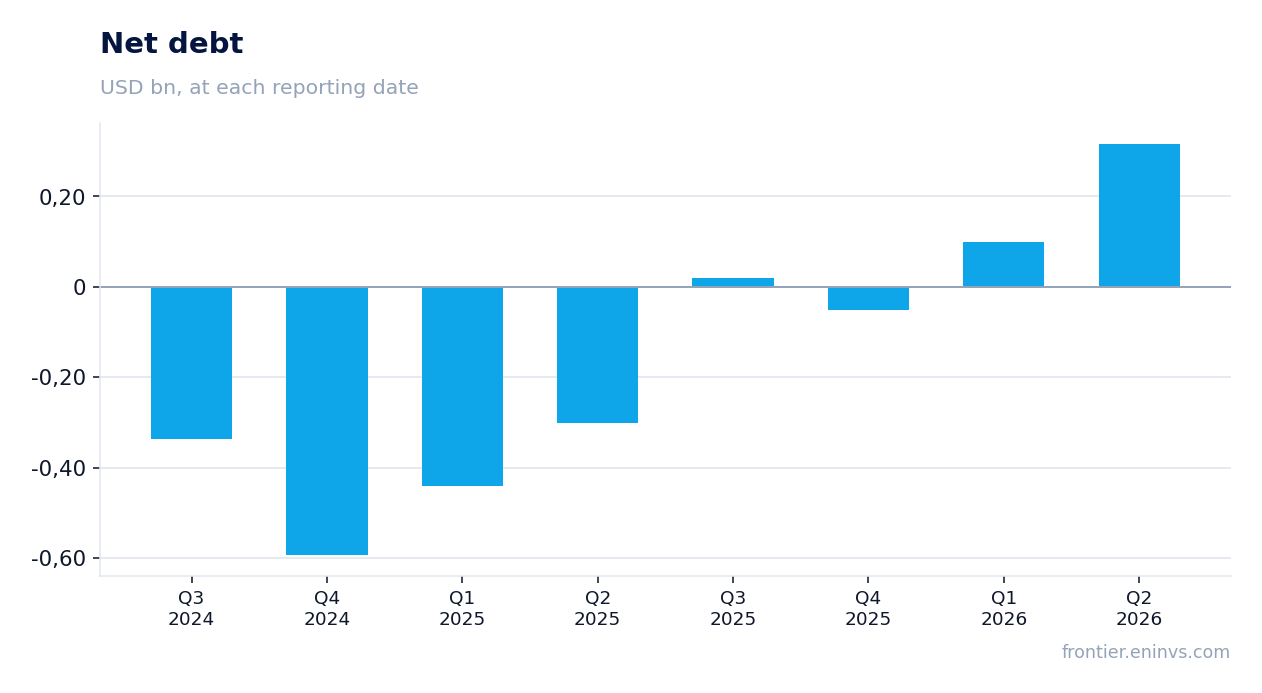
Debt load is rising: net debt reached $316.4 million after drawing the DOE loan
Net debt at the end of Q2 2026 was $316.4 million, up from $99.6 million at the end of Q1. The increase is due to the third draw of the U.S. DOE loan of $342 million. Total DOE loan advances reached $1.209 billion. Cash and restricted cash stood at $1,279.2 million, including $530.3 million at the JV level.
The company also raised $68.5 million through its ATM programme, selling 13.0 million shares at an average price of $5.36. After the reporting date, it sold another 1.1 million shares at an average price of $3.87, raising $4.2 million. These funds are used for general corporate purposes and construction financing.
Rising debt increases financial risks, especially if construction is delayed or project costs rise. However, the DOE loan has a long term and favourable conditions, reducing short-term pressure. Interest costs are capitalised into the project cost.
EV/EBITDA remains negative, making comparison with historical levels impossible
The company does not generate EBITDA: the trailing twelve-month figure is negative. Market capitalisation is $1.0 billion, but with no revenue and negative EBITDA, the EV/EBITDA multiple is meaningless. Comparison with historical levels is impossible as the company is at the investment stage.
Return on equity (ROE) is 0.64%, reflecting a small net profit over the last twelve months. However, this profit was driven by one-off items, not operations. The company's valuation largely depends on future cash flows from the Thacker Pass project, which will not start until at least 2028.
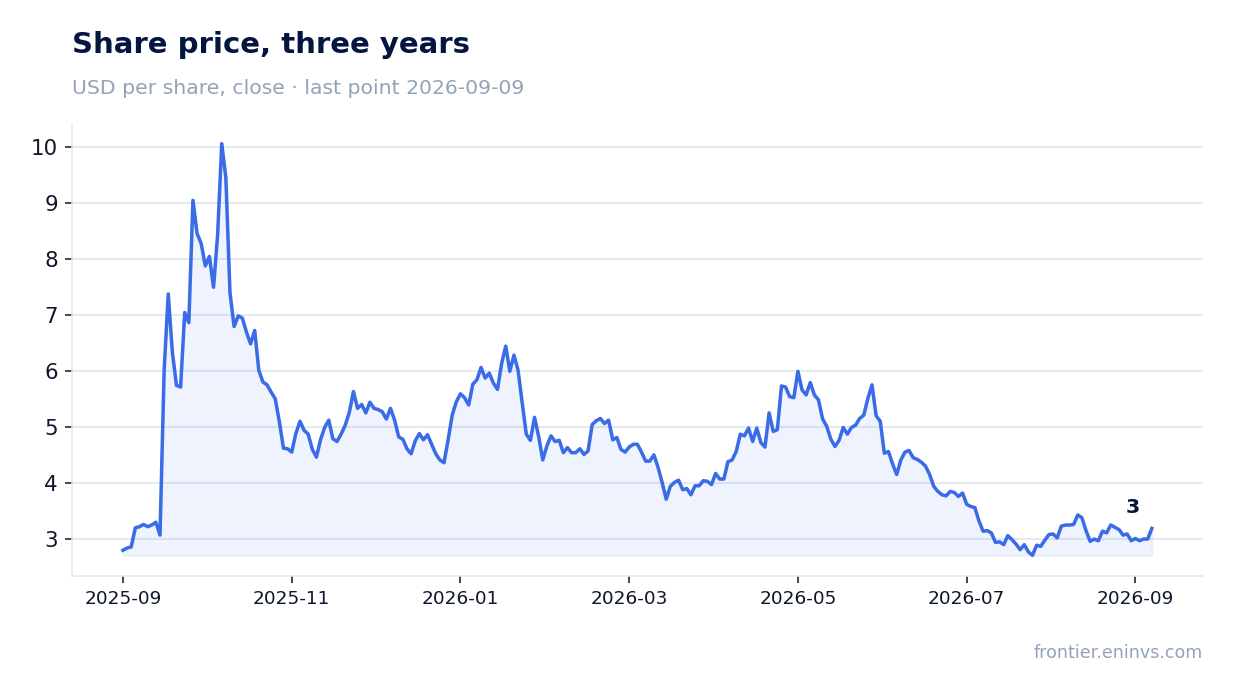
The stock traded near $3.26 before the release, rose 5.2% the next day, but fell 2.1% from the release to September 9. Volatility reflects uncertainty around project timelines and costs. With no profit or revenue, fundamental valuation is challenging.
No lithium is produced yet, revenue is zero, and the project is still under construction
Thacker Pass Phase 1 is designed for 40,000 tonnes per year of lithium carbonate, but mechanical completion is targeted for late 2027. More than 1,600 workers are on site, with over 2,000 expected by year-end. Construction is on schedule, but the project is far from completion.
The company completed upgrades to the high-voltage power line, installed the first electrical room and continues structural steel work. All off-site power modifications are complete, and grid connection is expected in Q4 2026. These steps bring the project closer to commissioning, but production is still distant.
The absence of revenue means the company is entirely dependent on external financing. Raised funds cover construction, but future capital needs may require new equity or debt issuances. This creates dilution risk for current shareholders.
Valuation on the latest reported figures
| Metric | Value |
|---|---|
| Market cap | 1.00 bn USD |
| P/B | 1.58 |
| Operating cash flow (LTM) | -0.04 bn |
| ROE | 0.6% |
Bottom line
The strong point of the report is net income of $2.2 million, but it is entirely due to derivative revaluation, not operations. Operating loss widened to $15.1 million, capex reached $332.2 million, and net debt rose to $316.4 million. The Thacker Pass project does not yet produce lithium, and mechanical completion is targeted for late 2027. At the current price the stock is expensive relative to its own history, and the absence of revenue and negative EBITDA prevent fundamental comparison. The real test will come after production starts, but until then the share looks neutral.
Open the company's financial profile LAC →
See also: market overview · valuation map · stock screeners