Cheniere Energy: profit jumps 88.7% on paper derivative revaluations, while the business grows more modestly
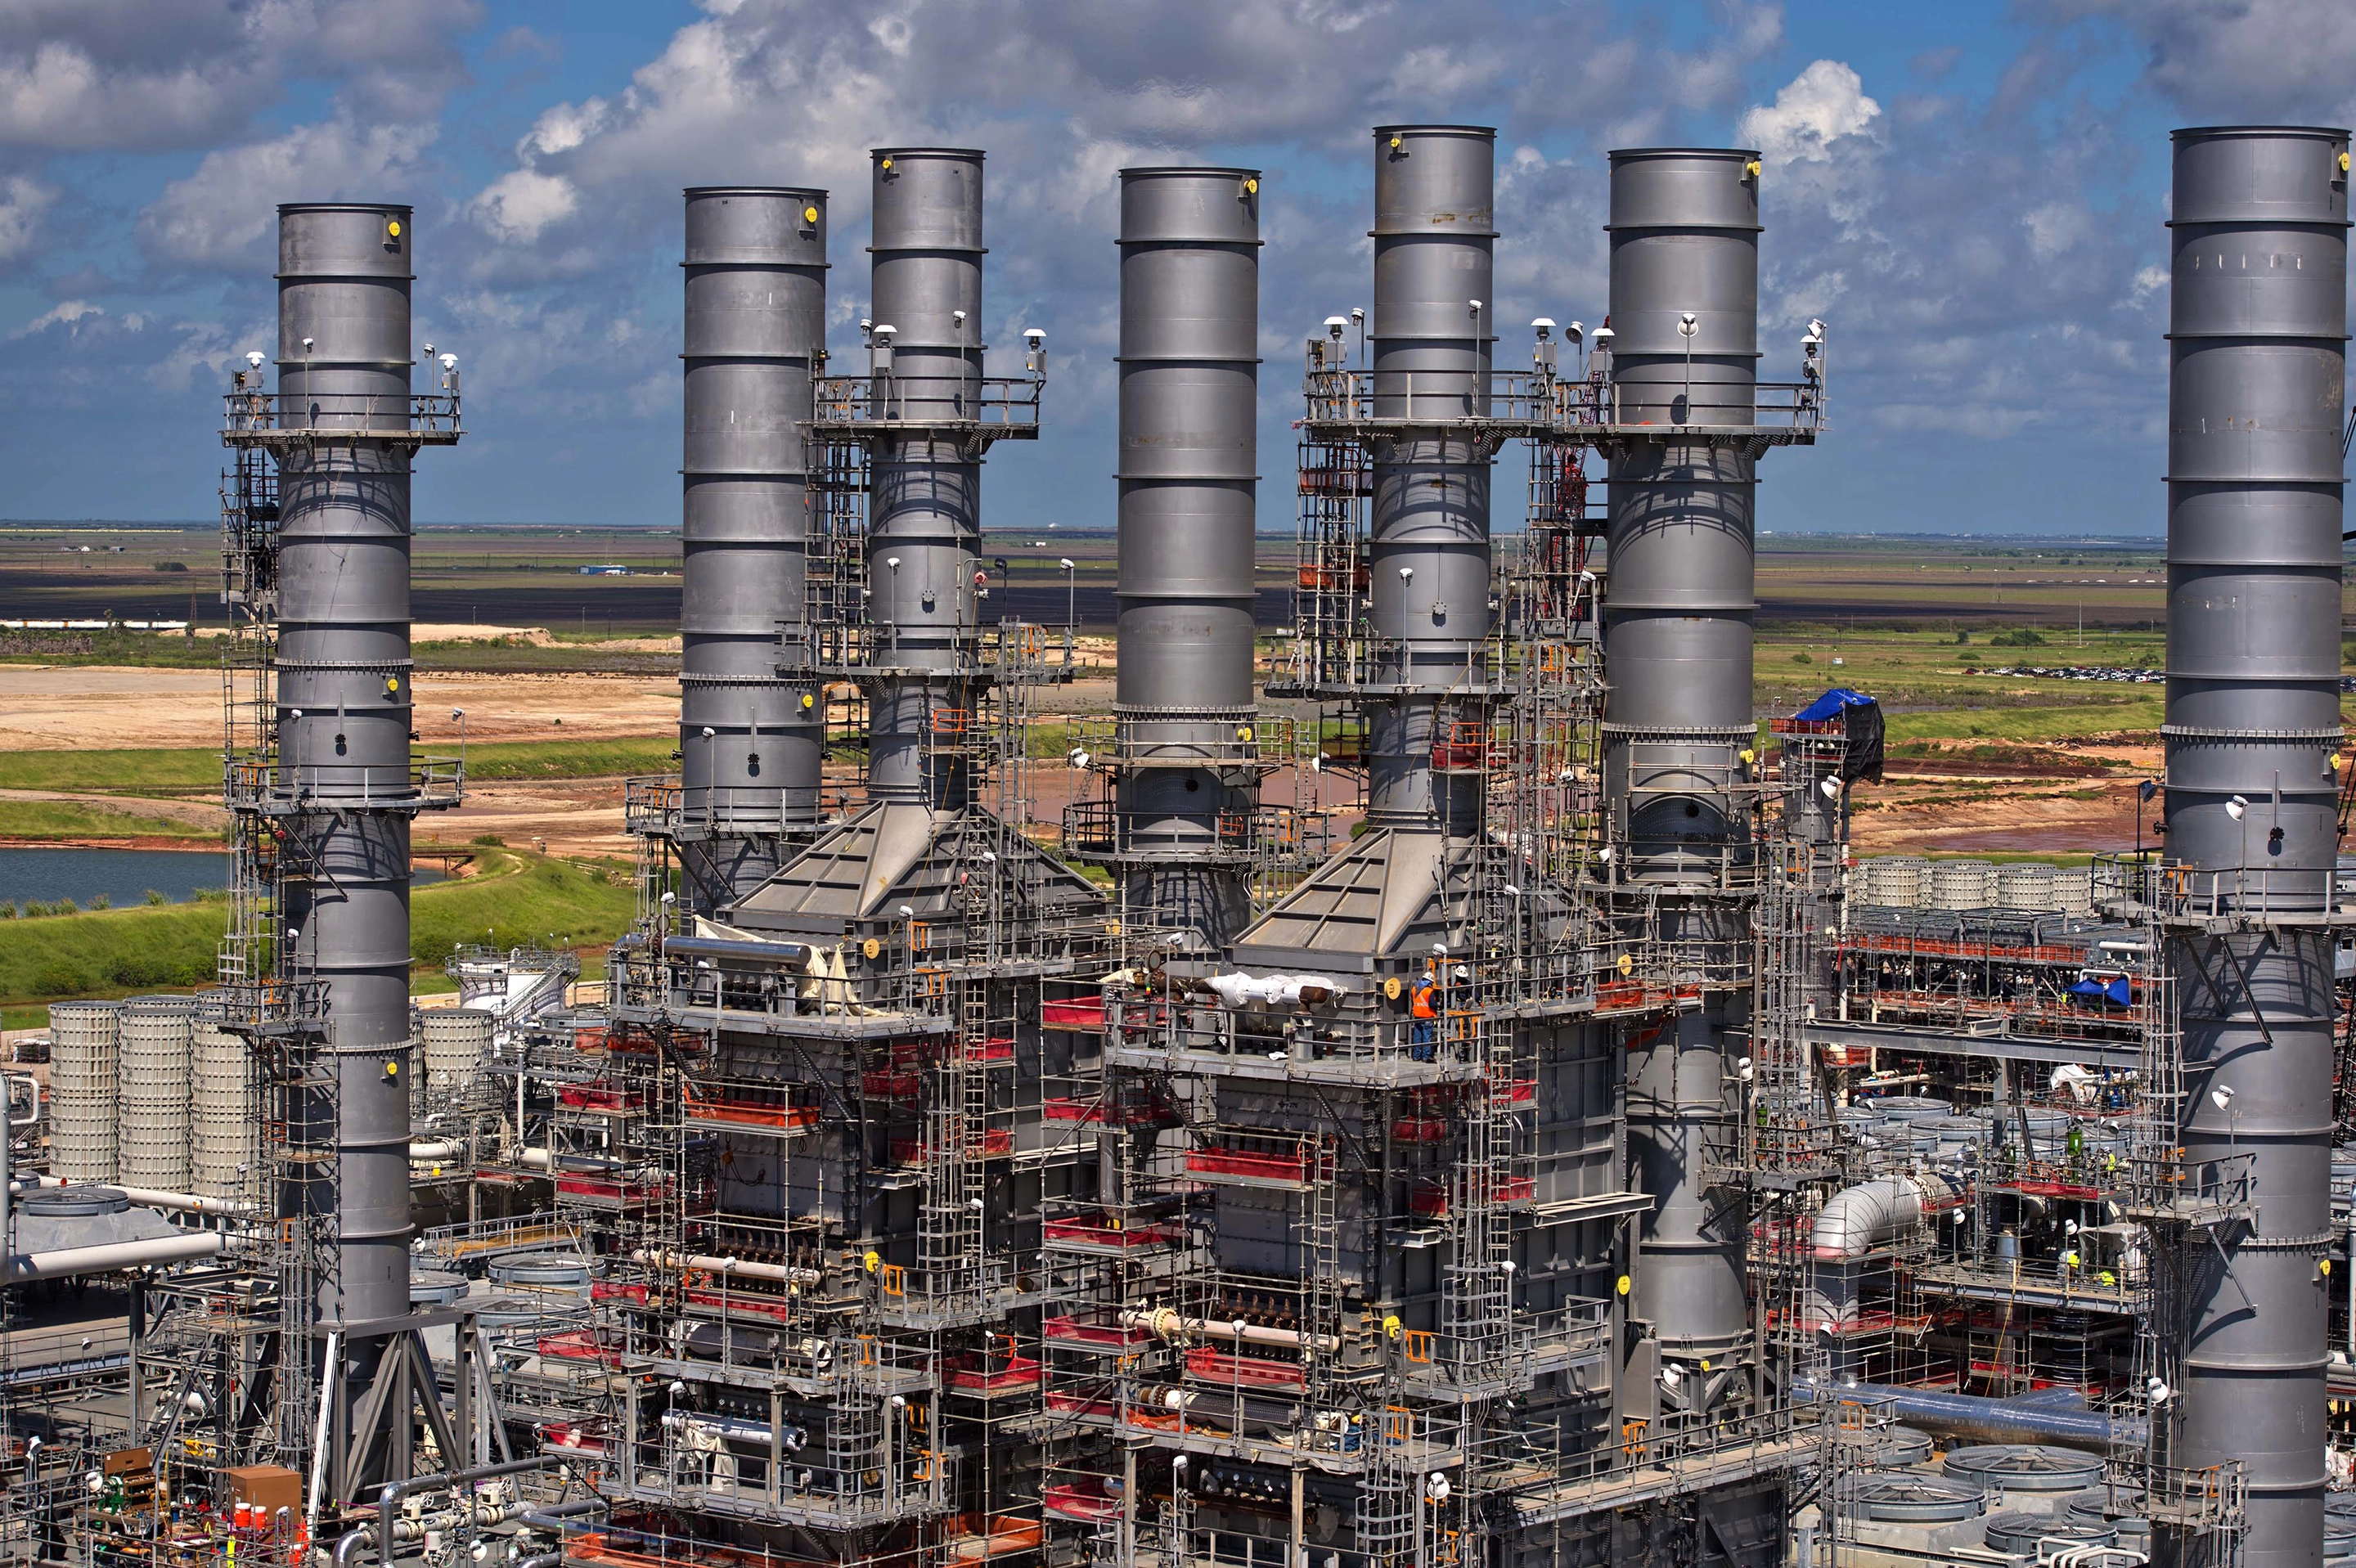
6 августа Cheniere Energy раскрыла результаты за второй квартал 2026 года. Выручка выросла на 22,3% год к году, до 5 677 млн долл., а чистая прибыль – на 88,7%, до 3 068 млн долл., но почти весь прирост прибыли обеспечили неоперационные статьи. На текущей цене акция выглядит скорее непривлекательно: мультипликаторы заметно выше собственной трёхлетней истории, а по модели портала потенциал снижения составляет 40%.
Key takeaways
— Profit jumped 88.7% mostly on paper derivative revaluations
— Revenue grew 22.3% on higher LNG volumes
— EBITDA margin fell from 61.6% to 31.8% due to fair-value volatility of derivatives
— Company raised 2026 EBITDA guidance to $7.90–8.40 billion
— Debt burden remains high: net debt of $25.4 billion, or 3.23 times trailing EBITDA
— Quarterly dividend of $0.555 per share, yield around 0.8% annually
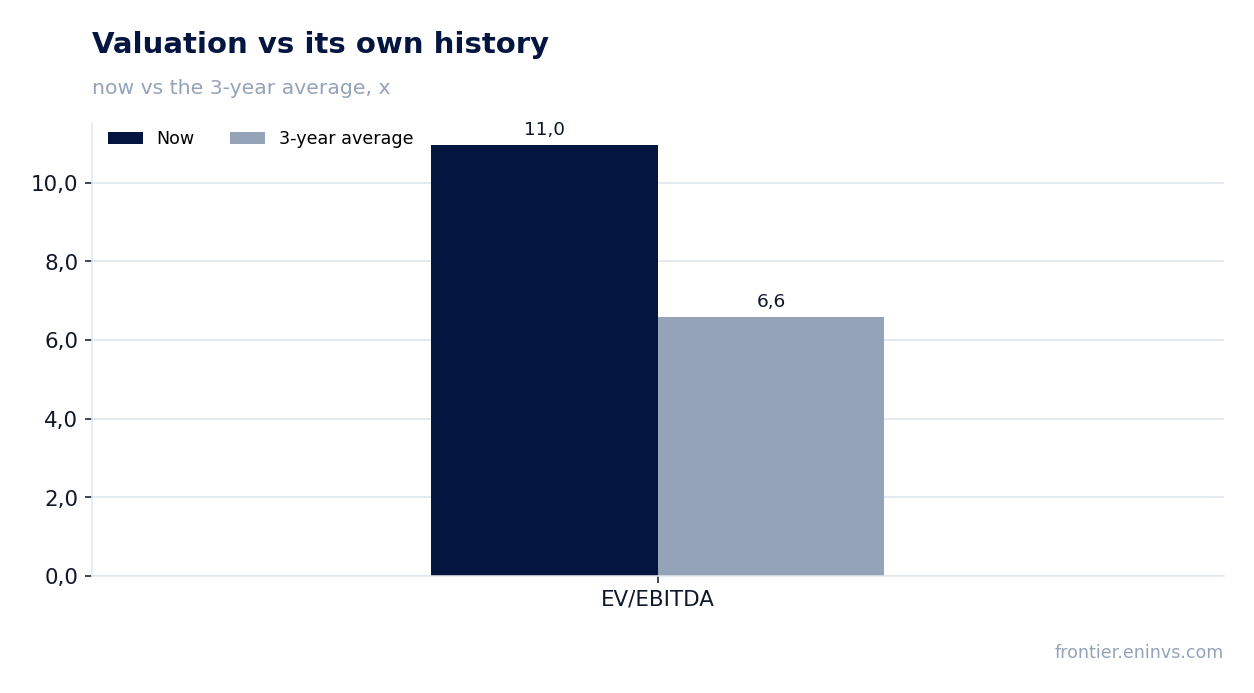
— Shares trade above their own three-year history: EV/EBITDA of 10.97 versus average of 6.59
Attractiveness
Key figures, USD bn
| Metric | Q2 2025 | Q2 2026 | Change |
|---|---|---|---|
| Revenue | 4.64 | 5.68 | +22.3% |
| EBITDA | 2.86 | 1.80 | -36.9% |
| Operating profit | 2.53 | 4.29 | +69.6% |
| Net profit | 1.63 | 3.07 | +88.7% |
| Operating cash flow | 0.83 | 1.58 | +89.9% |
| Capex | 1.02 | 1.18 | +15.2% |
| EBITDA margin | 61.6% | 31.8% | -29.8 pp |
| Net margin | 35.0% | 54.0% | +19.0 pp |
Profit jumped 88.7% mostly on paper derivative revaluations
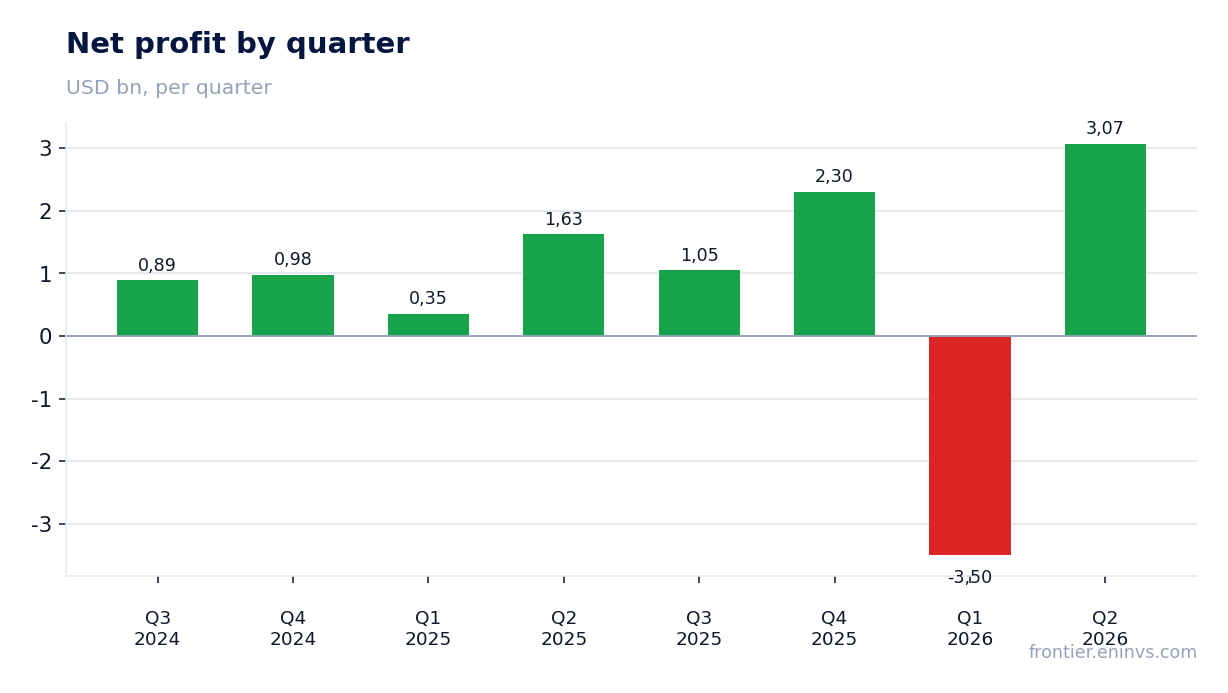
In Q2 2026, Cheniere Energy's net profit reached $3,068 million versus $1,626 million a year earlier. The 88.7% growth looks impressive, but almost all of it comes from a non-operating item: changes in the fair value of derivatives, mainly long-term IPM agreements. The report indicates that the company recorded about $1.4 billion of favorable variances on these instruments before tax and non-controlling interests.
This is paper profit: it reflects the revaluation of contracts for future deliveries, not current cash receipts. Excluding this effect, adjusted net profit would have been $632 million – almost five times less than reported. Investors should focus primarily on operating metrics and cash flows rather than profit swings driven by market volatility.
Revenue grew 22.3% on higher LNG volumes
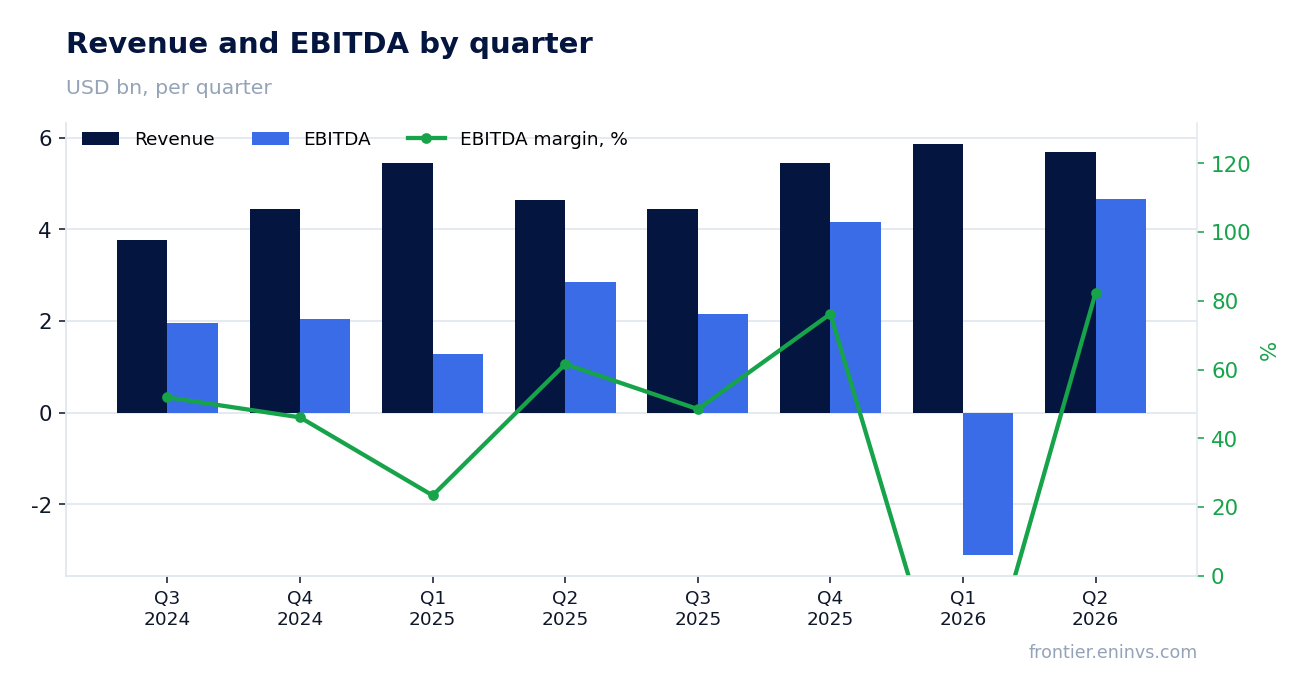
Revenue for Q2 2026 increased by 22.3% year-on-year to $5,677 million. Volumes were the main driver: the company exported 184 LNG cargoes during the quarter versus 154 a year earlier, or 672 TBtu versus 550 TBtu. The volume growth is linked to the commissioning of new capacity at the CCL Stage 3 project: by the end of the quarter, six of the seven mid-scale trains had been brought into operation.
Revenue has been growing for several consecutive quarters: in Q1 2026 it rose 7.8% year-on-year, and in Q2 by 22.3%. The company also raised its 2026 production forecast to 53–54 million tonnes from 52–54 million tonnes, implying further increases in shipments in the second half of the year.
EBITDA margin fell from 61.6% to 31.8% due to fair-value volatility of derivatives
In Q2 2026, the EBITDA margin was 31.8% versus 61.6% a year earlier. The near-halving is not due to deteriorating operations but to accounting for changes in the fair value of derivatives: in Q2 2025 the company recorded a gain on these instruments, while in the reporting quarter it recorded a loss. Excluding this effect, operating dynamics would have been smoother.
Operating profit rose from $2,530 million to $4,290 million, reflecting higher volumes and margins on delivered LNG. However, the net margin of 54.0% versus 35.0% a year earlier is also the result of derivative revaluations, not a sustainable improvement in profitability.
Company raised 2026 EBITDA guidance to $7.90–8.40 billion
Cheniere Energy raised its 2026 Consolidated Adjusted EBITDA guidance from $7.25–7.75 billion to $7.90–8.40 billion, and Distributable Cash Flow from $4.75–5.25 billion to $5.30–5.80 billion. Management cited strong first-half results and improved visibility for the rest of the year.
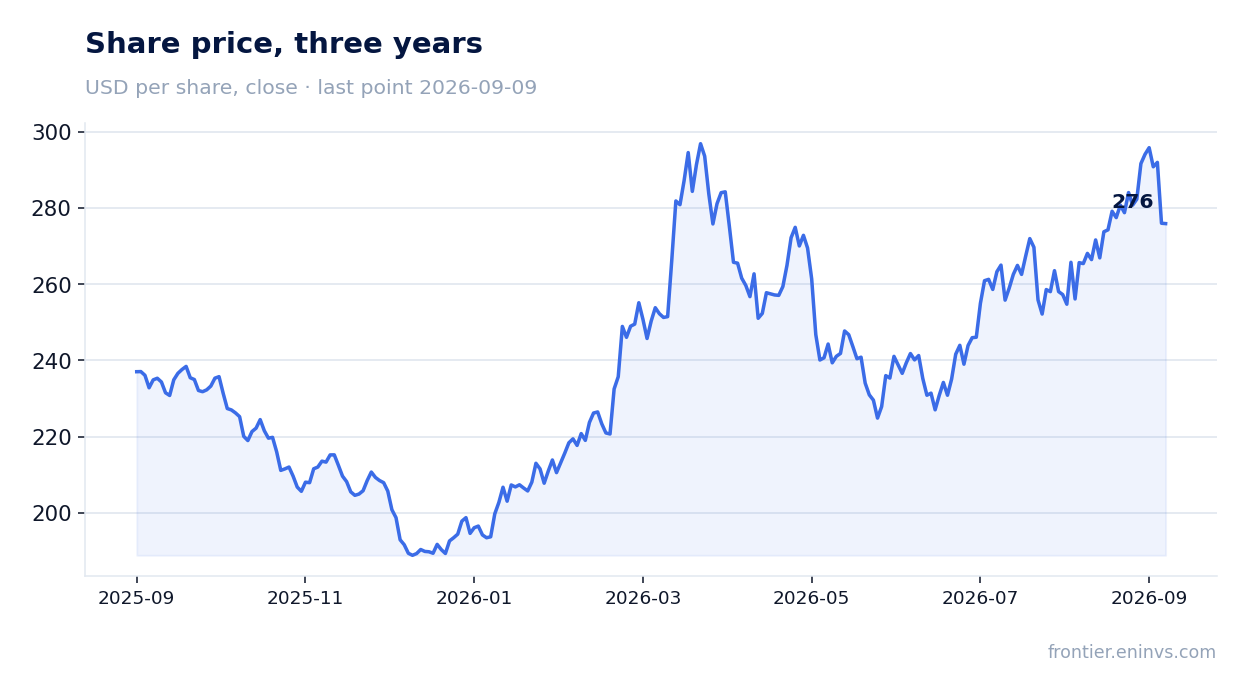
In H1 2026, Consolidated Adjusted EBITDA reached $4.14 billion, already above the lower end of the previous annual guidance. The upgrade is a positive signal, but it has already been priced in: shares rose 4.3% on the release day and 8.3% from the release to September 9.
Debt burden remains high: net debt of $25.4 billion, or 3.23 times trailing EBITDA
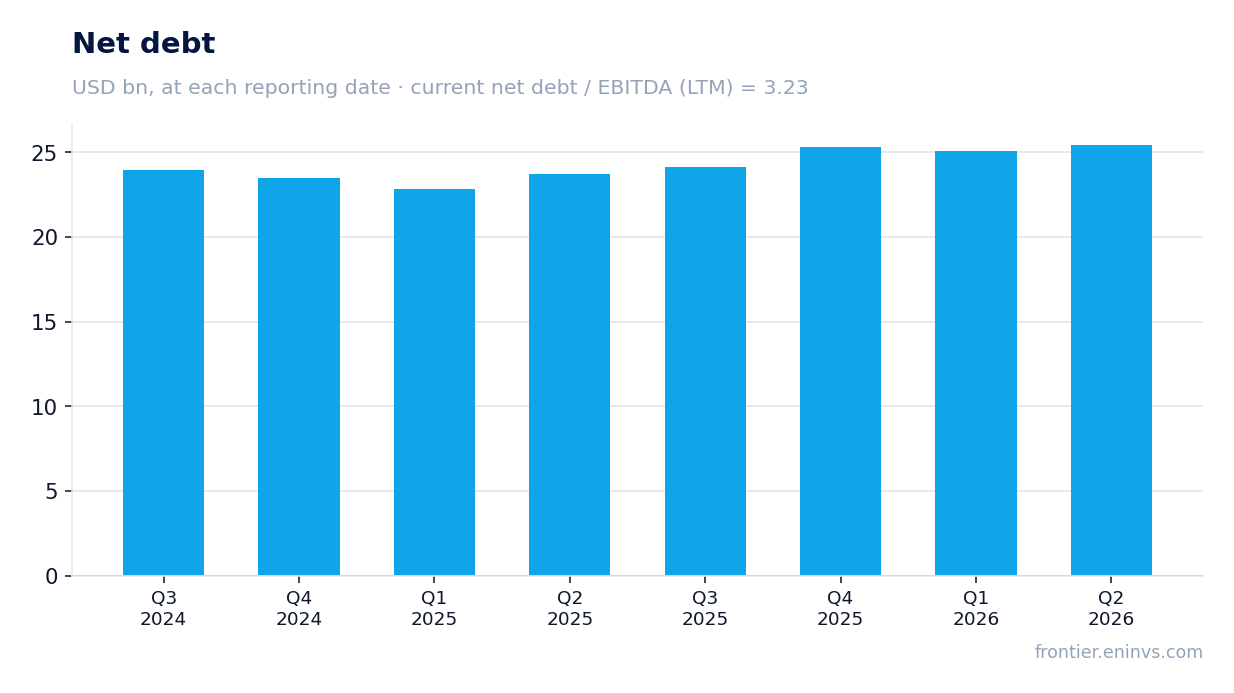
At the end of Q2 2026, Cheniere Energy's net debt stood at $25,347 million, up $0.4 billion from the previous reporting date and $1.7 billion over the trailing twelve months. The ratio of net debt to trailing EBITDA is 3.23, which for a capital-intensive company with long-term contracts is a moderate level but leaves little room for maneuver.
In June, the company issued $1.75 billion in bonds and partially redeemed an earlier $1.5 billion issue, extending the average maturity but not reducing the total. Interest expense for the quarter rose from $237 million to $287 million, reflecting higher debt and rates.
Quarterly dividend of $0.555 per share, yield around 0.8% annually
In July 2026, the board declared a dividend of $0.555 per share for Q2, payable on August 18. Over the trailing twelve months, the company paid $2.22 per share, giving a yield of about 0.8% at the current price – well below the market average and even below US Treasury yields.
The company continues to buy back shares: 2.2 million shares for $550 million in the quarter, and 4.9 million shares for $1.1 billion in the half-year. This supports the price but does not create direct cash flow to shareholders. The dividend policy implies payouts, but at such a low yield, the dividend is hardly a key reason to buy the shares.
Shares trade above their own three-year history: EV/EBITDA of 10.97 versus average of 6.59
The current EV/EBITDA multiple is 10.97 versus a three-year average of 6.59. This means the market values the company 66% higher than its own average over the past three years – even considering volume growth and guidance upgrades, such a premium looks excessive.
The trailing P/E is 20.8, also noticeably above historical levels for companies of this type. According to the portal's model, which re-prices EBITDA at current commodity prices and applies a target EV/EBITDA, the share's downside potential is -40% from the current price. This is not a market consensus but the portal's own estimate, yet it suggests that most of the positive news is already priced in.
Valuation on the latest reported figures
| Metric | Value |
|---|---|
| Market cap | 60.8 bn USD |
| P/E (LTM) | 20.8 |
| EV/EBITDA (LTM) | 11.0 |
| P/B | 7.68 |
| Net debt / EBITDA (LTM) | 3.23 |
| Operating cash flow (LTM) | 5.50 bn |
| ROE | 246.8% |
| Dividend yield (12m) | 0.8% |
| EV/EBITDA, 3-year average | 6.6 |
Bottom line
Cheniere Energy reported strong revenue and profit growth, but these figures reflect not only improved operations but also significant paper revaluations of derivatives. The company raised its 2026 guidance, confirming management's confidence in continued volume growth. However, at the current price, shares trade at a premium to their own history, and the dividend yield remains minimal. The key question for a holder is whether further production and margin growth will justify such a valuation, especially if LNG prices decline.
Open the company's financial profile LNG →
See also: market overview · valuation map · stock screeners