Matson: China service carried the quarter, but the multiple is already twice its own history
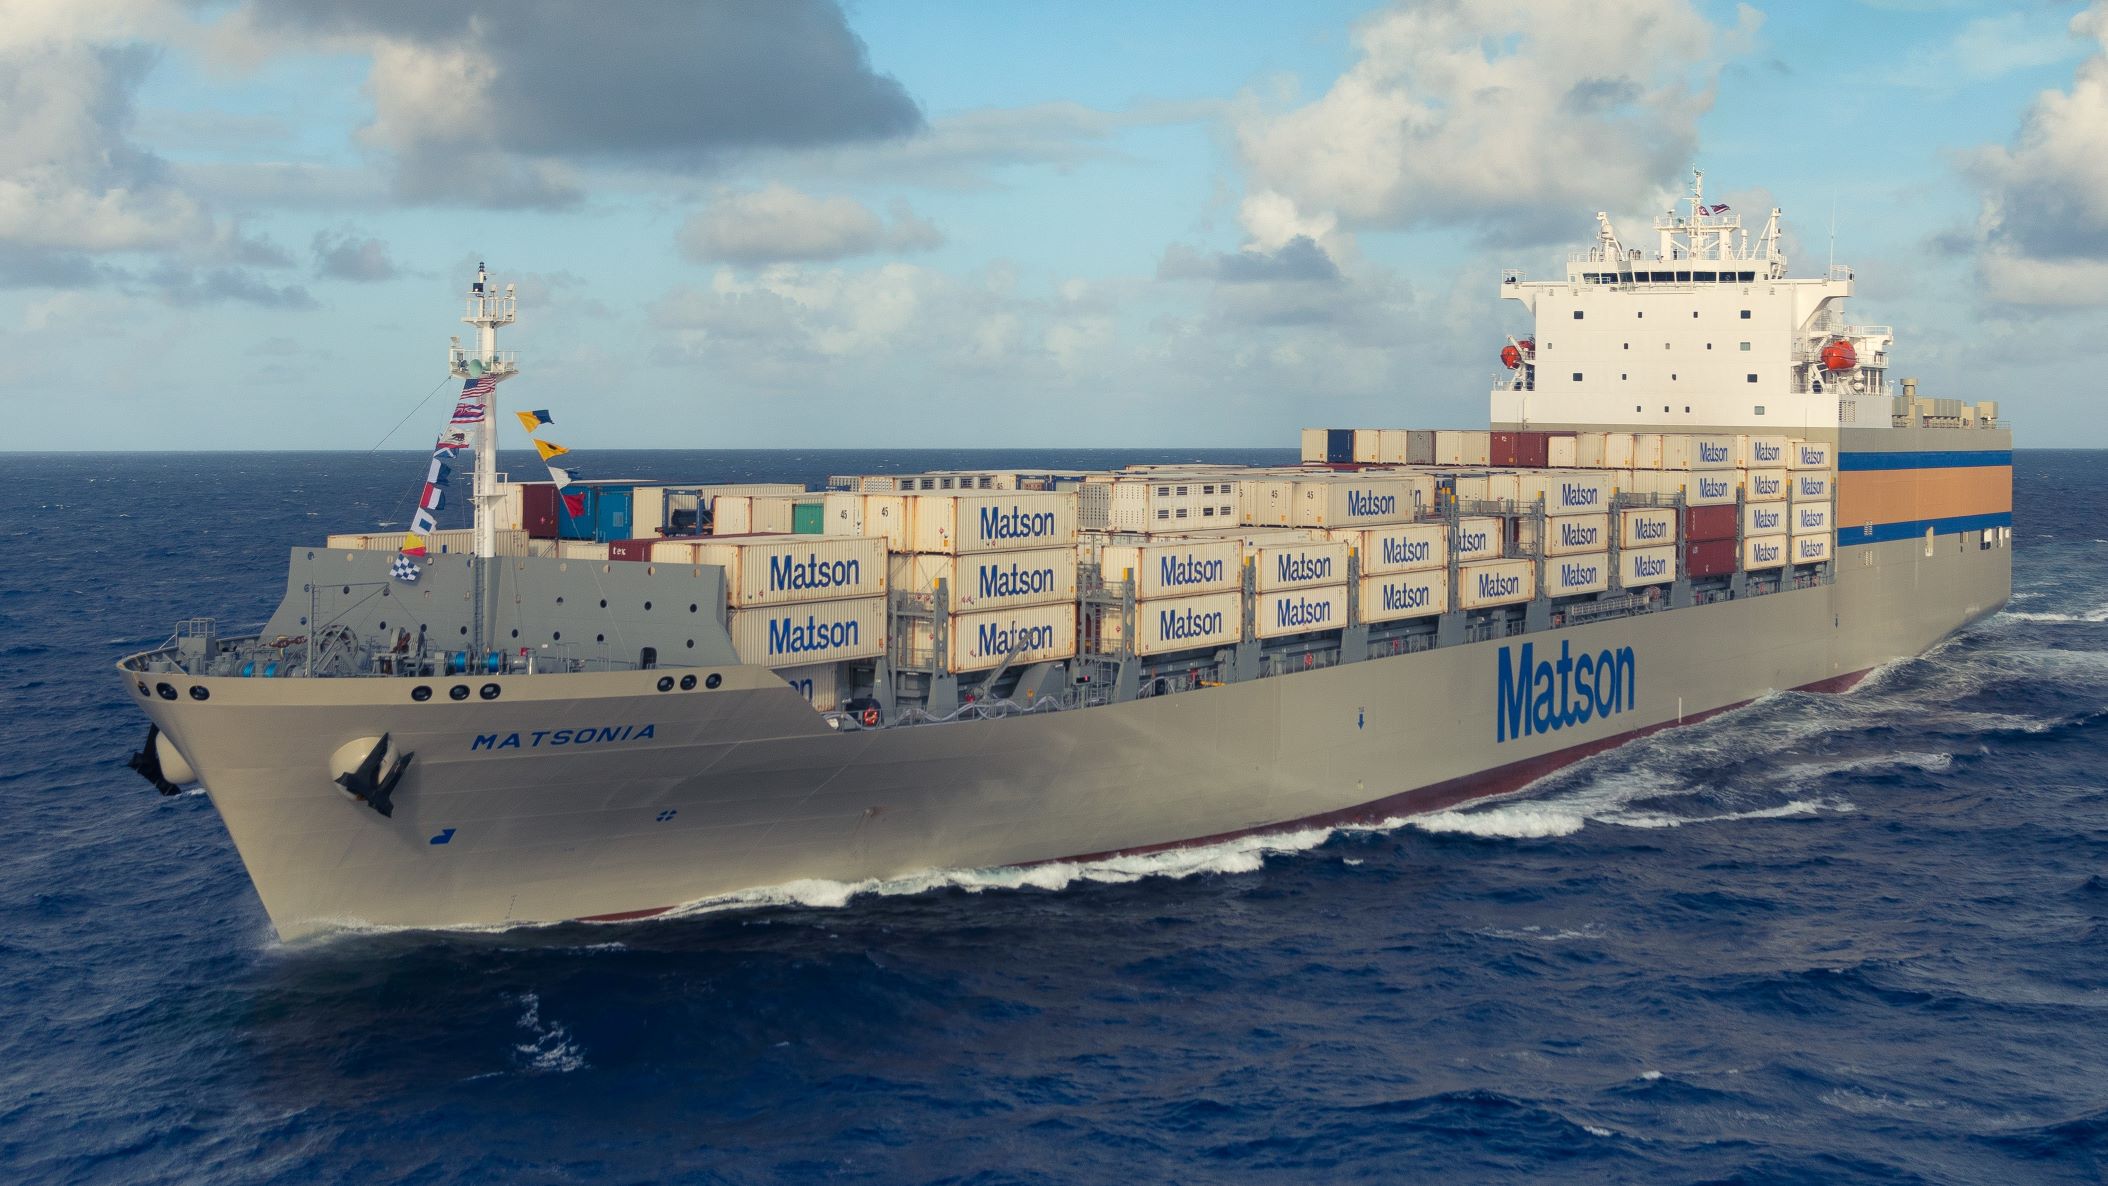
On July 15, Matson published preliminary results for the second quarter of 2026. Revenue rose 16.7% year on year to $969.4 million, EBITDA added 7.1% to $211.0 million, and net income jumped 36.6% to $129.4 million. Growth came from the China service, where container volume increased 15.2% on high rates and e-commerce demand, while Hawaii and Alaska declined. At the current price the stock looks neutral: operating momentum is strong, but EV/EBITDA of 11.9x against a three-year average of 8.3x and a dividend yield of just 0.64%.
Key takeaways
— Revenue added 16.7% thanks to the China service, where container volume rose 15.2%
— EBITDA grew only 7.1%, and the margin fell to 21.8% from 23.7% a year earlier
— Net income rose 36.6%, but preliminary operating income is below last year's level
— Leverage of 0.94 EBITDA LTM is moderate, but the direction of change is not disclosed
— A 0.64% dividend yield does not compensate for the China-service bet
— EV/EBITDA of 11.9x against a three-year average of 8.3x – the stock trades above its own history
Attractiveness
Key figures, USD bn
| Metric | Q2 2025 | Q2 2026 | Change |
|---|---|---|---|
| Revenue | 0.83 | 0.97 | +16.7% |
| EBITDA | 0.20 | 0.21 | +7.1% |
| Operating profit | 0.11 | 0.16 | +40.6% |
| Net profit | 0.09 | 0.13 | +36.6% |
| Operating cash flow | 0.11 | 0.14 | +30.3% |
| Capex | 0.09 | — | — |
| EBITDA margin | 23.7% | 21.8% | -1.9 pp |
| Net margin | 11.4% | 13.3% | +1.9 pp |
Revenue added 16.7% thanks to the China service, where container volume rose 15.2%
Revenue in the second quarter of 2026 was $969.4 million, up 16.7% from a year earlier. This is the strongest quarterly growth in at least five quarters: in the first quarter of 2026 revenue declined 3.1%, and in the second quarter of 2025 it fell 2.0%.
The main driver is the China service, where container volume rose 15.2% year on year. The press release attributes this to significantly higher demand: the prior-year base included a collapse in Transpacific demand due to tariffs imposed in April 2025. CEO Matt Cox noted that the CLX and MAX services saw higher-than-expected freight rates and demand across e-commerce, garments and e-goods against a backdrop of tighter supply conditions in the Transpacific tradelane.
Other directions showed mixed dynamics. Hawaii declined 1.1% on lower general demand, Alaska fell 2.3% on lower export seafood volume, Guam rose 4.4%, and other containers dropped 11.4%. Thus, all the growth came from one direction, and that is a key risk for revenue sustainability.
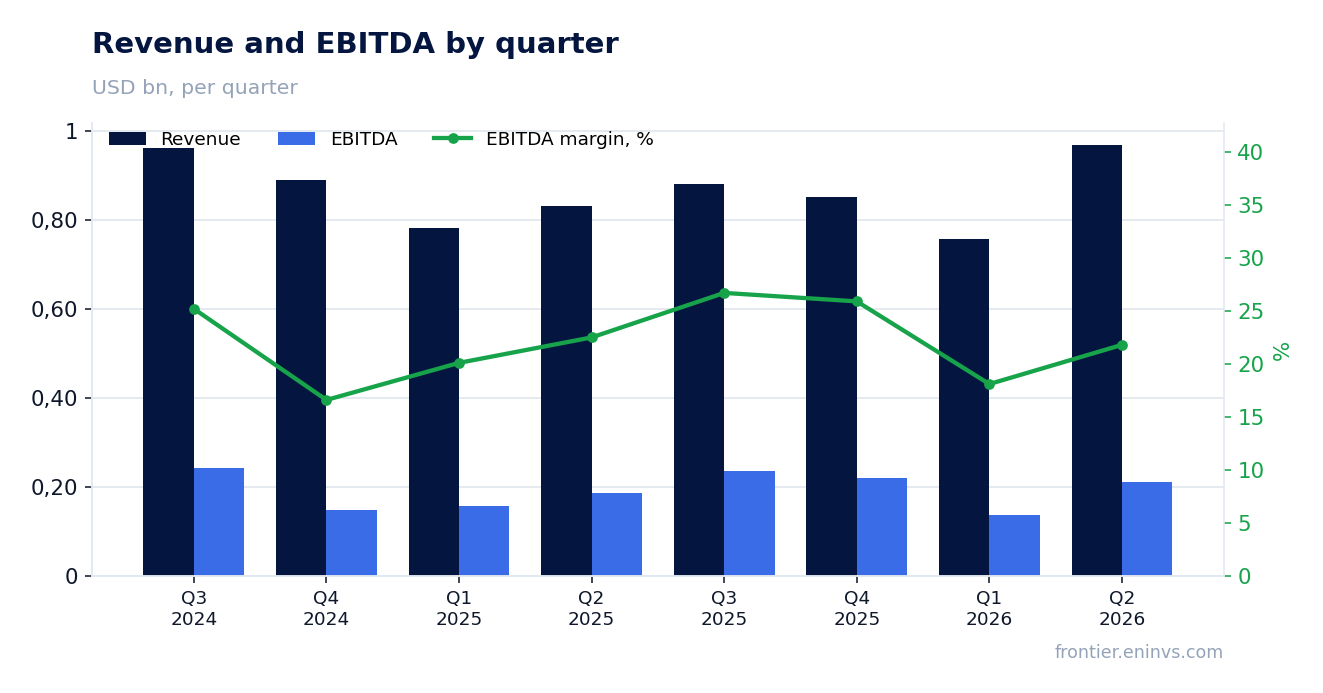
EBITDA grew only 7.1%, and the margin fell to 21.8% from 23.7% a year earlier
EBITDA in the second quarter of 2026 was $211.0 million, up 7.1% from a year earlier. There is growth, but it is several times slower than revenue: 7.1% versus 16.7%. This means that each additional unit of revenue brought less profit than the average last year.
The EBITDA margin fell to 21.8% from 23.7% a year earlier. The reason is cost growth outpacing revenue. The press release does not disclose cost details, but a margin decline amid strong revenue growth indicates that either variable costs (fuel, port fees, labour) rose, or the revenue mix shifted toward less profitable services.
For an investor this is an important signal: operating leverage is not working at full capacity. If the margin does not recover next quarter, the market may revise its valuation downward, even if volumes remain high.
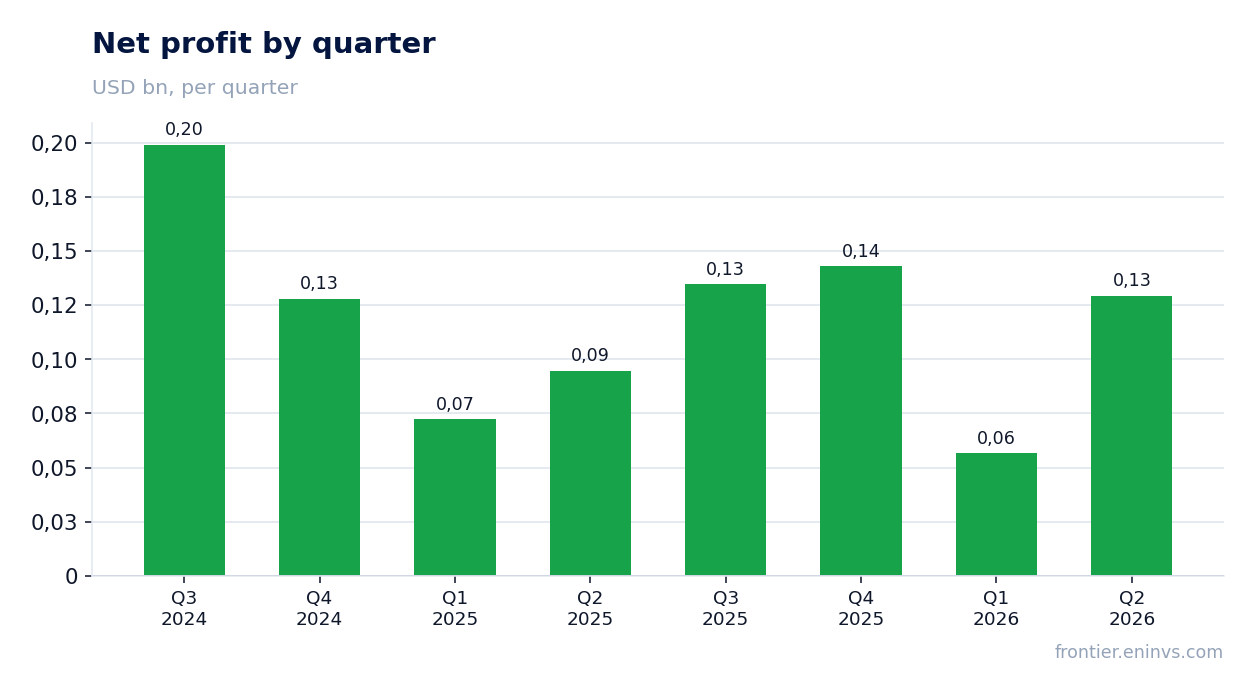
Net income rose 36.6%, but preliminary operating income is below last year's level
Net income in the second quarter of 2026 was $129.4 million, up 36.6% from a year earlier. Net income growth significantly outpaces EBITDA growth, indicating the influence of factors below the operating line: possibly lower interest on debt, an improved financial result, or a lower tax burden.
However, operating income, according to preliminary data from the press release, is expected in the range of $153.0–160.0 million. A year earlier, in the second quarter of 2025, operating income was $113.0 million. Thus, the preliminary range implies operating income growth of 35–42% year on year, which contradicts the FACTS data, where operating income for the second quarter of 2026 is stated as $158.9 million. This discrepancy may be due to methodology: in the FACTS, operating income may or may not include certain items.
For an investor, it is important that net income grows faster than operating income, and this may be a sign of one-off factors. Without a detailed income statement, it is difficult to say how sustainable this growth is.
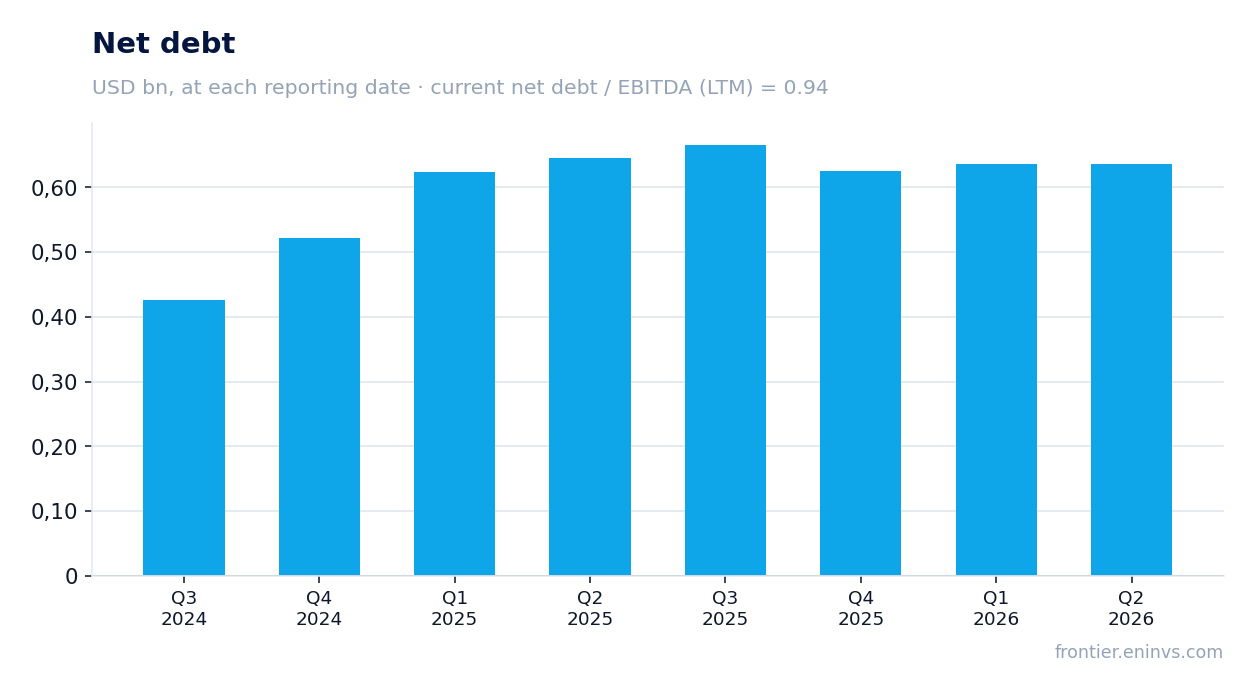
Leverage of 0.94 EBITDA LTM is moderate, but the direction of change is not disclosed
Net debt at the latest reporting date was $624.9 million, and the ratio of net debt to EBITDA for the trailing twelve months was 0.94. This is a moderate level: the company can service its debt without strain, even with volatile earnings.
The press release states that total debt as of June 30, 2026 was $341.3 million, and cash and cash equivalents were $119.3 million, excluding $345.8 million on deposit within the Capital Construction Fund. These fund assets are likely not included in the net debt calculation, which explains the difference between total debt and net debt.
The direction of change in leverage is not disclosed: the FACTS do not contain a net debt / EBITDA value for the previous period. Therefore, it cannot be stated that leverage rose or fell – only the current level can be noted. For an investor, this means credit risk remains low, but the dynamics are unclear.
A 0.64% dividend yield does not compensate for the China-service bet
The dividend yield over the trailing twelve months is 0.64%. This is a low level that does not provide significant support for shareholders. For comparison, the key US rate at the time of the report remains at a level significantly exceeding this yield, making the dividend unattractive for income investors.
The company did not declare a dividend alongside the preliminary results. The press release contains no information on the size or date of the next payment. This means the current yield reflects past payments, not future ones.
If profit continues to grow, the company may increase the dividend, but for now the yield is so small that it plays no role in the investment decision. The main return of capital comes through share buybacks: in the second quarter of 2026, Matson repurchased about 0.3 million shares for $67.8 million. This is a more significant return channel than dividends.
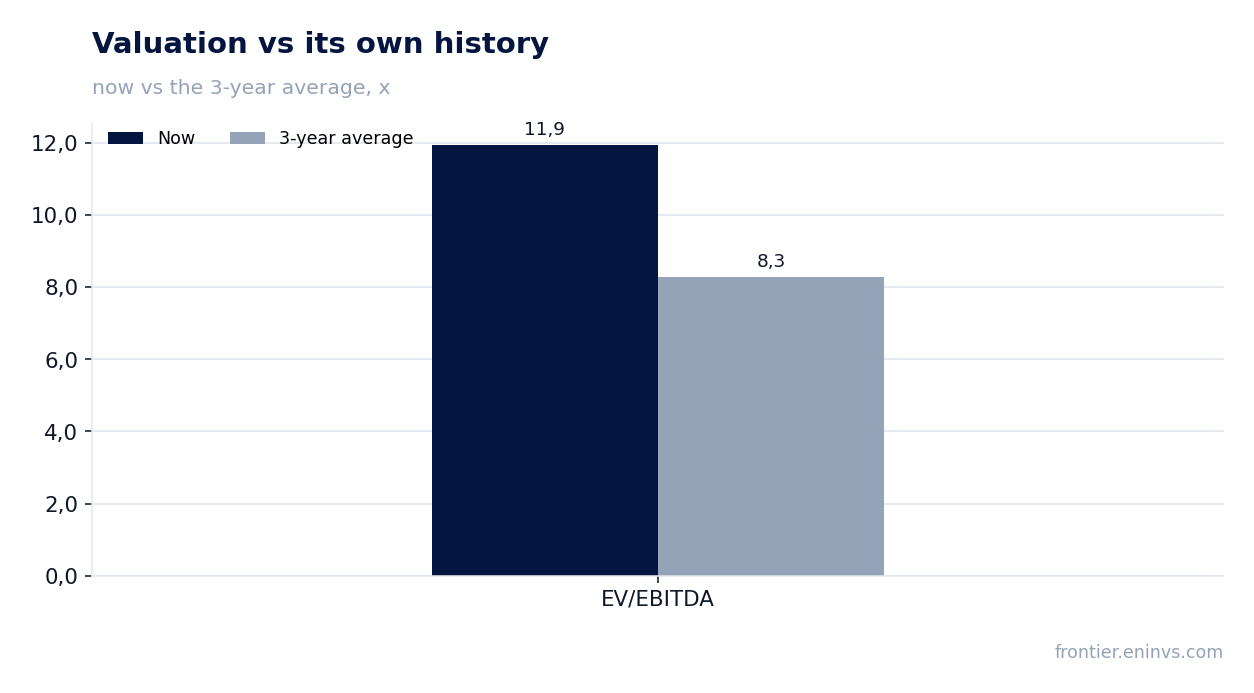
EV/EBITDA of 11.9x against a three-year average of 8.3x – the stock trades above its own history
The current EV/EBITDA multiple for the trailing twelve months is 11.9x. The three-year average is 8.3x. This means the stock trades about 44% above its historical valuation. Such a gap requires explanation: either the market expects sustainable profit growth, or the stock is overvalued.
The P/E for the trailing twelve months is 15.8x, which does not look extreme relative to the market, but is also above historical levels. Return on equity (ROE) is 18.8%, indicating efficient use of capital.
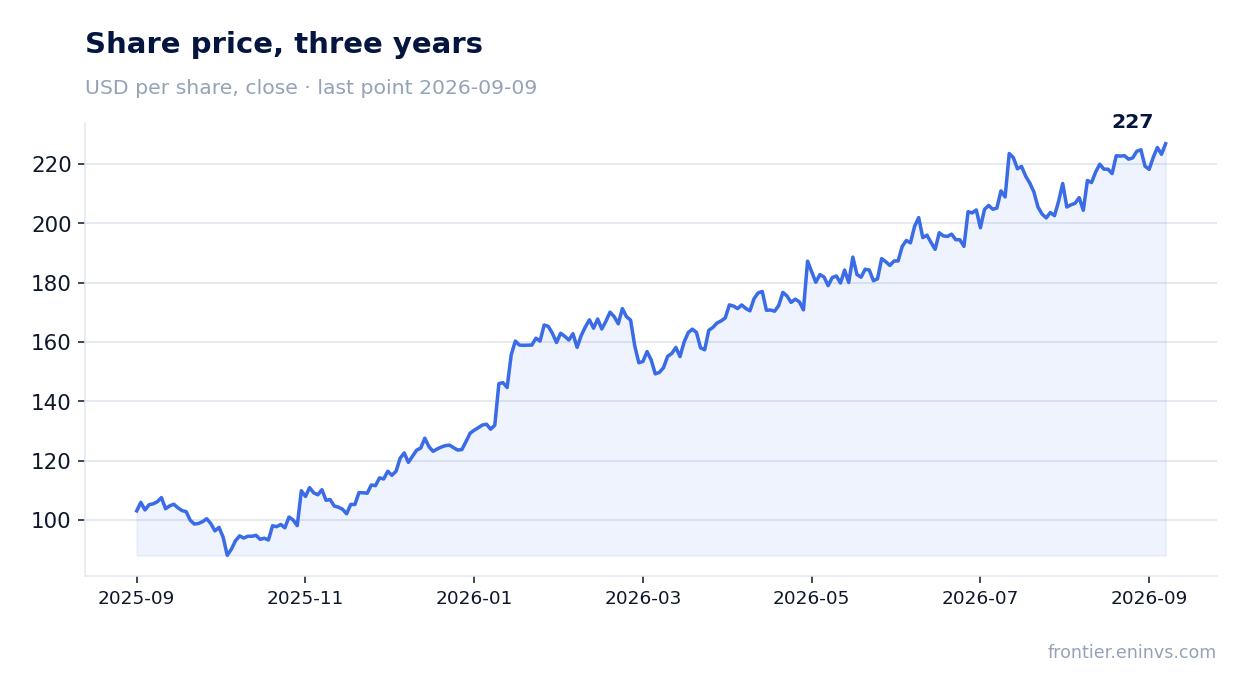
Market capitalisation is $7.3 billion. At the current price, the stock has risen 7.5% from the release date to September 9, 2026, indicating a positive market reaction to the results. However, on the release day the stock fell 1.0%, indicating a mixed initial reaction.
For an investor, the key question is whether the company can justify the premium to its own history. If China-service growth proves sustainable, the multiple may remain high. If not, a correction toward average levels is likely.
Valuation on the latest reported figures
| Metric | Value |
|---|---|
| Market cap | 7.30 bn USD |
| P/E (LTM) | 15.8 |
| EV/EBITDA (LTM) | 11.9 |
| P/B | 2.65 |
| Net debt / EBITDA (LTM) | 0.94 |
| Operating cash flow (LTM) | 0.55 bn |
| ROE | 18.8% |
| Dividend yield (12m) | 0.6% |
| EV/EBITDA, 3-year average | 8.3 |
Bottom line
Bottom line: Matson delivered a strong quarter in revenue and net income, but the quality of this growth raises questions. All the growth came from the China service, where volumes rose 15.2% amid favourable market conditions; other directions either stagnated or declined. The EBITDA margin fell to 21.8% from 23.7%, and preliminary operating income may be below last year's level despite higher net income. Leverage is moderate at 0.94 EBITDA LTM, but a dividend yield of just 0.64% provides no support. The key question for a holder is whether the company can sustain high rates and volumes in the China service to justify an EV/EBITDA of 11.9x against a historical 8.3x. At the current price the stock looks neutral: there is operating momentum, but it is localised and largely priced in.
Open the company's financial profile MATX →
See also: market overview · valuation map · stock screeners