Ring Energy: Q2 profit is $42.2m paper gain, free cash flow just $4.4m

On 5 August Ring Energy reported second-quarter 2026 results. Revenue rose 26.7% year on year to $104.7m, net income reached $64.8m against $20.6m a year earlier, but $42.2m of that came from an unrealised mark-to-market gain on derivatives. Adjusted EBITDA added 6% to $54.5m, while adjusted free cash flow was just $4.4m. At 3.0 EV/EBITDA against its own three-year average of 3.0 and with the portal model pointing to -87% upside, the share looks unattractive.
Key takeaways
— Revenue rose 26.7% year on year, but the driver was the oil price, not production volumes
— Of the $64.8m net income, $42.2m is a paper gain on derivatives
— Adjusted EBITDA added 6% even as production fell 6%
— Free cash flow of $4.4m does not even cover the dividend base
— Debt fell $66m in the quarter but remains above the 1.25x target
— At 3.0 EV/EBITDA the valuation offers no cushion against its own three-year history
Attractiveness
Key figures, USD bn
| Metric | Q2 2025 | Q2 2026 | Change |
|---|---|---|---|
| Revenue | 0.08 | 0.10 | +26.7% |
| EBITDA | 0.05 | 0.07 | +43.5% |
| Operating profit | 0.02 | 0.05 | +114.2% |
| Net profit | 0.02 | 0.06 | +214.0% |
| Operating cash flow | 0.03 | 0.04 | +22.5% |
| Capex | 0.02 | 0.04 | +126.9% |
| EBITDA margin | 59.4% | 67.2% | +7.8 pp |
| Net margin | 25.0% | 61.9% | +36.9 pp |
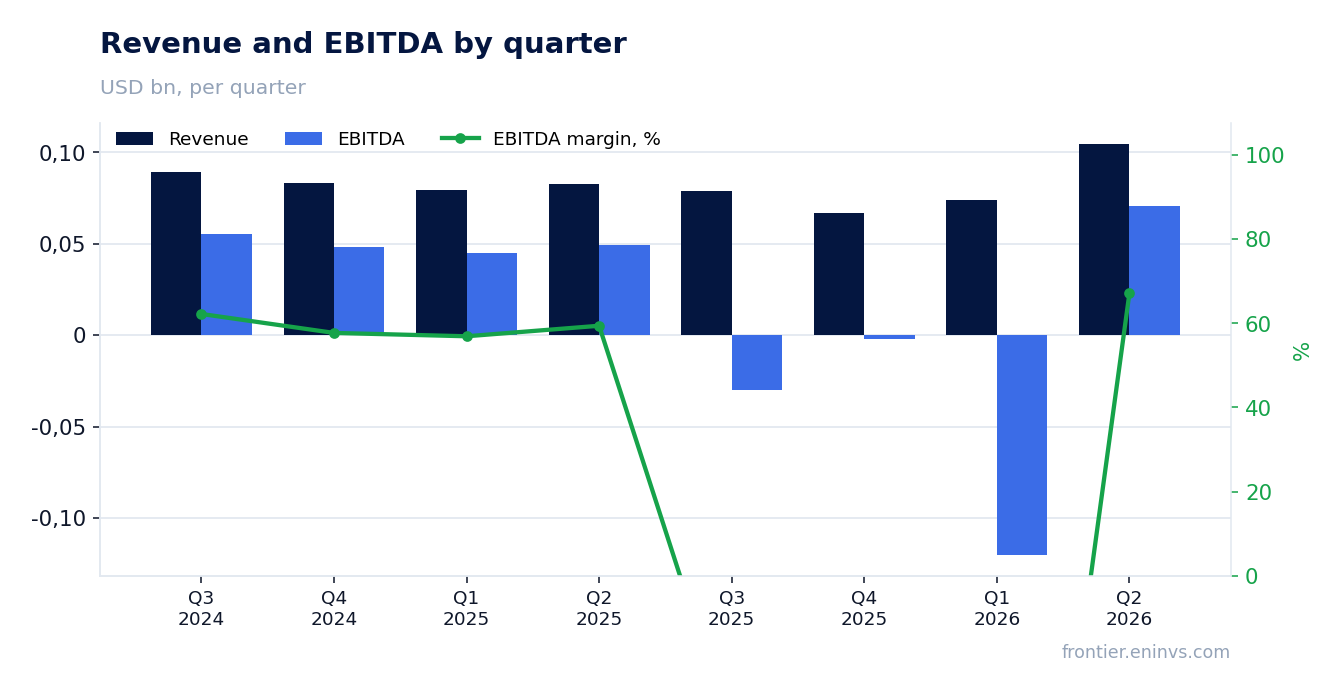
Revenue rose 26.7% year on year, but the driver was the oil price, not production volumes
Second-quarter 2026 revenue came to $104.7m, up 26.7% from $82.6m a year earlier. Yet production fell 6% to 19,990 barrels of oil equivalent per day, and oil output dropped 13% to 12,683 barrels per day. The entire increase came from price: the average realised price per barrel rose 35% to $57.55, and for oil it jumped 52% to $95.45.
The quarter-on-quarter increase is even sharper — 42% from $73.7m in the first quarter, when the realised barrel price was $42.30. The company sold roughly the same volumes as at the start of the year, but at a very different price. That makes the report hostage to the commodity cycle: if oil retreats to first-quarter levels, revenue falls back into the $70ms.
For an investor this means operating leverage cuts both ways. The company is not growing production — it is shrinking it, while the market pulls revenue higher. Without volume growth, the sustainability of this result rests entirely on price.
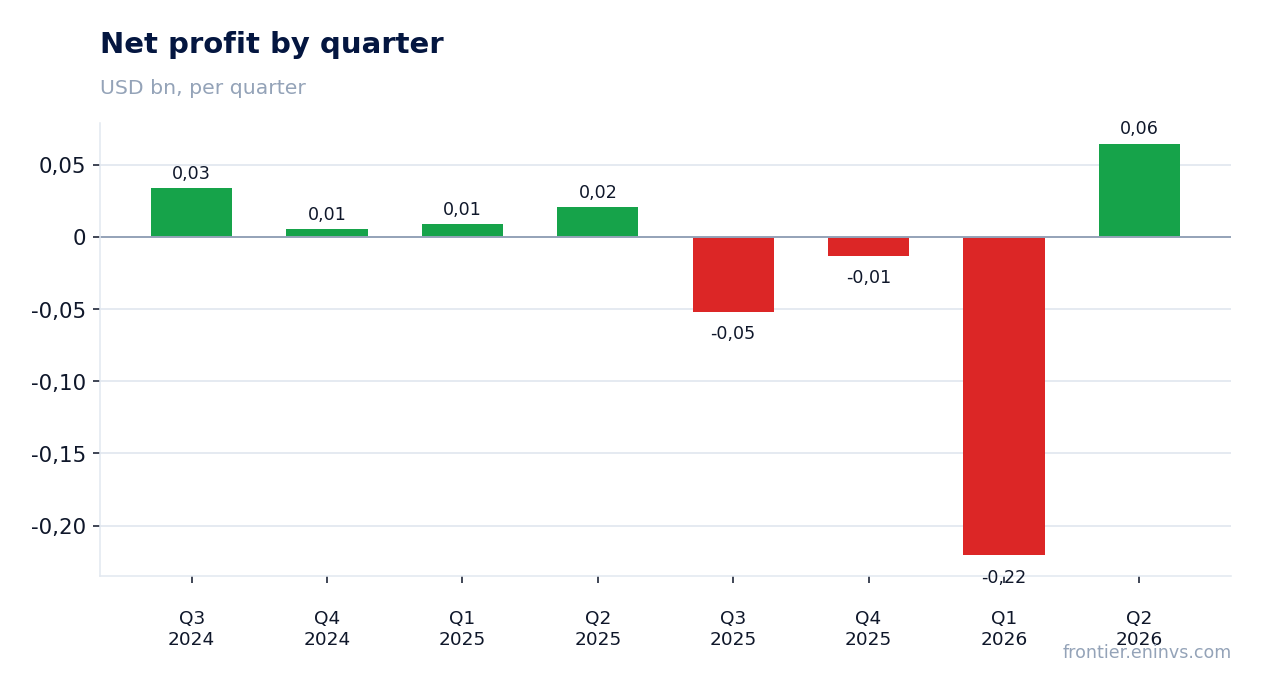
Of the $64.8m net income, $42.2m is a paper gain on derivatives
Second-quarter 2026 net income was $64.8m against $20.6m a year earlier. But it includes an unrealised gain on derivatives of $42.2m — not cash, but a mark-to-market adjustment to the value of hedges. Excluding it, adjusted net income was $24.0m, or $0.10 per diluted share.
The gap between reported and adjusted profit is huge: $64.8m versus $24.0m. The realised loss on hedges in the quarter was $18.5m — the company paid out on contracts because oil prices rose above the protection levels. In other words, hedging cost money this quarter, while the paper revaluation produced profit.
Year on year net income rose 214%, but that figure is misleading because of the low base and the one-off nature of the revaluation. Adjusted profit rose 118% to $24.0m — a more honest benchmark. For a holder, the key point is that earnings quality this quarter was low: the paper gain can just as easily reverse into a loss if prices fall.
Adjusted EBITDA added 6% even as production fell 6%
Second-quarter 2026 adjusted EBITDA was $54.5m, up 6% from $51.5m a year earlier. Production fell 6%, while revenue rose 27%. The gap is explained by the oil price rising faster than costs: lease operating expense per barrel fell to $10.12 from $10.45 a year earlier.
The report states an adjusted EBITDA margin of 52% against 62% a year earlier — a decline, not growth. However, the FACTS give an EBITDA margin of 67.2% versus 59.4% a year earlier. The discrepancy is due to different bases: the report calculates margin on revenue after all operating costs, while the FACTS use revenue before deductions. For analysis, what matters more is that absolute EBITDA grew, while the reported margin fell because of higher production taxes and depreciation.
EBITDA growth of 6% on a 6% production decline is the result of price leverage, not operational improvement. The company cut capital spending on drilling in the first half, which led to lower production but saved cash. The question is whether it can hold EBITDA if the oil price retreats.
Free cash flow of $4.4m does not even cover the dividend base
Second-quarter 2026 adjusted free cash flow was $4.4m against $24.8m a year earlier — a drop of 82%. Operating cash flow was $40.8m, but capital expenditure absorbed $43.2m, and after adjustments less than $5m remained. For a company with a market capitalisation of $307m, that is very little.
For the first half of 2026, free cash flow was $4.6m against $30.6m a year earlier — a fall of 85%. The company has been cash flow positive for over six years, but this year the flow has nearly dried up. The reason is higher capital spending: in the first half it rose 58% to $77.7m as Ring expands its drilling programme.
For the second half of 2026 the company plans to spend $80–100m on capital, and in 2027 — $135–165m. That means free cash flow will remain under pressure. Management says the programme will be funded mainly from operating cash flow, but at current oil prices and capital spending levels the gap may be covered by debt.
Debt fell $66m in the quarter but remains above the 1.25x target
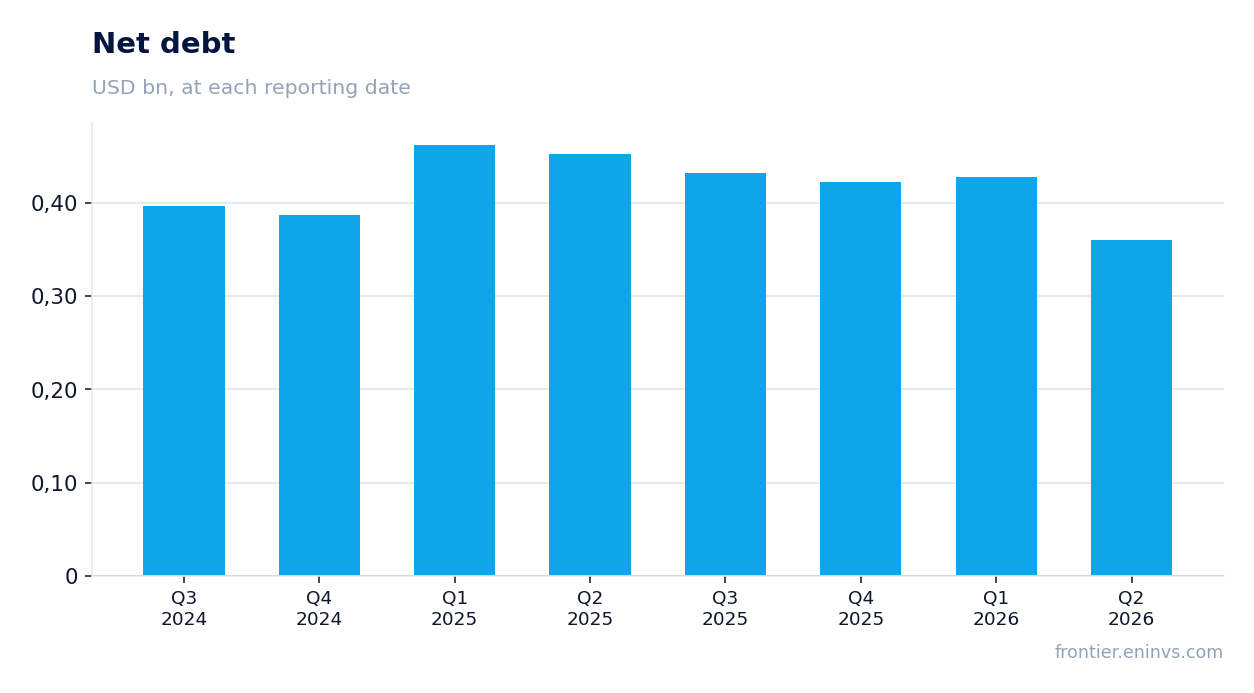
In the second quarter of 2026 Ring reduced borrowings under its revolving credit facility by $66m to $360m as of 30 June. Total liquidity rose to $226.1m, including $225.0m available under the credit facility and $1.1m in cash. This was made possible by a $64.8m equity offering completed during the quarter.
Net debt at the end of the quarter was $360.4m, down 0.1bn roubles from the previous reporting date. However, relative to the 1.25x leverage target management cites, the current level remains high. The ratio of net debt to trailing twelve-month EBITDA can be estimated at $360.4m against EBITDA, but the exact figure is not disclosed. The company intends to continue reducing debt, but depends on market conditions and capital spending levels.
Interest expense fell to $8.4m from $11.8m a year earlier — a saving of 29%. This is the result of both lower debt and lower rates. But even so, interest expense eats a significant portion of EBITDA: $8.4m against $54.5m EBITDA — about 15%. For a company with a $307m market capitalisation, debt load remains a key risk.
At 3.0 EV/EBITDA the valuation offers no cushion against its own three-year history
Ring Energy's current EV/EBITDA is 3.0 — exactly at its own three-year average of 3.0. This means the market values the company the same as on average over the past three years, despite revenue and EBITDA growth in the latest quarter. There is no cushion against the historical multiple.
Market capitalisation is $307.3m, net debt is $360.4m, giving an EV of about $667.7m. With trailing twelve-month EBITDA estimated from quarterly data, the multiple is indeed around 3.0. For an oil and gas company with declining production and high debt, this level does not look cheap.
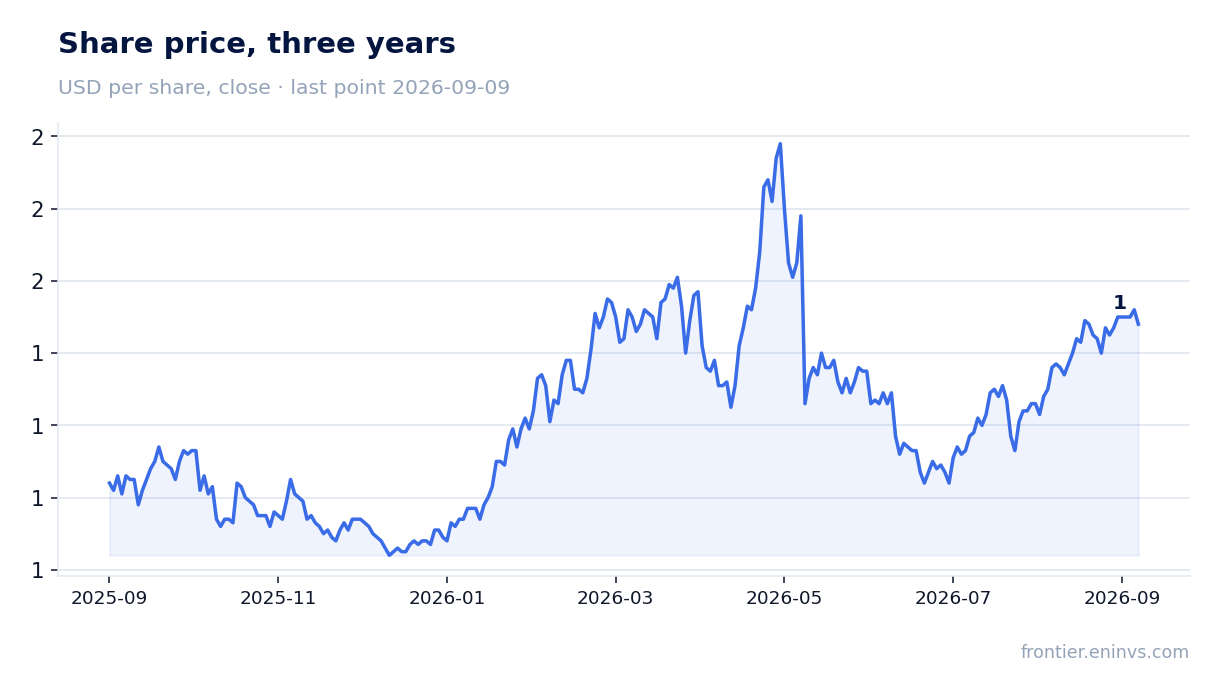
The portal model, which reprices EBITDA at current commodity prices and a target EV/EBITDA, puts the upside of the share to its fair value at -87%. This is the portal's own estimate, not a consensus. It indicates that at current oil prices and the target multiple, the share is overvalued. For an investor, this is a signal that even after a 20.3% rise from the report to 9 September, the stock does not look attractive.
Valuation on the latest reported figures
| Metric | Value |
|---|---|
| Market cap | 0.31 bn USD |
| P/B | 0.37 |
| Operating cash flow (LTM) | 0.15 bn |
| ROE | 37.7% |
Bottom line
The strengths of the report are revenue growth of 26.7% and a $66m debt reduction in the quarter. But revenue growth is driven by the oil price, not production, which fell 6%. Net income of $64.8m includes a $42.2m paper gain on derivatives, while adjusted free cash flow is just $4.4m. At 3.0 EV/EBITDA the valuation offers no cushion against its own three-year history, and the portal model points to -87% upside. For a holder, the key question is whether the company can grow production and sustain cash flow while expanding its capital programme, or whether growth will remain hostage to oil prices.
Open the company's financial profile REI →
See also: market overview · valuation map · stock screeners